Sell BTCUSD BTCUSD will decline from 117000 towards 115000 in today's trading session. A break of structure occurred and now price seems to be free falling.
BTCUSD.PM trade ideas

Bitcoin harmonic pattern. Back to back Gartley. BTCGOLD ratio.The BTC/GOLD ratio has experienced a significant correction, currently standing at 27 gold ounces per 1 Bitcoin, down from a peak of 41, representing a decline of 34%.
Gold, priced at $3,114 in US Federal Reserve notes, is in a sustained bull market.
It is reasonable to anticipate that the digital equivalent of gold will gain traction once gold stabilizes at a higher price point.
The Gartley pattern is recognized as the most prevalent harmonic chart pattern.
Harmonic patterns are based on the idea that Fibonacci sequences can be utilized to create geometric formations, which include price breakouts and retracements.
The Gartley pattern illustrated indicates an upward movement from point X to point A, followed by a price reversal at point A. According to Fibonacci ratios, the retracement from point X to point B is expected to be 61.8%.
At point B, the price reverses again towards point C, which should reflect a retracement of either 38.2% or 88.6% from point A.
From point C, the price then reverses to point D. At point D, the pattern is considered complete, generating buy signals with an upside target that aligns with points C and A, as well as a final price target of a 161.8% increase from point A.
Often, point 0 serves as a stop-loss level for the entire trade. While these Fibonacci levels do not have to be precise, greater proximity enhances the reliability of the pattern.
Will these consecutive Gartley patterns succeed in bolstering Bitcoin's strength? We will soon discover the answer.

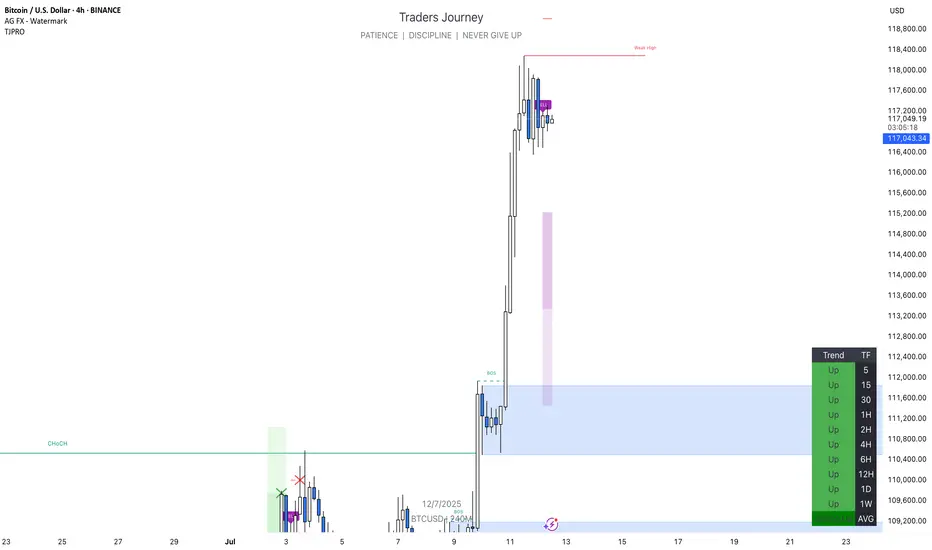
Bitcoin - Trust the higher timeframe!⚔️Bitcoin ( CRYPTO:BTCUSD ) is still 100% bullish:
🔎Analysis summary:
For the past couple of months we have been seeing an overall consolidation on Bitcoin. But looking at the higher timeframe, Bitcoin remains in an underlying strong bullrun. Consolidations are always expected and no reason to freak out since everything is still bullish.
📝Levels to watch:
$100.000
🙏🏻#LONGTERMVISION
Philip - Swing Trader

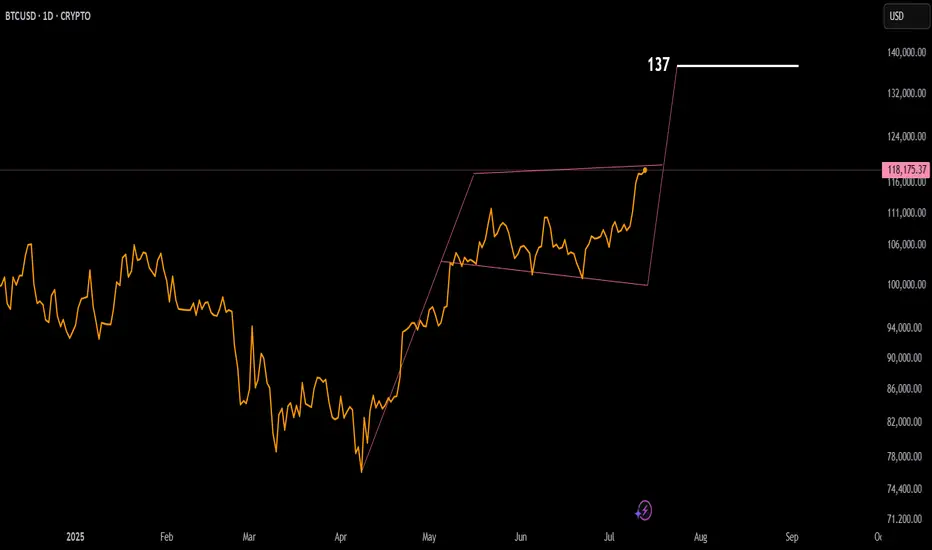
BTCUSD-Bull Flag TargetBased on the flag pole height BTC has a current target of 137. This is be so much fun!
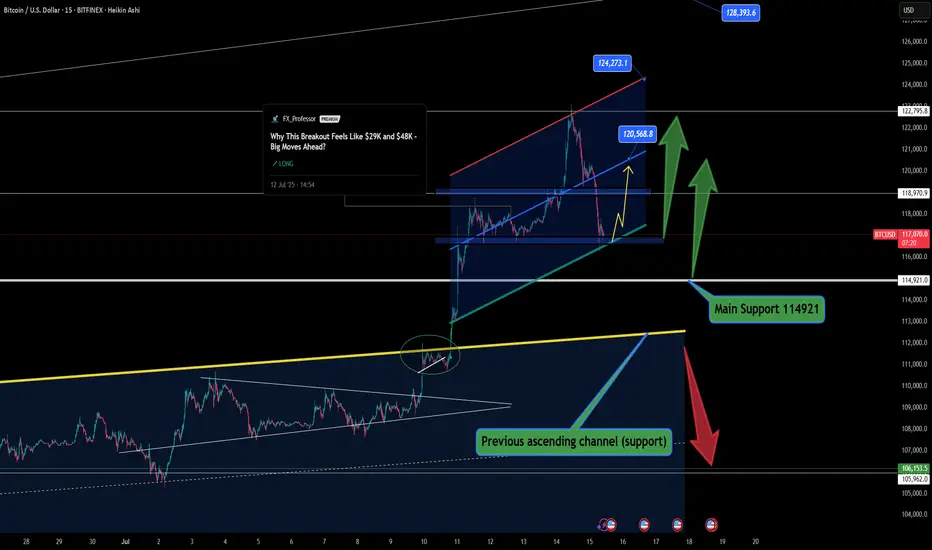
BTC Rebounds From Channel Support With Critical Levels In Focus BTC Rebounds From Channel Support With Critical Levels In Focus 🟢📉
Structure remains firmly bullish, and price action is still unfolding within our previous analysis. After the breakout above the yellow trendline, BTC has entered a new ascending channel, and we’re now testing the lower boundary of this rising structure.
The main support sits at 114,921, the level from which the breakout occurred—an essential zone that may or may not be revisited. Based on market behavior and momentum, I currently do not expect this level to be retested, but it's one that must always be respected.
🟩 A deeper correction could lead us toward the previous ascending channel support near 112,400. This would be the last resort for bulls to hold structure intact.
⚠️ A break below 112K changes the narrative completely. That would mean we’re stepping into a potential trend reversal zone—so the market could be setting up for something more significant if that unfolds.
That said, my expectation leans toward a rebound from current levels. The sell-off may have flushed out late long entries, creating space for renewed bullish momentum. Let’s follow the levels and trade what we see—not what we feel.
One Love,
The FXPROFESSOR 💙
Disclosure: I am happy to be part of the Trade Nation's Influencer program and receive a monthly fee for using their TradingView charts in my analysis. Awesome broker, where the trader really comes first! 🌟🤝📈
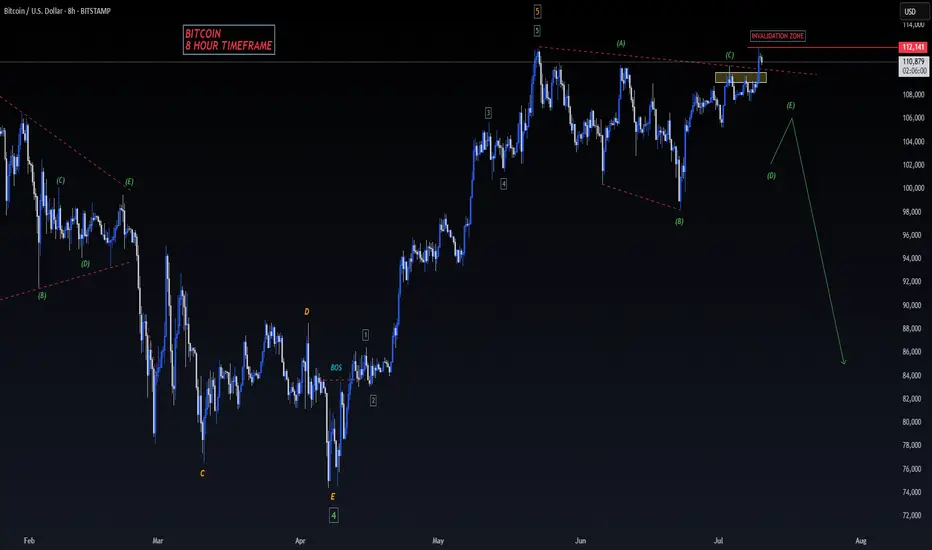
BITCOIN - SELL TO $86,000 (8H UPDATE)Bitcoin spiked up last night, but just about missed our 'Invalidation Zone' of $112,140 by a few pips. As long as this level can hold & sellers move back down, this sell analysis is still valid.
A lot of whipsaw price action in the markets right now, so use stick risk management.
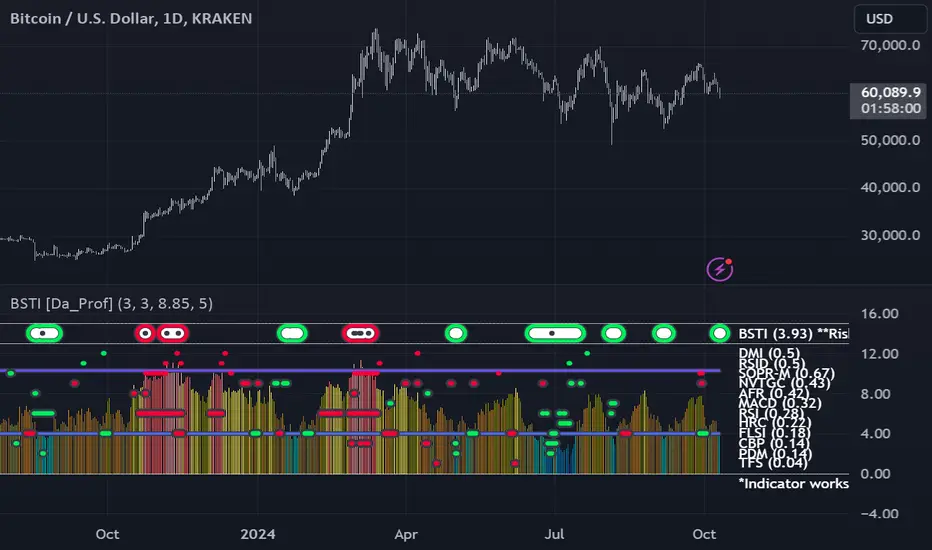
BSTI Triggered Buy SignalThe Bitcoin Swing Trade Indicator triggered a buy signal. None of the individual indicators have triggered a bottom, but the overall "risk" is below the trigger line.
Note: I know it is unfair to publish this idea when the BSTI isn't available to y'all, but what are you gonna do? It isn't quite ready for prime time, but I wanted to make y'all aware of the signal.
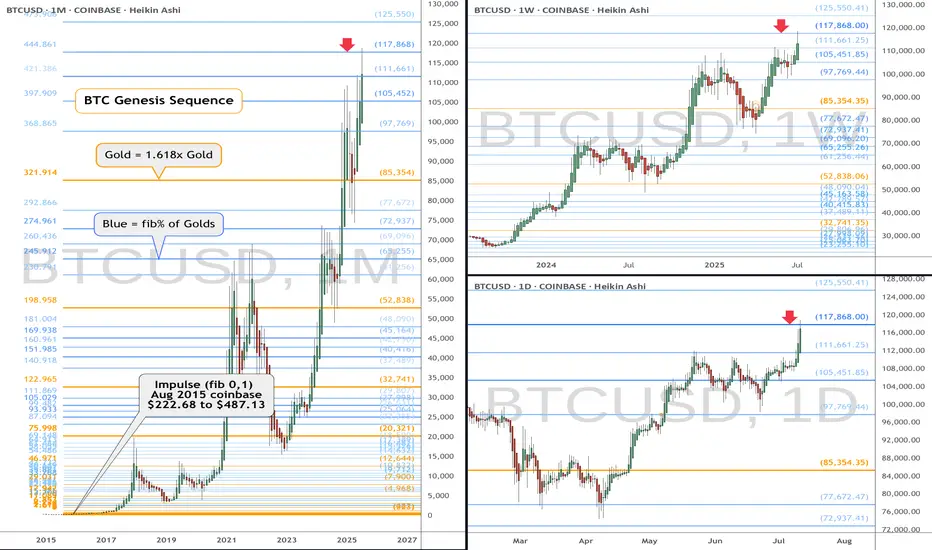
BTC eyes on $117,868: SemiMajor Genesis fib to Orbit a few times\Shown here is a single fib series in three different time-frames.
The "Genesis Sequence" has called all major turns since 2015.
This are "High Gravity" Fibs try to capture price into Orbit.
$ 117,668.00 (Coinbase) is the exact level of interest.
$ 111,661.25 is the first support below, a minor ratio.
$ 105,451.85 is semi-major and MUST hold fib below.
$ 125,550.41 is the next target above, a minor ratio.
See "Related Publications" for many PRECISE and TIMELY charts -------->>>>>>>
.
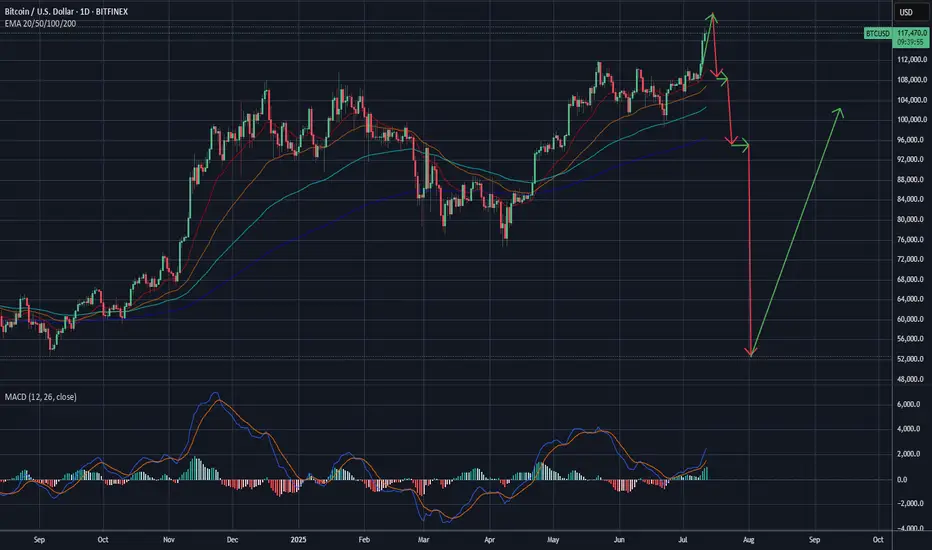
₿itcoin: Pushing Higher—But Watch for a Reversal AheadAfter taking a brief pause over the weekend, Bitcoin resumed its upward momentum early this morning, trading within the blue Target Zone between $117,553 and $130,891. This marks the first time the cryptocurrency giant has traded above the key $120,000 level. Within this zone, and in line with our primary scenario, we continue to anticipate the peak of the corrective wave B rally, followed by a trend reversal to the downside. We expect a significant wave C decline, targeting the lower blue zone between $62,395 and $51,323. As such, prices in the upper blue Target Zone may present an opportunity to take (partial) profits on existing long positions and, where appropriate, to initiate potential short positions as a hedge. These shorts could be protected with a stop 1% above the upper boundary of the zone, given there remains a 35% probability that Bitcoin could break directly above the $130,891 resistance and set a new high as blue wave alt.(i).
📈 Over 190 precise analyses, clear entry points, and defined Target Zones - that's what we do.

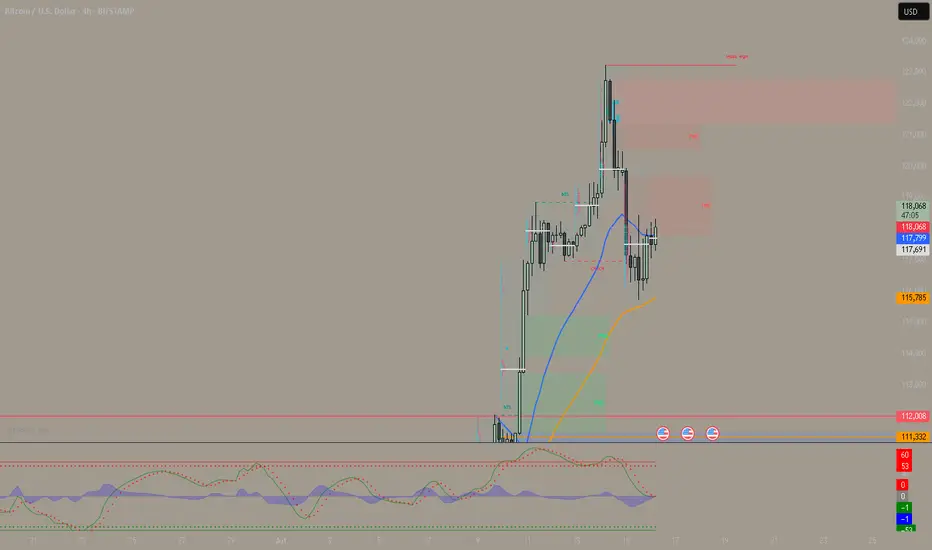
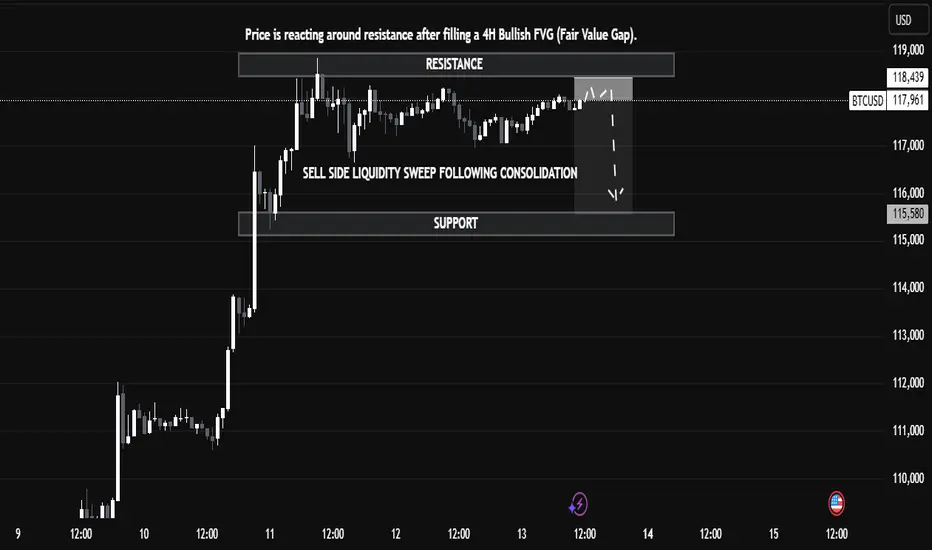
BTC/USD Technical Analysis — Educational BreakdownBTC/USD Technical Analysis — Educational Breakdown (July 13, 2025)
🔍 Market Context
Bitcoin (BTC/USD) is currently trading around $117,913, exhibiting a clear reaction from a well-defined resistance zone between $118,439 and $119,000. This resistance aligns with a previously unfilled 4H Bullish Fair Value Gap (FVG) — a price inefficiency left behind during a strong bullish move — which has now been filled, triggering a pause and reaction in bullish momentum.
🧠 Key Concepts Explained
📘 1. Fair Value Gap (FVG)
In Institutional Price Delivery models (often used in Smart Money Concepts), a Fair Value Gap represents an imbalance in price action — usually between the wicks of candles where price moved too quickly, leaving inefficient trading zones. Price often retraces to these areas before resuming its direction. Here, BTC has filled the 4H Bullish FVG, which acts as a magnet for price and a potential reversal point once filled.
📘 2. Liquidity Sweep
The chart highlights a Sell-Side Liquidity Sweep — this occurs when price dips below a key short-term low or consolidation range to trigger stop-losses and collect liquidity before making its next move. This move is typically engineered by larger market participants to capture orders before deciding on true directional intent.
📘 3. Resistance and Support
Resistance ($118,439 – $119,000): This area is acting as a supply zone where sellers are stepping in after price filled the FVG.
Support ($115,580): This level has previously provided demand and also holds liquidity (stop-losses from long positions), making it a probable target if bearish pressure follows through.
📈 Potential Trade Insight (Educational)
⚠️ This is not financial advice but an educational scenario based on the current technical setup.
Bearish Setup: If price rejects from resistance and forms a lower high, a short entry targeting the support zone at $115,580 could be considered, using a stop above $119,000.
Bullish Invalidator: A break and hold above $119,000 would suggest bullish continuation, potentially targeting higher time frame imbalances or resistance.
📚 Summary & Takeaway for Learners
This chart presents an excellent case study in understanding how institutional concepts like FVGs, liquidity sweeps, and key supply/demand zones interact in real price action. Traders can learn the following from this setup:
Price doesn’t move randomly — it often targets liquidity and imbalances.
Patience is key — waiting for confirmation at known reaction zones can improve trade accuracy.
Market context matters — a filled FVG at resistance combined with a liquidity sweep gives confluence to a bearish outlook.
BTC/USDStill the most likely scenario. I believe we're near peak positive sentiment.
As I stated prior:
"I've been calling for a crash for a while.
The closer to the top you are, the more hatred that you'll get for calling one.
It's a difficult position being contrary to the crowd. I think that's why Peter denied Jesus.
In any case, positive sentiment must end and as overdue as it is, I'm expecting a bang, after a final wave of FOMO."
BTC/USD Today: Momentum Builds Toward the Next BreakoutBITSTAMP:BTCUSD Today: Momentum Builds Toward the Next Breakout
Previously on BTC...
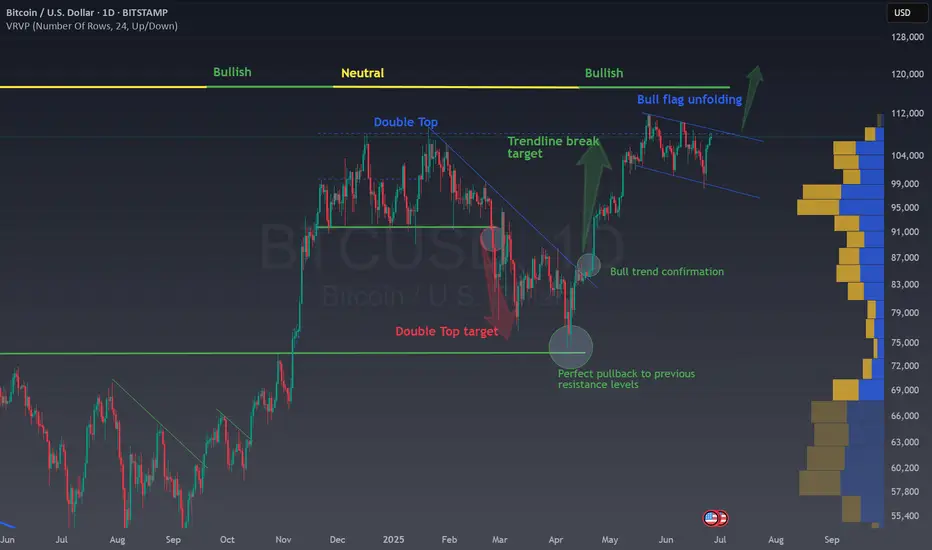
1. Double Top Pattern and Target Hit
The chart shows a classic double top (early 2025), a bearish reversal pattern. Once the neckline broke, the price plunged and nailed the technical target (red arrow)—as if Bitcoin had read the textbook.
2. Trendline Break = Game Changer
After bottoming out, BTC broke through a downward sloping trendline, triggering a strong bullish move. This breakout signaled a trend reversal, and the market responded accordingly.
3. Perfect Pullback
Once the breakout played out, the price retraced back to previous resistance, now turned support. This “perfect pullback” is the kind of thing that makes technical analysts smile in their sleep.
4. Bull Trend Confirmation
The successful retest of support confirmed that Bitcoin had shifted from neutral/bearish into a full-on bull trend. Buyers stepped back in with confidence.
📊 BTC/USD – Current Outlook
Bull Flag Forming
Currently, price action is consolidating into a bull flag, a continuation pattern often seen mid-rally. If it breaks out to the upside, the projected target sits near $120,000 .
🚀 Bullish Catalysts:
- Strong structural trend: Higher highs and higher lows are still intact.
- Post-halving momentum: Historically, Bitcoin tends to go beast mode 6–12 months after each halving—and we’re right in that sweet spot.
- ETF inflows : Institutional capital continues pouring into Bitcoin ETFs, adding steady buying pressure.
- Supply crunch: With more BTC leaving exchanges, sell-side liquidity is drying up. Hodlers are hodling.
- Technical setup: A confirmed breakout from the bull flag could trigger a powerful leg higher.
⚠️ Risks and Levels to Watch:
A breakdown of the bull flag could send BTC back toward the $98k–91k range.
Macro headwinds (rate hikes, economic slowdown, dollar strength) could still rain on crypto’s parade.
🧠 Conclusion
This chart paints a textbook bullish setup for Bitcoin. The double top is in the rearview mirror, the trendline breakout gave us the green light, and now the bull flag is loading the next move.
If the breakout happens, the next destination could be $120,000.
It’s one of those “don’t blink” moments—BTC might just be stretching before its next sprint.
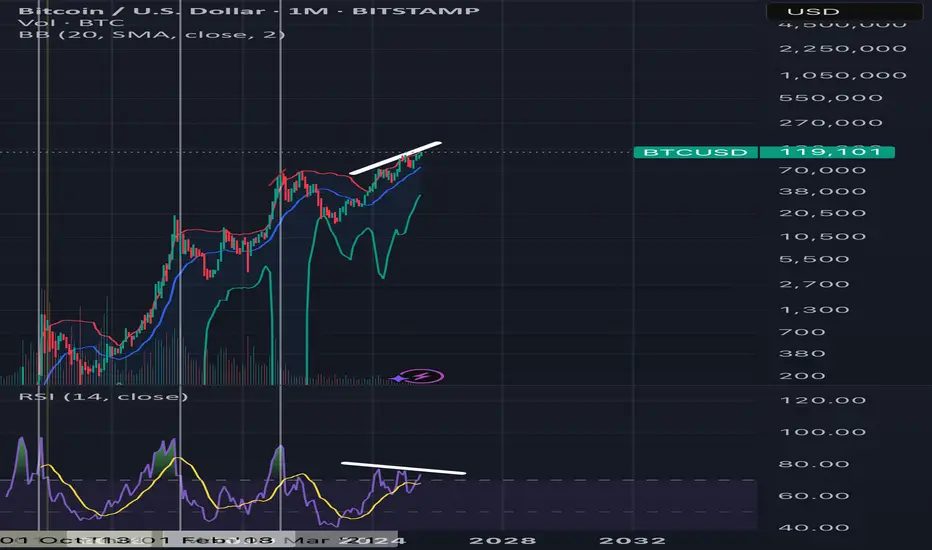
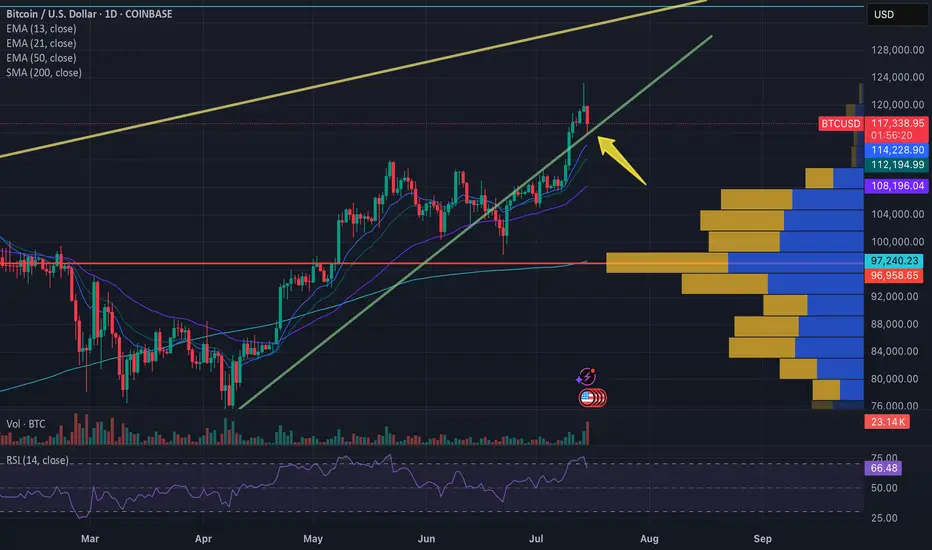
BTC – Final Push Before the Top? Here's What I’m WatchingBeen getting a lot of questions recently about where I think BTC tops this cycle, so I figured it’s time to lay out what I’m seeing on the higher timeframes and what could be coming next.
First off, I want to stress this again — USDT.D will be the key chart for spotting the top. It’s been one of the most accurate indicators across the board for understanding tops and bottoms. But it’s even more powerful when used alongside broader structure and confluence, which is what I’m doing here.
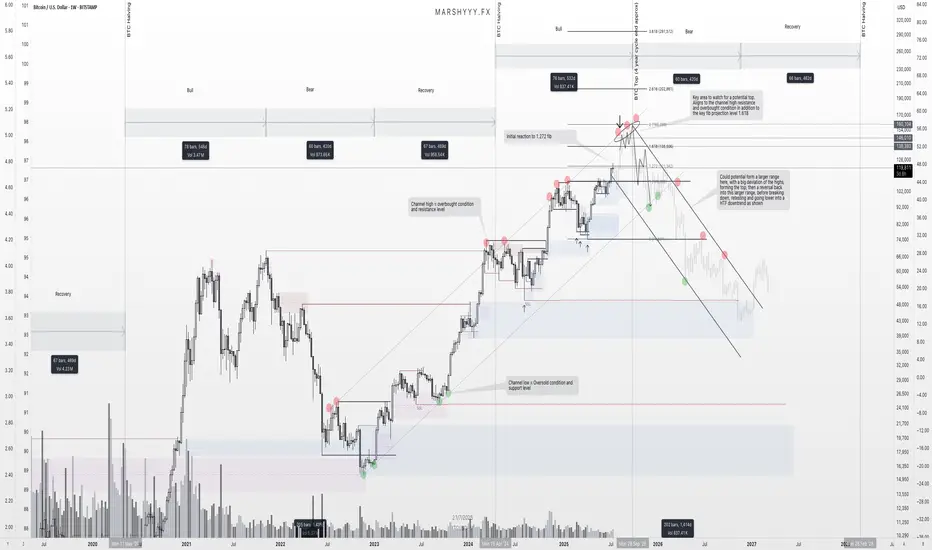
Looking at BTC’s high timeframe structure, I’ve been tracking this ascending trend channel since 2023 — and we’ve remained within its bounds beautifully. Every leg up has been met with a reaction near the channel highs, while each major correction has tapped into the lower channel support or just below midline before continuing the trend.
Right now, price is pushing back up toward that upper channel resistance, and if it behaves like it has previously, I’d expect it to act as a major magnet again. That aligns with a projected range of $140,000 to $160,000, depending how deep the wick runs or how extended this move gets from the channel midline.
On top of that, fib extensions from the previous high to low give us another layer of confidence. We’ve already seen a reaction at the 1.272 level, which paused price temporarily. The next big fib? The 1.618 — which sits right around $138k — adding confluence with the top of this HTF trend channel.
What makes this even more interesting is that this move is aligning near-perfectly with the 4-year cycle structure, which suggests a potential cycle top around September 2025. That’s roughly two months away, and it fits the pattern of previous cycles where BTC tops approximately 18–20 months post-halving.
As we approach this zone, I’ll be watching for the usual signs: slowing momentum, bearish divergence, volume anomalies, and rejection candles into resistance. But I won’t just be relying on the BTC chart alone. I’ll be stacking confluences from other key indicators too — USDT.D, BTC.D, macro risk indicators, and stablecoin flows — to confirm if this is truly the top or if there’s one more leg left in the tank.
Once the top does form, whether it's $138k or $160k or somewhere in between, I think we move into the distribution phase that begins the next macro downtrend. The next few years will be about preservation and accumulation again, and I’m already eyeing zones like $49k and below as potential long-term HTF demand levels when that time comes.
For now, we’re in what I believe is the final bullish leg of this cycle. I’m positioned, prepared, and watching closely for signs of exhaustion as we move into this zone of confluence.
Let the market do its thing — just make sure you’ve got a plan for when the music stops.
BTC/USDT HIDDEN PATTERN! SM, FIB AND MORE COMFIRMED!Price Resilience Amid Geopolitical Stress
Bitcoin demonstrated remarkable strength during the Israel-Iran conflict, briefly dipping to ~$98K but swiftly rebounding above $105K. This aligns with historical patterns where BTC initially sells off on geopolitical shocks but recovers aggressively within weeks, outperforming gold and equities by 15-60% post-crisis. There is a $96K-$94K "footprint" that coincided with institutional accumulation, evidenced by $1.37B in spot ETF inflows during the conflict week, led by BlackRock's IBIT ($240M single-day inflow) according to official information. This institutional backstop and many others might single-handedly prevented a deeper correction for now, remember that smart money psychology is to create cause out of thin air and buy during selling and indecisive times.
Critical Levels to Watch
Immediate Support: $108k area is vital. A sustained hold here maintains short-term bullish momentum. The 50-day SMA near $102.8K (tested during June 13 conflict sell-off) remains a macro support floor.
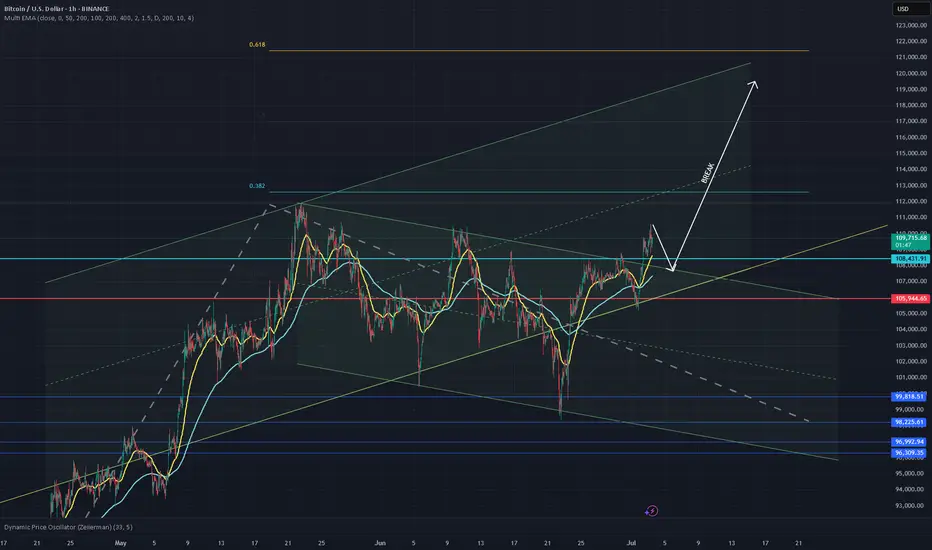
Resistance & Targets: The $112K ATH is the near-term ceiling. Breaking this requires stronger spot demand—currently, net exchange inflows are negative, indicating weak retail participation or traders that are backing off for now.There's a $120K target (0.618 Fib) aligned with Standard Chartered’s $150K year-end model if ETF inflows persist.
Risk Zones: A close below $108.3K risks a slide to $105K. Failure here opens path to $96K and a further break of this 92k to 96k zone could lead directly to 70k area or even lower if economical and social activities are not favorable in the near to medium future.Dominance above 55% (currently 65%) delays alt season, but a break below 60% could ignite alts in a positive way.
Macro Catalysts & Market Sentiment
Policy Tailwinds: Trump’s "One Big Beautiful Bill" (proposing $5T debt ceiling hike and U.S. strategic BTC reserves) could weaken the USD, boosting BTC’s "digital gold" narrative. DXY’s -9% YTD drop already correlates with BTC’s 54% post-election rally.
Fed Influence: Pressure to cut rates (amid cooling employment data) may accelerate institutional rotation into BTC. ETF inflows hit $2.75B in late June, signaling renewed institutional FOMO.
Geopolitical Cooling: Iran-Israel ceasefire talks reduced immediate panic, but residual volatility risk remains. Traders note BTC often rallies 20-40% within 60 days of conflict events.
Structural Challenges
Liquidity Fragility: Whale moves (for example: 10K BTC sell orders) now impact prices more due to ETF-driven liquidity concentration. Recent $98K flash crash exemplified this.
Regulatory Overhang: MiCA compliance costs in the EU and U.S. security-reclassification proposals could pressure smaller tokens, though BTC’s status appears secure 28.
Seasonal Slump: July historically sees 6.1% of annual crypto volume—low volatility may delay breakouts until August 4.
Strategic Outlook
A July breakout above $112K could ignite the next leg to $120K, but a retest of $107K-$105K is likely first. Altcoins remain subdued until BTC dominance breaks <55%—select projects with institutional backing (for example, ETF candidates) or real-world utility for asymmetric opportunities.
Conclusion: BTC’s resilience amid chaos confirms its institutional maturity. Trade the $108.3K-$112K range aggressively, with a break above ATH targeting $120K by September. Always hedge tail risks (escalations, regulatory shocks) in this volatility-rich asset class. While this great surge in institutional inflow is good for BTC it also indicates a reduction or slower pace of other crypto currencies.
This is my analysis for BTC, let me know what you think and I hope you like it!
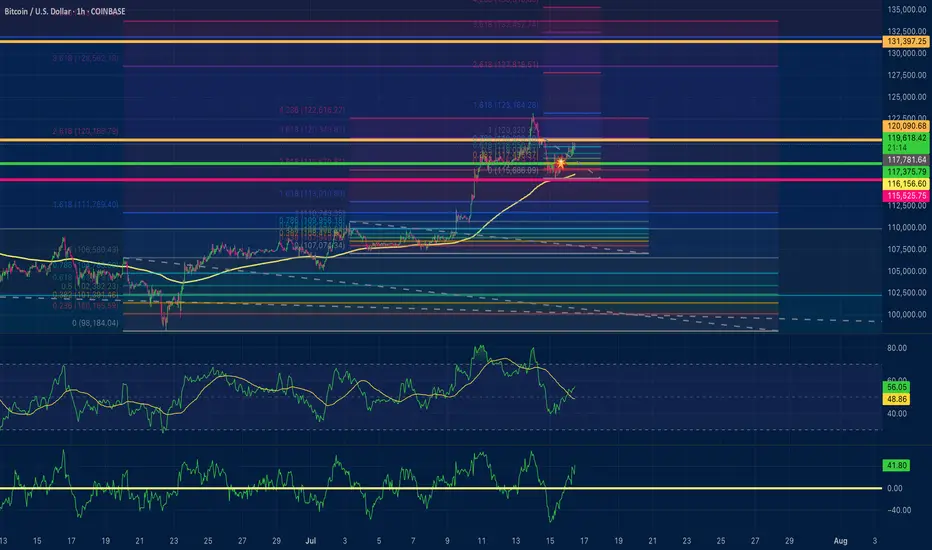
Bitcoin positive diversion to $131,000Using fibonacci retracements for price targets based off of positive divergences on the 15 min time frame and hourly time frame. I am utilizing 2 ioscilating indicators: RSI length is 36 with smma at 50 and the Chande momentum oscillator with a length of 24. My conservative estimate is $131,000 for a safe trade close. $132,400 exact area for pullback to $128,500?
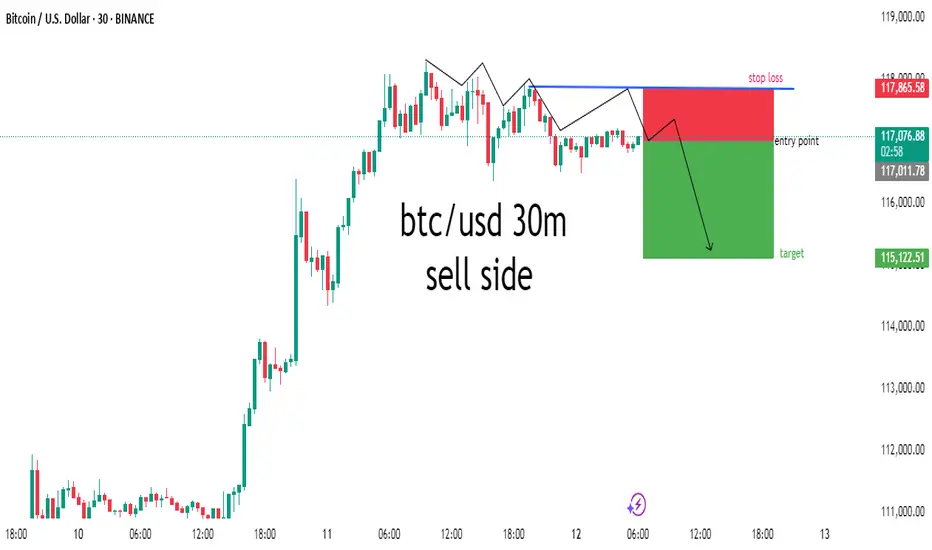
SELL signal has emerged on the BTC/USD chart, potential bearishSELL Signal: Activated at 117119.46, after price reacted from a potential supply zone and started to shift structure downward, signaling a possible short-term reversal.
TP Zones:
TP1: 115230.22
TP2: 113340.99
Final TP: 111451.75
This setup offers a potential profit range of approximately +1,889 to +5,667 pips from entry.
Market Structure:
Price recently pushed into premium levels and met supply. The rejection from this zone aligns with internal structure shifts, suggesting a bearish correction is in play. This setup is supported by a clean risk-to-reward layout, with the stop-loss placed above recent highs.
Remember to manage your trades carefully and ensure this setup fits your overall strategy. Stay sharp and trade responsibly!
Bitcoin Backtest and continuation to $135000See trendline and respecting the support, looking for continuation up this week
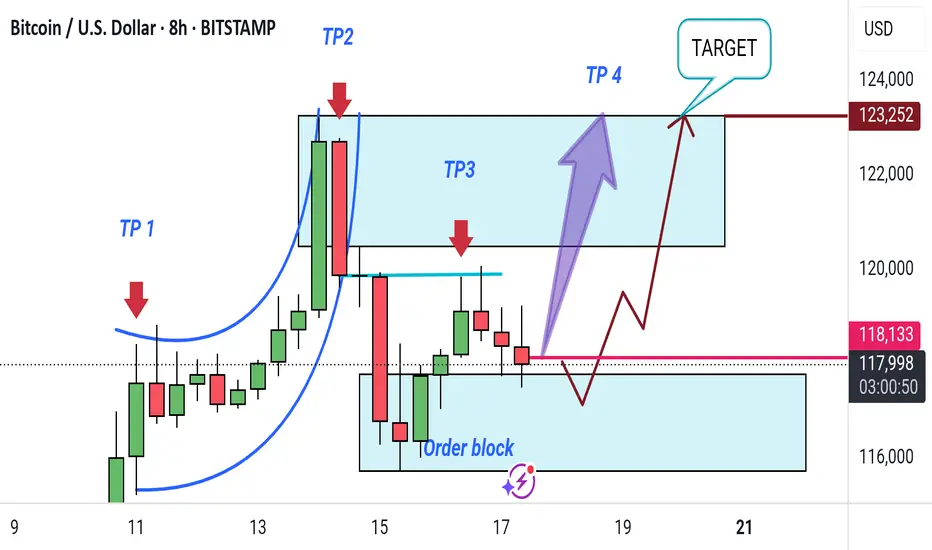
"Bitcoin Bullish Reversal Setup with Target Zones (8H Chart)"This 8-hour Bitcoin/USD chart shows a potential bullish setup. Key takeaways include:
Order Block: Identified support zone for possible reversal.
TP1 to TP4: Target points for profit-taking as price moves upward.
Target Zone: Final target area near $123,252.
Expected move: A short-term dip into the order block, followed by a rally toward the target zone.
btc/ usd bearish 30mmarket may be sell side because the market is not working some time ago and few clocks ago market fast working by long side .And now market may be short side .
Bitcoin / U.S. Dollar 4-Hour Chart (BTCUSD)4-hour chart displays the recent price movement of Bitcoin (BTC) against the U.S. Dollar (USD) as of July 11, 2025. The current price is $117,979.53, reflecting a 4-hour increase of $1,938.91 (+1.67%). The chart highlights a significant upward trend, with a notable breakout above the $114,719.92 resistance level, reaching up to $121,362.93. Key price levels include support at $116,625.93 and resistance at $121,362.93, with buy and sell options marked at the current price.
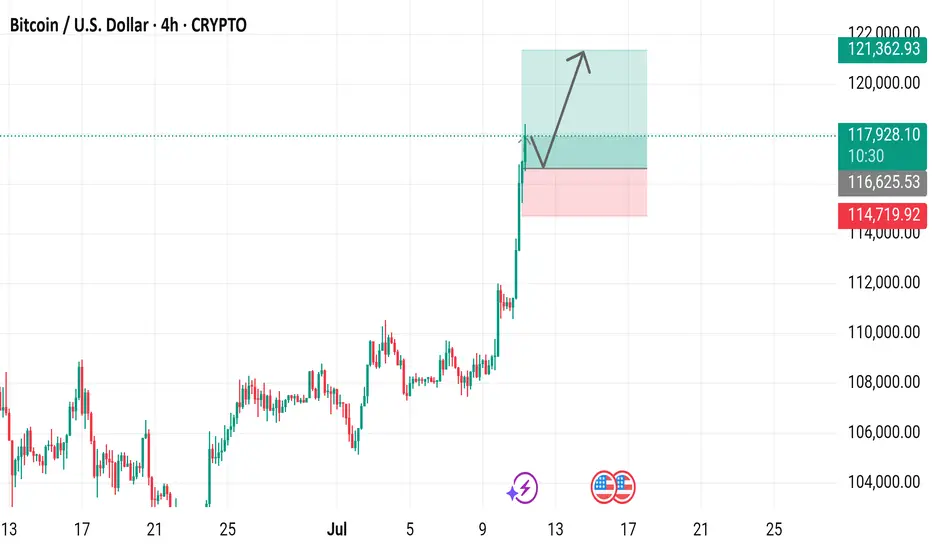
Hold positions on break-even, price can move upward.
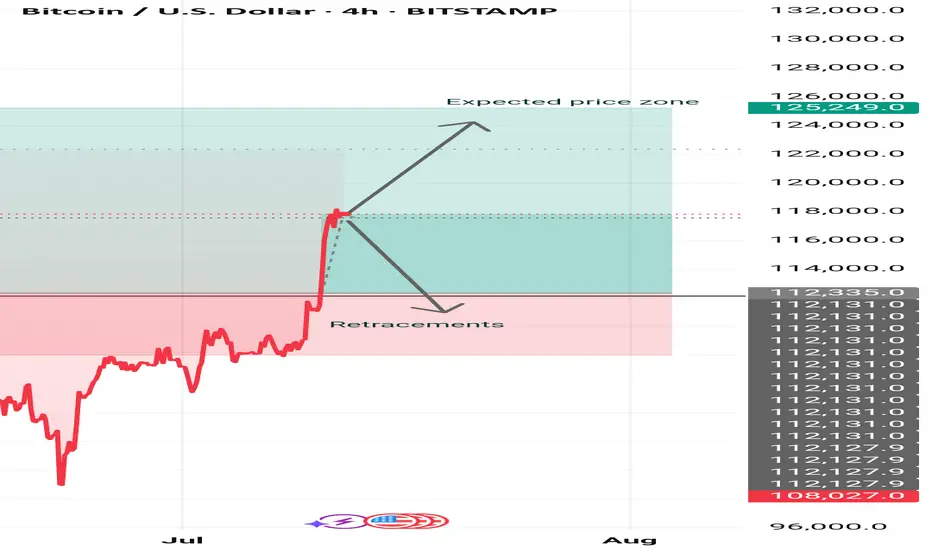
Significance.This zone marks a potential pullback area if BTC faces selling pressure. It’s highlighted as a place where the price may retest support before moving higher.
Resistance / Expected Target Zone (Shaded Green Area):
Price Range: Roughly $120,000 to $125,249
Label: "Expected price zone"
Significance: This is the bullish target range, indicating where BTC might head next if it continues upward momentum.
BTC! BREAK OUT.Initially i was hesitant to call thiss bottom and I will risk my non exsistant repution. That if we break through this resistance and pump a 1-2% break through 4 hour FVG we going ballistic I dont belive in 150k this month I believe in 127-130 k and a trtacement to 113k to fill CME gap. W tradez.