BTCUSD entering 3rd bear market cycle BTCUSD has bounced off of the top of a 4H descending channel and has now began moving in the 3rd bear market cycle
i will be watching for the market to reach the mid line in the channel and possibly to the bottom of the channel for another retest.
Opinion: This analysis is for education purposes only and is just my analysis, this is not a trade idea.
BTCUSD.PM trade ideas
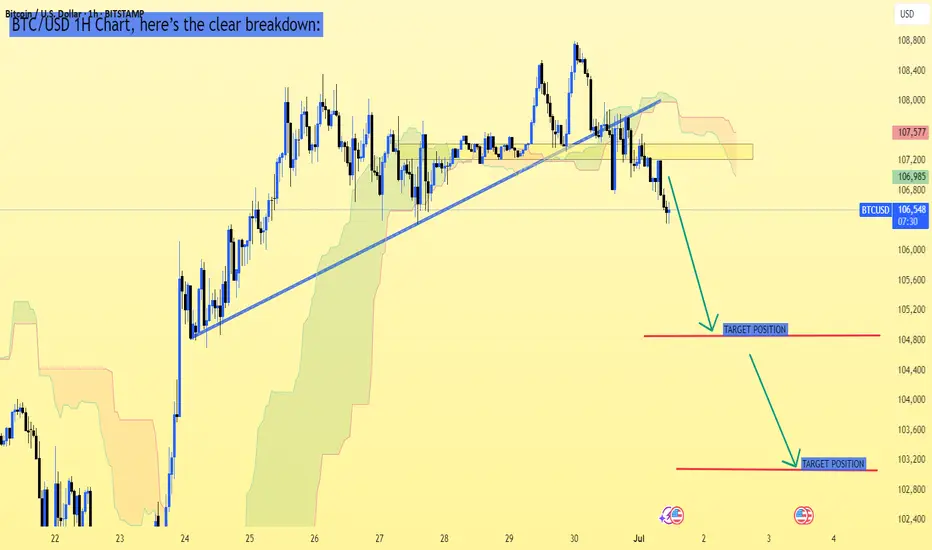
BTC/USD 1H Chart, here’s the clear breakdown:BTC/USD 1H Chart, here’s the clear breakdown:
---
Current Price:
Around 106,636 USD
---
Bearish Setup Observations:
Price has broken the ascending trendline support
Price is below Ichimoku Cloud — bearish confirmation
Retest of broken trendline area failed, suggesting more downside
---
Target Levels Based on Your Chart:
✅ First Target: Around 105,200 - 105,400 USD
✅ Second Target (Final Target): Around 103,200 - 103,500 USD
---
Conclusion:
Bearish momentum is strong; watch for price to test 105,200 zone
If that level breaks, likely move toward 103,200
Resistance area remains near 107,200 - 107,500 (good stop-loss zone for shorts)
---
Would you like a risk management suggestion for this setup? Let me know!
SHORT ON BITCOINBITCOIN has continue to create lower highs at a major resistance zone.
I will be selling bitcoin looking to make over 8000 to 20,000 points.
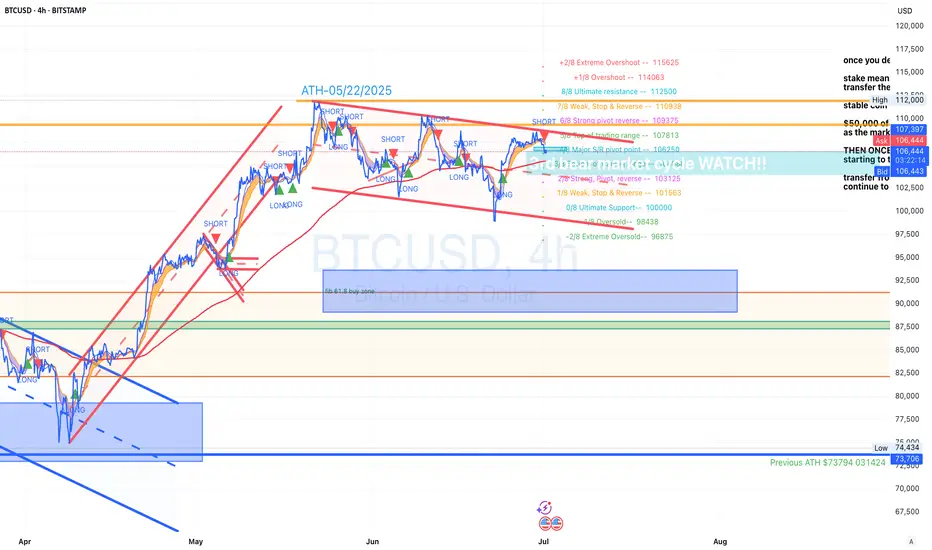
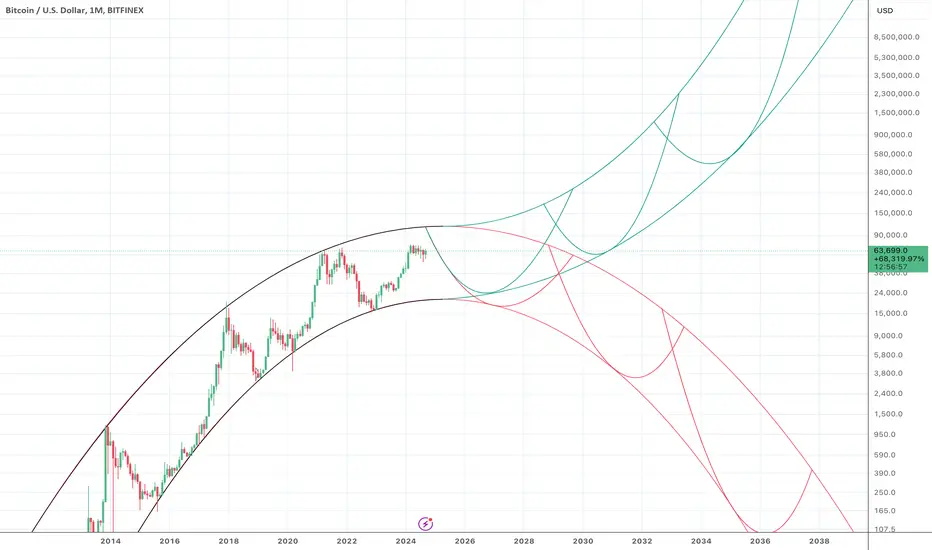
BTCUSD - The Binary Set of Possible Futures for BitcoinBitcoin priced in dollars will eventually go to infinity or to zero.
This chart is a more precise model of an idea I've been toying with for a few months. It fits the past price cycles extremely accurately, if we are willing to disregard the lower end of the Covid crash wick and stick to monthly closes. It also predicts the binary set of possible futures for Bitcoin in an extremely elegant way.
According to this model, regardless of which path Bitcoin price takes after this cycle, we will see a top around $111,800 around spring 2025 - April 2025 if it hits the nadir of the arch exactly.
We will have a strong clue about which of the two futures (infinity or zero) Bitcoin is headed towards when we see whether it bottoms near $16,000 (Bitcoin to Zero) or bottoms near $24,000 (Bitcoin to Infinity) next bear market.
The model predicts hyperinflation of the dollar in 2037 on the "Bitcoin infinity path," or alternatively Bitcoin to digital trash in 2036 on the "Bitcoin zero path."
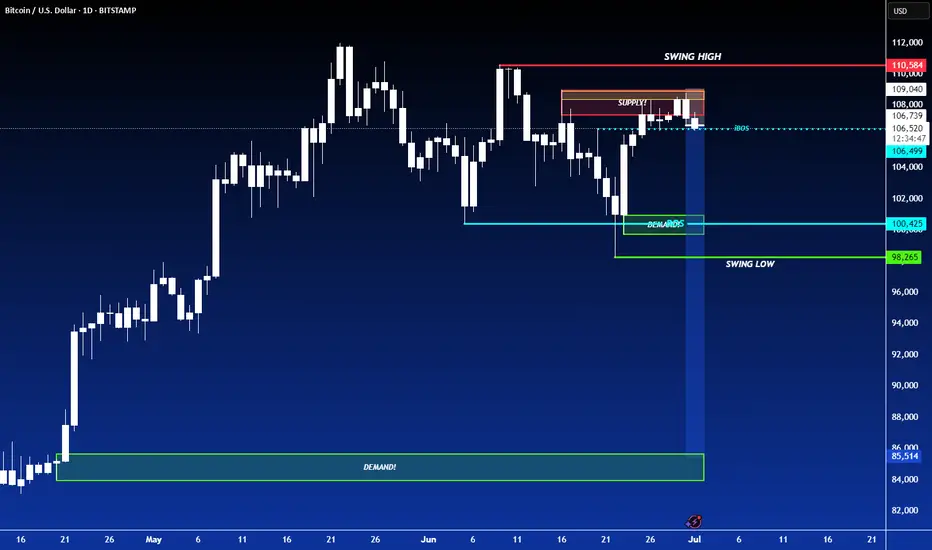
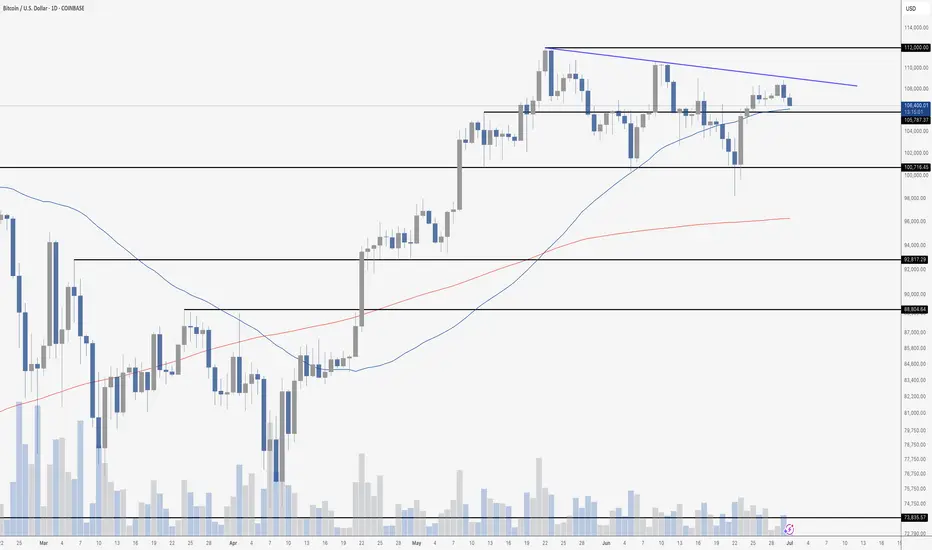
Bitcoin ConsolidatesBitcoin is currently consolidating just below a clear descending trendline, showing a series of lower highs since its recent local top near $112,000. Price is hovering around $106,300, holding just above key horizontal support at ~$105,800. This level coincides with the 50-day moving average (blue), which is currently acting as dynamic support.
So far, Bitcoin has respected the ~$100,700 level as major support after the mid-June shakeout. As long as price remains above that zone and holds the 50 MA, the bullish structure remains intact despite the short-term lower highs. But the more price compresses beneath the descending resistance, the more likely we see a breakout (or breakdown) soon.
The 200-day moving average (red) is well below current price action, hovering near $95,000. That’s a long way down and would likely only be tested if broader market conditions deteriorate significantly.
Volume is tapering, suggesting traders are waiting for a decisive move. A break above the descending trendline and reclaim of $110,000+ would invalidate the current short-term downtrend and likely bring $112,000 and new highs into view. A loss of $105,800, on the other hand, puts $100,700 back in play – and below that, things could get ugly quickly.
For now, the trend is neutral within a broader uptrend. The bulls are holding the line – but just barely
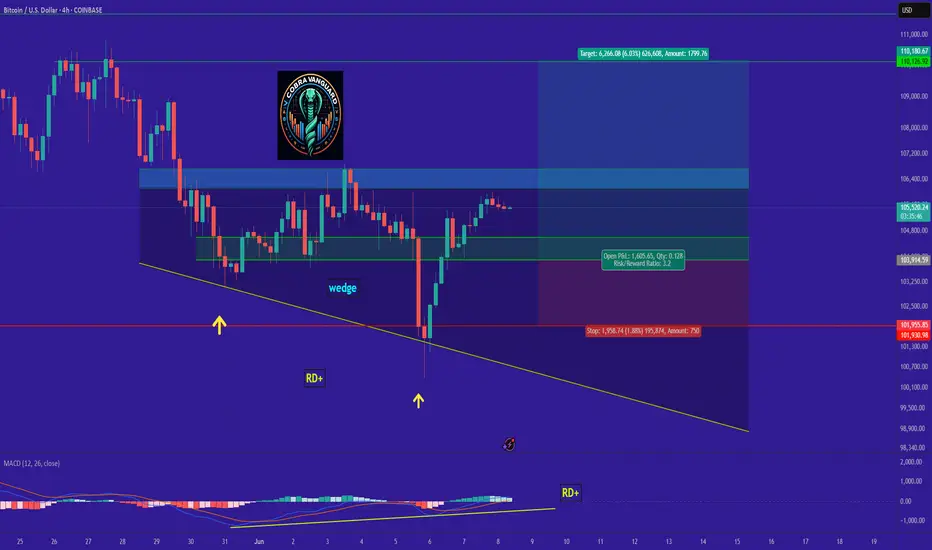
Bitcoin is bullish now & many Traders don't see it !!!I currently expect the price to correct slightly, as indicated on the chart, and then pump by about 6% from the PRZ . This signal is reinforced by strong positive divergence and a wedge pattern. In summary, the PRZ is a solid entry point, derived from the confluence of touchlines and pivots. However, if the price ignores this zone and falls below it, my analysis will be invalidated.
Best regards CobraVanguard.💚
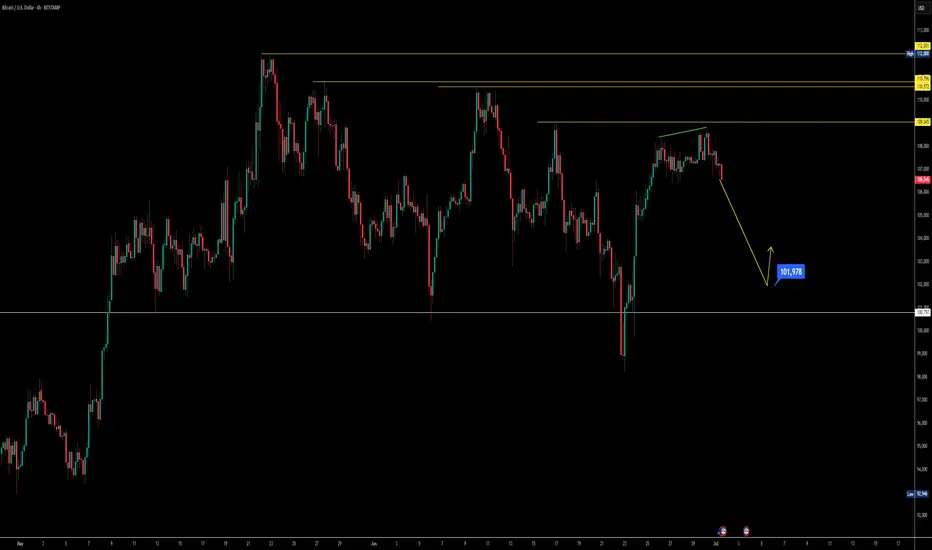
BTC Pullback or Breakout? Key Levels to Watch Around 110KBitcoin is showing repeated rejections from the $110K and $108K zones. Currently, it's moving upward from the $98K area toward resistance, but price action remains compressed between the major trendline support and resistance.
This range-bound structure suggests that a pullback may be imminent, especially as RSI is forming consistent bearish divergence and the MACD is signaling weakness. A liquidity sweep to the downside could occur before a decisive move.
However, if BTC manages to break above the converging trendlines with strong volume, we may see a move toward $110K again for a retest. Watch $106K as an intermediate support. If that fails, further downside may follow.
📌 Trading Insight: Wait for confirmation before entering — don’t jump in without a clear signal.
June 30 Bitcoin Bybit chart analysisHello
This is Bitcoin Guide.
If you "follow"
You can receive real-time movement paths and comment notifications on major sections.
If my analysis was helpful,
Please click the booster button at the bottom.
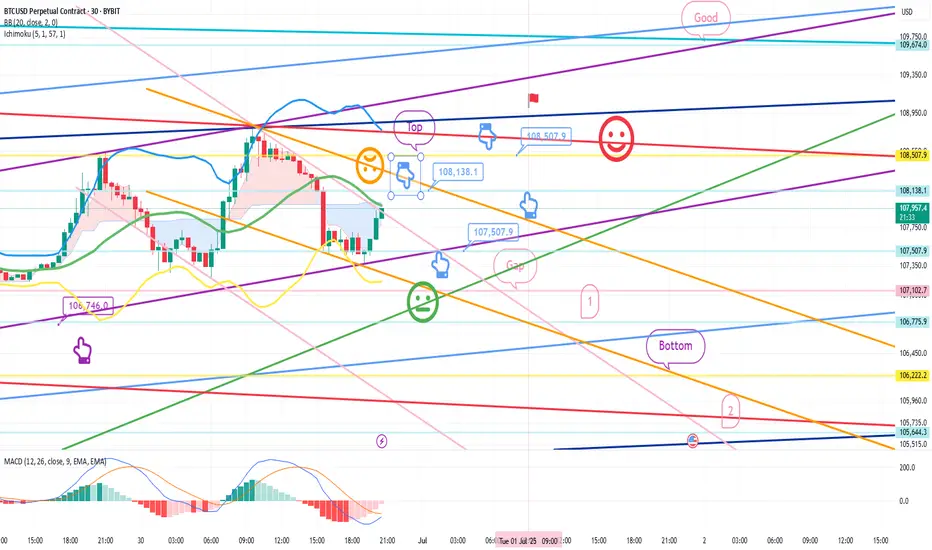
This is the Bitcoin 30-minute chart.
There is no separate indicator announcement today.
The weekly and daily charts are being adjusted at the same time as they are created.
The strategy was carried out based on the Nasdaq pattern and the Tether dominance pattern.
The long position entry section on the 25th, $106,746, was connected as is.
*When the blue finger moves,
It is a two-way neutral
short->long switching or long waiting strategy.
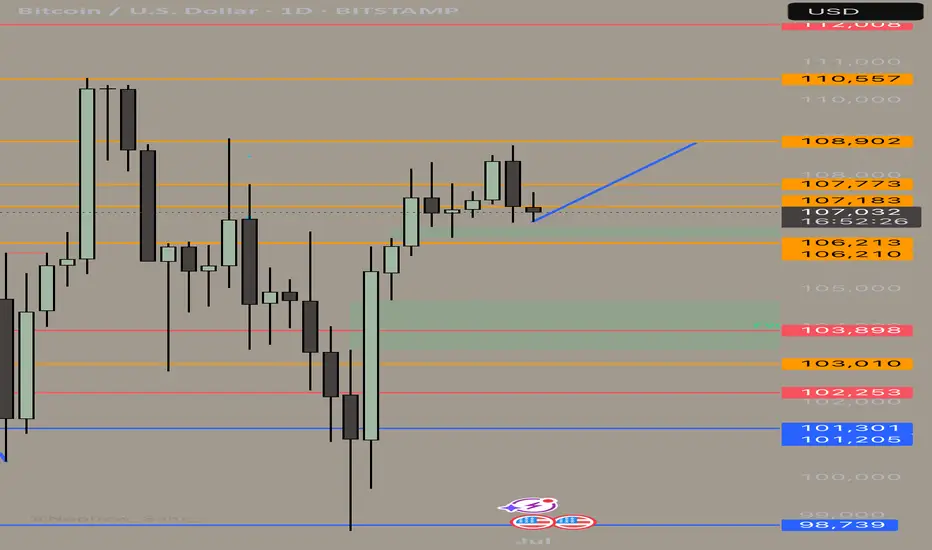
1. $108,138.1 short position entry section / stop loss price when orange resistance line is broken
2. $107,507.9 long position switching / stop loss price when green support line is broken
3. $108,507.9 long position 1st target -> Good 2nd target price
You can also use the long position re-entry indicated in the middle.
If it comes down right away without touching the short entry section at the top,
it is a long waiting strategy at the gap section of 107,102.7 dollars,
and the stop loss price is the same.
And, if it succeeds in rebounding within the purple support line today,
the reason it is safe from a long position is
because the low point of the weekly and daily candles created this week is maintained without additional deviation.
Please note that the 1st section at the bottom is a sideways market / the 2nd section is open up to the bottom.
Please use my analysis article so far only for reference and use,
and I hope you operate safely with the principle trading and stop loss price.
Thank you.
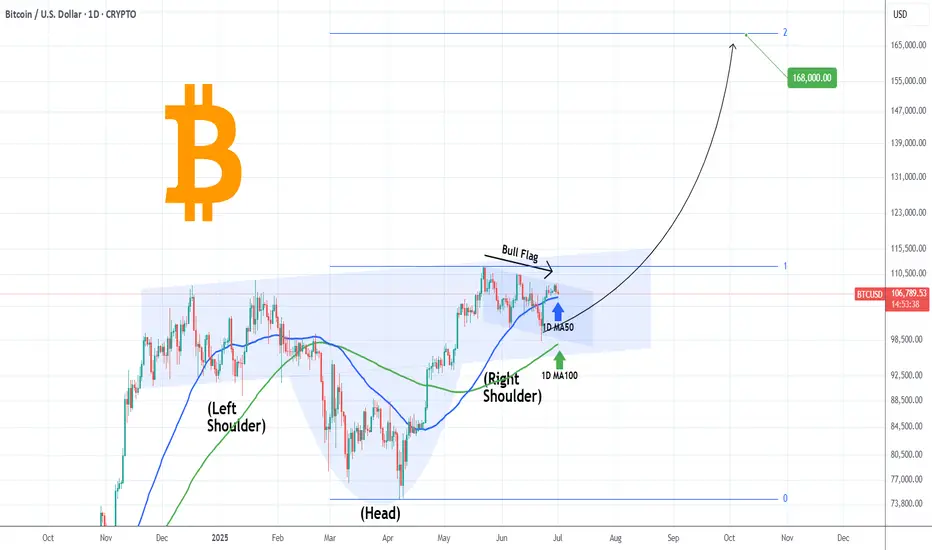
BITCOIN Can this Inverse Head and Shoulders deliver $168000?We saw yesterday how Bitcoin (BTCUSD) has been trading within a short-term Channel Down pattern, which as mentioned was just a Bull Flag on the long-term scale.
Today we examine this on the longer term time-frame and what stands out on 1D is an Inverse Head and Shoulders (IH&S). Such patterns are incredibly bullish but are more often seen on market bottoms initiating strong long-term bullish reversals.
This time it has been formed on a 1W Bull Cycle uptrend (Channel Up), so it technically serves as a (very) long-term Accumulation Phase between the Cycle's previous All Time High (ATH) and the next one, which most likely will be the final (peak) of the Bull Cycle.
As mentioned numerous times in the past, IH&S patterns target their 2.0 Fibonacci extension level once broken. That is now at $168000 and falls well within the broader 150 - 200k range that most studies have as a potential Cycle Top.
So do you think that is realistic to expect? Feel free to let us know in the comments section below!
-------------------------------------------------------------------------------
** Please LIKE 👍, FOLLOW ✅, SHARE 🙌 and COMMENT ✍ if you enjoy this idea! Also share your ideas and charts in the comments section below! This is best way to keep it relevant, support us, keep the content here free and allow the idea to reach as many people as possible. **
-------------------------------------------------------------------------------
💸💸💸💸💸💸
👇 👇 👇 👇 👇 👇
Bitcoin setup: bearish for now but watch Trump’s crypto deadlineBitcoin is sliding, and the technicals point lower with clear RSI divergence and a possible descending triangle. But this could all change fast. Trump’s crypto working group is set to propose major changes by 23 July. If the news points to deregulation or a return of ICOs, Bitcoin could explode higher. In this video, we break down the chart, the risks, and the potential trigger that could flip sentiment overnight.
This content is not directed to residents of the EU or UK. Any opinions, news, research, analyses, prices or other information contained on this website is provided as general market commentary and does not constitute investment advice. ThinkMarkets will not accept liability for any loss or damage including, without limitation, to any loss of profit which may arise directly or indirectly from use of or reliance on such information.

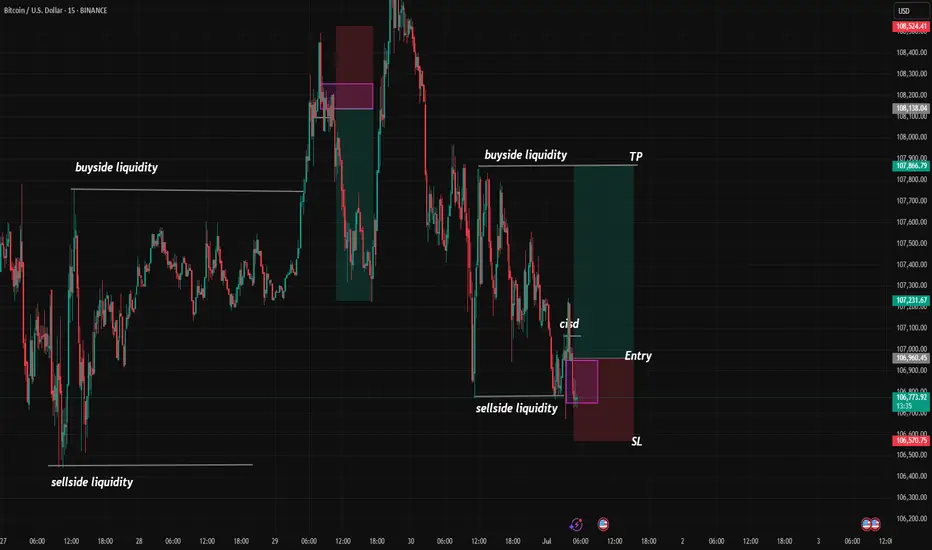
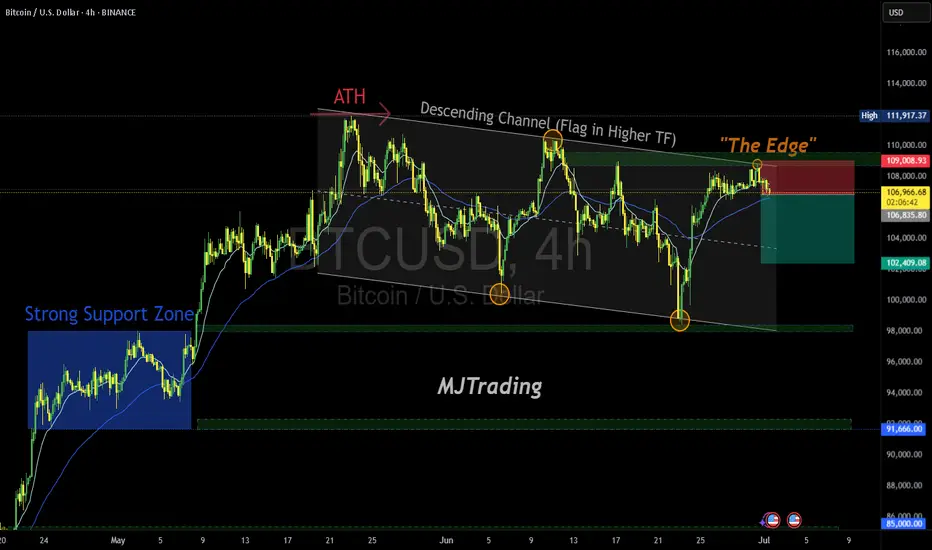
BTC/USD Short Setup – Breakdown from Bear Flag Edge🚀||| 👆Your Boost is appreciated in Advance👆 |||🚀
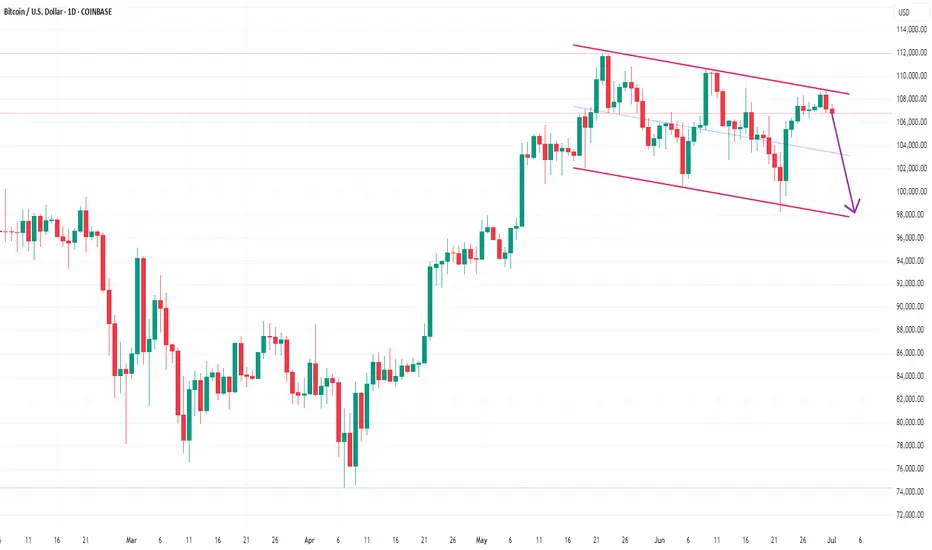
Thesis: Bitcoin is trading within a well-defined descending channel, potentially forming a bear flag on the higher time frame. Price is currently hovering just below the key resistance zone near $108,600 (“The Edge”), failing to reclaim the upper boundary of the flag.
==================================================================
Entry: 🔻 Short at $106,850 – Price is rejecting the upper channel resistance and failing to break above “The Edge”
Stop-Loss: 🔺 $109,000 – Above the recent swing high and invalidation of the flag structure
Take-Profit 1: ✅ $104,700 🎯
Take-Profit 2: ✅ $102,400 🎯
Optional extended:
TP4: $98,000 – Full measured move of the flag breakdown
Risk-Reward Ratio: ~1:1 to 1:4 depending on target
====================================================================
#MJTrading
#BTCUSD #Bitcoin #CryptoTrading #ShortSetup #BearFlag #TechnicalAnalysis #PriceAction #MarketStructure #SwingTrade #TradingView
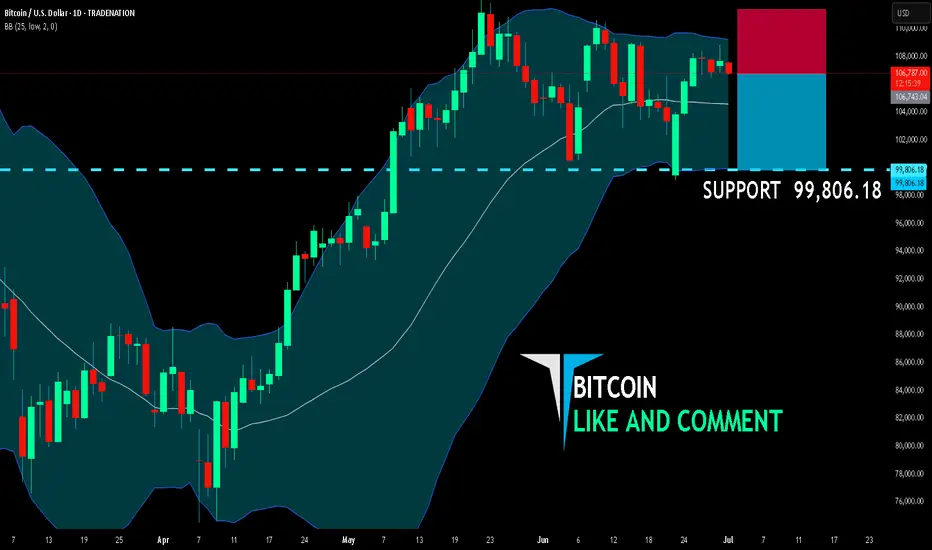
BITCOIN BEARS ARE GAINING STRENGTH|SHORT
BITCOIN SIGNAL
Trade Direction: short
Entry Level: 106,743.04
Target Level: 99,806.18
Stop Loss: 111,349.12
RISK PROFILE
Risk level: medium
Suggested risk: 1%
Timeframe: 1D
Disclosure: I am part of Trade Nation's Influencer program and receive a monthly fee for using their TradingView charts in my analysis.
✅LIKE AND COMMENT MY IDEAS✅
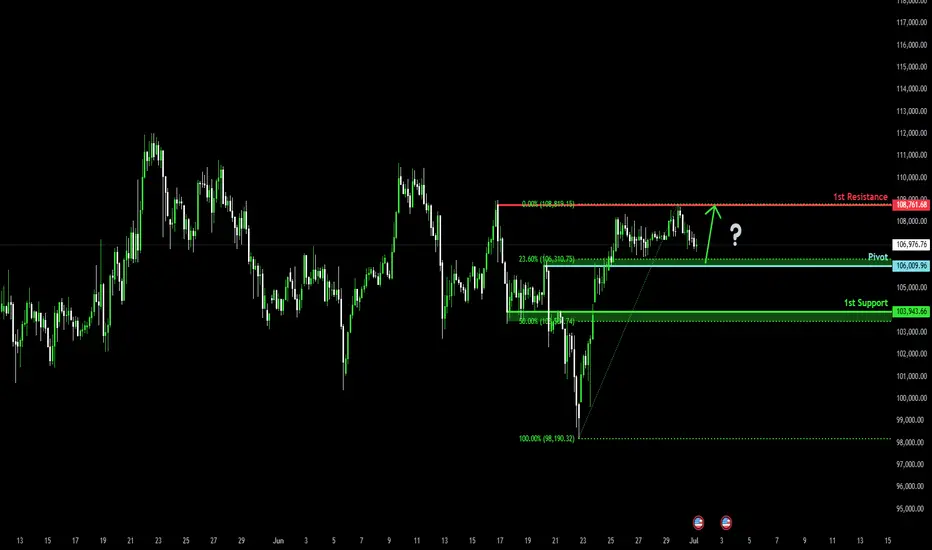
Bullish bounce?The Bitcoin (BTC/USD) is falling towards the pivot which acts as a pullback support and could bounce to the 1st resistance.
Pivot: 106,009.96
1st Support: 103.943.66
1st Resistance: 108,761.68
Risk Warning:
Trading Forex and CFDs carries a high level of risk to your capital and you should only trade with money you can afford to lose. Trading Forex and CFDs may not be suitable for all investors, so please ensure that you fully understand the risks involved and seek independent advice if necessary.
Disclaimer:
The above opinions given constitute general market commentary, and do not constitute the opinion or advice of IC Markets or any form of personal or investment advice.
Any opinions, news, research, analyses, prices, other information, or links to third-party sites contained on this website are provided on an "as-is" basis, are intended only to be informative, is not an advice nor a recommendation, nor research, or a record of our trading prices, or an offer of, or solicitation for a transaction in any financial instrument and thus should not be treated as such. The information provided does not involve any specific investment objectives, financial situation and needs of any specific person who may receive it. Please be aware, that past performance is not a reliable indicator of future performance and/or results. Past Performance or Forward-looking scenarios based upon the reasonable beliefs of the third-party provider are not a guarantee of future performance. Actual results may differ materially from those anticipated in forward-looking or past performance statements. IC Markets makes no representation or warranty and assumes no liability as to the accuracy or completeness of the information provided, nor any loss arising from any investment based on a recommendation, forecast or any information supplied by any third-party.
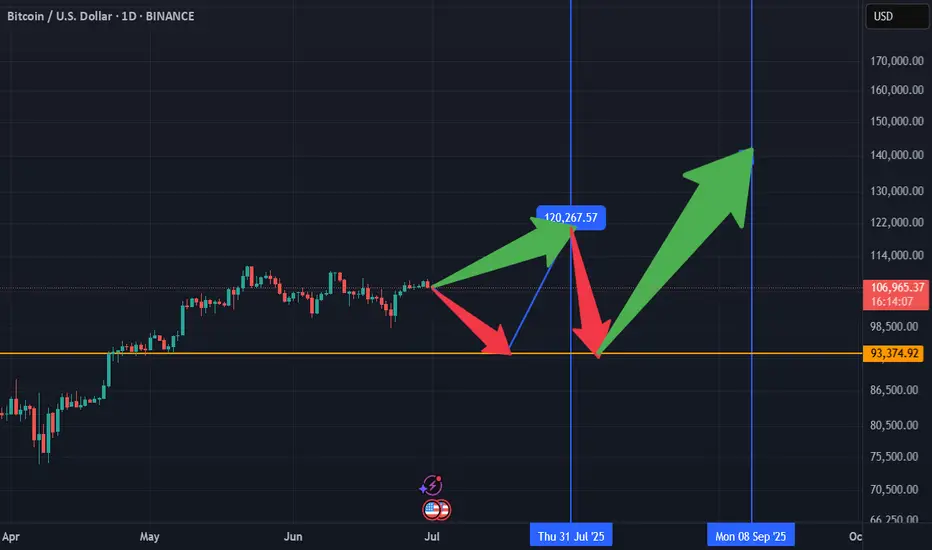
BTC 93k first or 120-124k end july, both possiblehere is my vieuw of Bitcoin for the next next 2-3 months,
i think btc can hit 93k before going to 120k+ but if market remains bullisch structure we might hit first 120-124k before going lower to 93,
its very possible we test 93k first then 120-124k and test 93k again so we print a double bottom there like i show on the chart, double bottom schould bring us slowley to 140k by begin-mid september,
people think bullrun tops in oktober-dec, all social media is expecting that but in crypto always the opposite happens what the massa think, i think cycle tops 2025 september.
we will go to 160k in q1 2026, but thats another story lets see how this play out first,
have a nice day all its just my vieuw of btc at the end is crypto and nobody knows
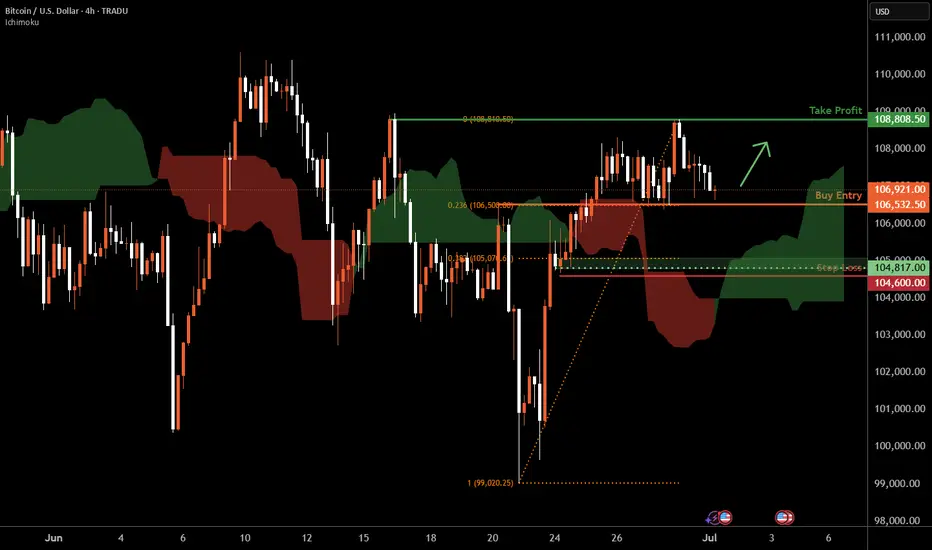
Bitcoin H4 | Potential bullish bounce off an overlap supportBitcoin (BTC/USD) is falling towards an overlap support and could potentially bounce off this level to climb higher.
Buy entry is at 106,535.50 which is an overlap support that aligns with the 23.6% Fibonacci retracement.
Stop loss is at 104,600.00 which is a level that lies underneath a swing-low support and the 38.2% Fibonacci retracement.
Take profit is at 108,808.50 which is a multi-swing-high resistance.
High Risk Investment Warning
Trading Forex/CFDs on margin carries a high level of risk and may not be suitable for all investors. Leverage can work against you.
Stratos Markets Limited (tradu.com ):
CFDs are complex instruments and come with a high risk of losing money rapidly due to leverage. 63% of retail investor accounts lose money when trading CFDs with this provider. You should consider whether you understand how CFDs work and whether you can afford to take the high risk of losing your money.
Stratos Europe Ltd (tradu.com ):
CFDs are complex instruments and come with a high risk of losing money rapidly due to leverage. 63% of retail investor accounts lose money when trading CFDs with this provider. You should consider whether you understand how CFDs work and whether you can afford to take the high risk of losing your money.
Stratos Global LLC (tradu.com ):
Losses can exceed deposits.
Please be advised that the information presented on TradingView is provided to Tradu (‘Company’, ‘we’) by a third-party provider (‘TFA Global Pte Ltd’). Please be reminded that you are solely responsible for the trading decisions on your account. There is a very high degree of risk involved in trading. Any information and/or content is intended entirely for research, educational and informational purposes only and does not constitute investment or consultation advice or investment strategy. The information is not tailored to the investment needs of any specific person and therefore does not involve a consideration of any of the investment objectives, financial situation or needs of any viewer that may receive it. Kindly also note that past performance is not a reliable indicator of future results. Actual results may differ materially from those anticipated in forward-looking or past performance statements. We assume no liability as to the accuracy or completeness of any of the information and/or content provided herein and the Company cannot be held responsible for any omission, mistake nor for any loss or damage including without limitation to any loss of profit which may arise from reliance on any information supplied by TFA Global Pte Ltd.
The speaker(s) is neither an employee, agent nor representative of Tradu and is therefore acting independently. The opinions given are their own, constitute general market commentary, and do not constitute the opinion or advice of Tradu or any form of personal or investment advice. Tradu neither endorses nor guarantees offerings of third-party speakers, nor is Tradu responsible for the content, veracity or opinions of third-party speakers, presenters or participants.
Btc will test 9kDon’t use too much thinking it’s simple FVG down below and will prob test this level again hoping for a massive institutional inflow and rate cuts could be consolidating for months.
BTCUSD parallel channel On the daily chart, BTCUDS is running in the parallel channel. The short-term market fell back after testing the upper resistance. At present, we can pay attention to the short-selling trading opportunities, and the downside target is around 98000. If the price breaks through the resistance near 108800, it will break the channel.
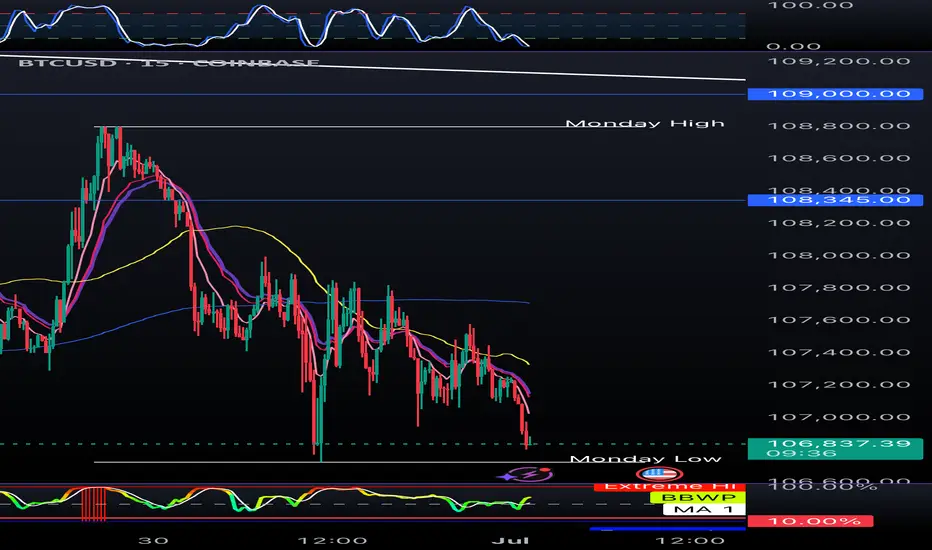
False move week beginning False move week beginning. Looking for strong or steady bounce at Mon range bottom
BTC SHORTThe actual strength index can decline even while the price rises. I anticipate BTC will drop by 10-20% in the coming days. Consider shorting.
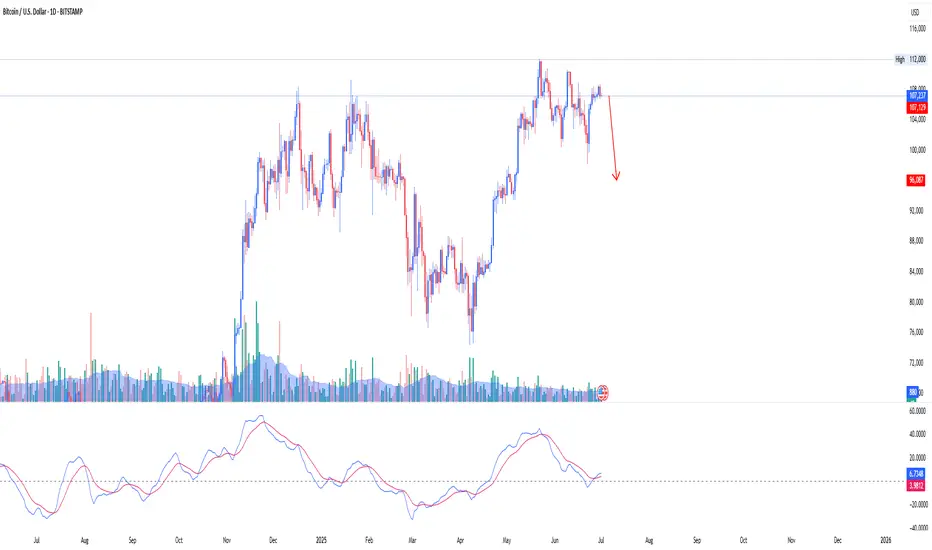
BTCUSD 7/1/2025Come Tap into the mind of SnipeGoat, as he gives you a quick Top-Down Analysis as Price has produced a new Monthly Candle. With a new Monthly Candle print, Price deserves a new Top-Down to keep us in perspective & understanding of what Price is doing.
_SnipeGoat_
_TheeCandleReadingGURU_
#PriceAction #MarketStructure #TechnicalAnalysis #Bearish #Bullish #Bitcoin #Crypto #BTCUSD #Forex #NakedChartReader #ZEROindicators #PreciseLevels #ProperTiming #PerfectDirection #ScalpingTrader #IntradayTrader #DayTrader #SwingTrader #PositionalTrader #HighLevelTrader #MambaMentality #GodMode #UltraInstinct #TheeBibleStrategy

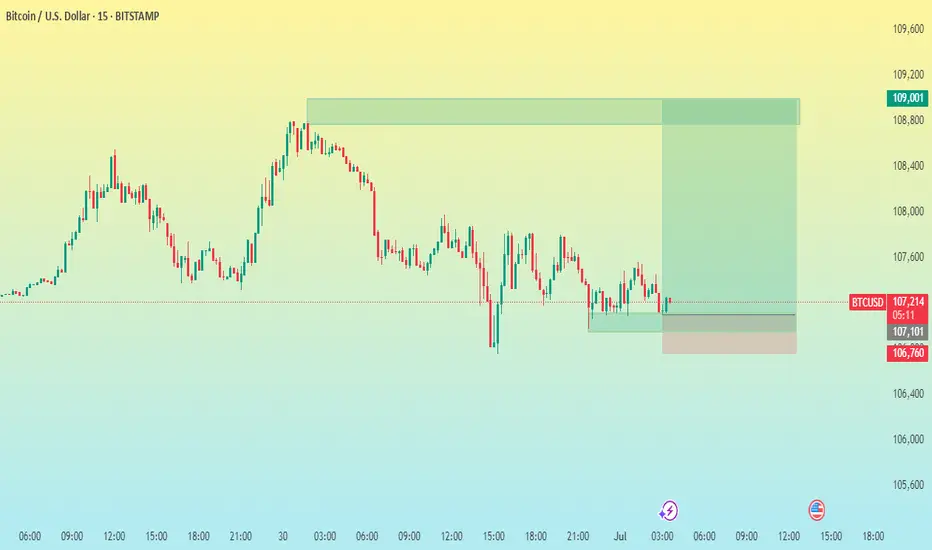
BTC/USD 15M CHART PATTERNHere’s a summary of your BTCUSD trade setup:
---
🟢 Buy Entry: 107,195
🎯 Take Profits:
1. 107,600
2. 108,400
3. 109,000
🔴 Stop Loss: 106,760
---
🔍 Risk-Reward Analysis:
Target Distance from Entry Risk-Reward Ratio (approx)
TP1: 107,600 +405 ~1.1:1
TP2: 108,400 +1,205 ~3.3:1
TP3: 109,000 +1,805 ~5:1
SL: 106,760 -435 —
---
📌 Notes:
Solid R/R: TP2 and TP3 offer favorable risk-reward ratios.
Scalping TP1: TP1 is close; good for quick exit or partial take.
Stop-loss proximity: 435 points below entry; tight but reasonable for short-term trading.
Market condition check: Make sure momentum is in your favor (use indicators like RSI, MACD, or price action confirmation).
Would you like help with setting this up in a trading platform, or converting it into a script for TradingView (Pine Script)?
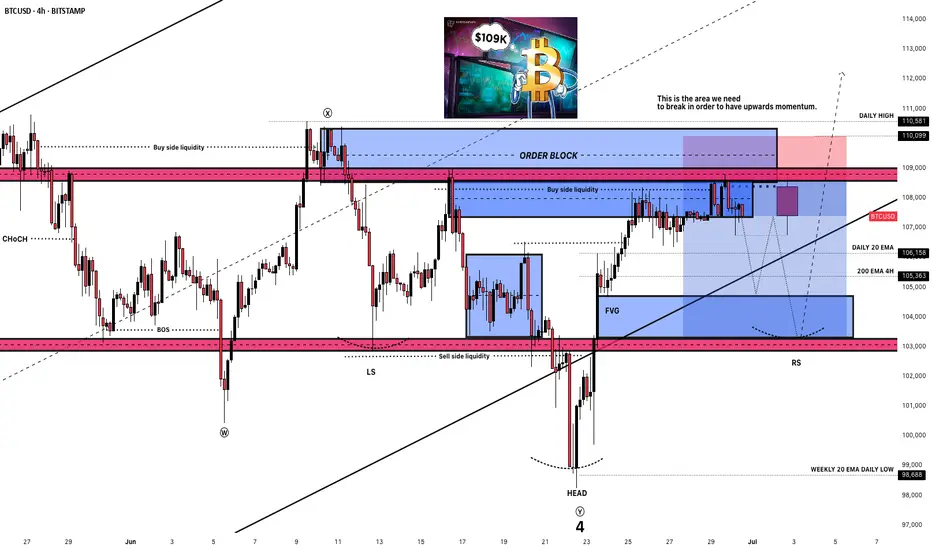
The inevitable breakout to an ATH?MN Capital founder Michael van de Poppe spotted Bitcoin hovering at $107,450, saying that after taking out some liquidity around $109,000, BTC may see a slight pullback before breaking out to all-time highs. We already reach this area.
An accompanying chart shows $109,000 as the key level to watch on BTC’s four-hour time frame. “This is the area we need to break in order to have upward momentum,” Van de Poppe said, adding:“The inevitable breakout to an ATH on Bitcoin might even happen during the upcoming week.”
However, I think we might see a pullback before this happens. We might have an inverse head and shoulder pattern in process.