BTC Dominance and the “Double Top” Pattern🧠 BTC Dominance and the “Double Top” Pattern
1. What is a “Double Top” in BTC Dominance?
A Double Top is a bearish chart pattern formed by two peaks near the same resistance level. If the price (or dominance in this case) breaks below the neckline (middle support), it signals a potential trend reversal from bullish to bearish.
⸻
2. Is BTC Dominance forming a Double Top?
• Analysts suggest BTC dominance may be forming a double top, with two highs near the same level.
• However, it hasn’t confirmed yet. A breakdown below the neckline would confirm the reversal.
• If confirmed, this suggests that capital may start flowing from Bitcoin into altcoins.
⸻
3. What Does It Mean?
• If the Double Top is confirmed (dominance drops) → Bitcoin loses market share → capital flows to altcoins → possible start of a new Altseason.
• If dominance holds or increases → Bitcoin remains the market’s safe haven → altcoins may remain weak.
⸻
4. Current Context & Outlook
• BTC Dominance is now near 64%, a multi-year high, largely driven by institutional interest and Bitcoin ETFs.
• Historically, such highs are followed by rotations into altcoins, especially when traders seek higher returns.
• A confirmed drop in dominance might trigger runs in altcoins like ETH, SOL, or meme coins.
BTCUSD.PM trade ideas
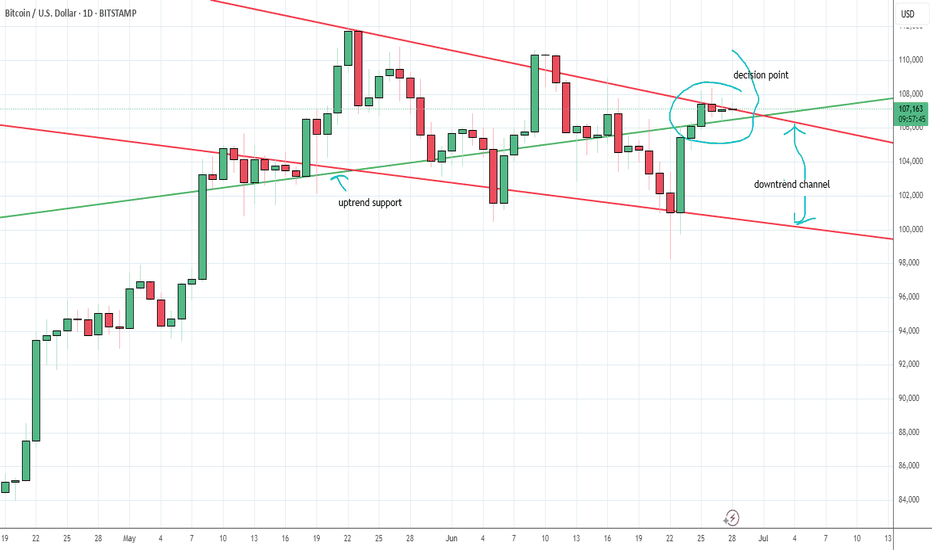
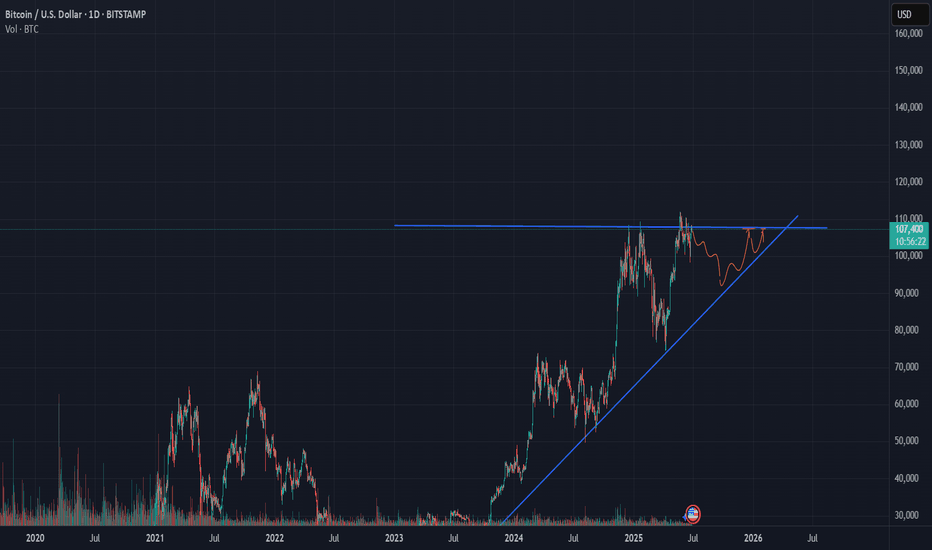
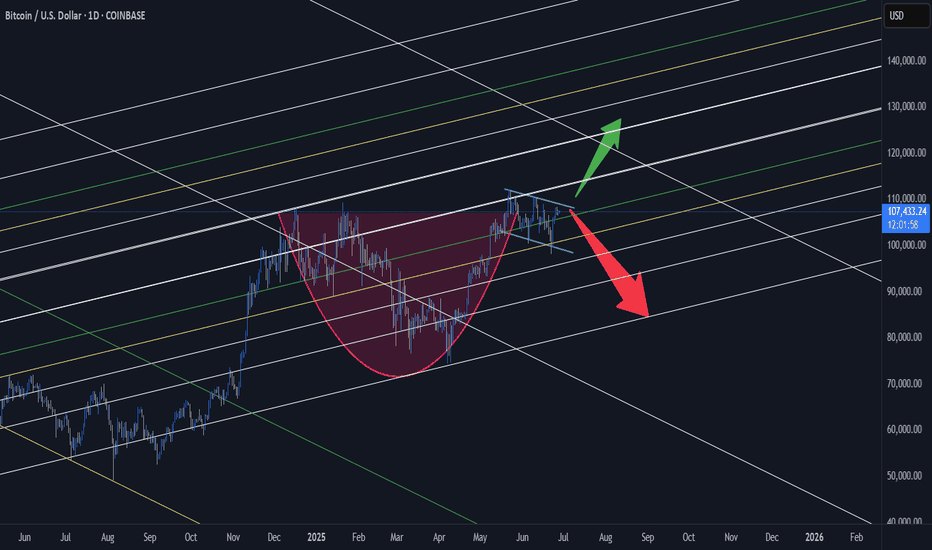
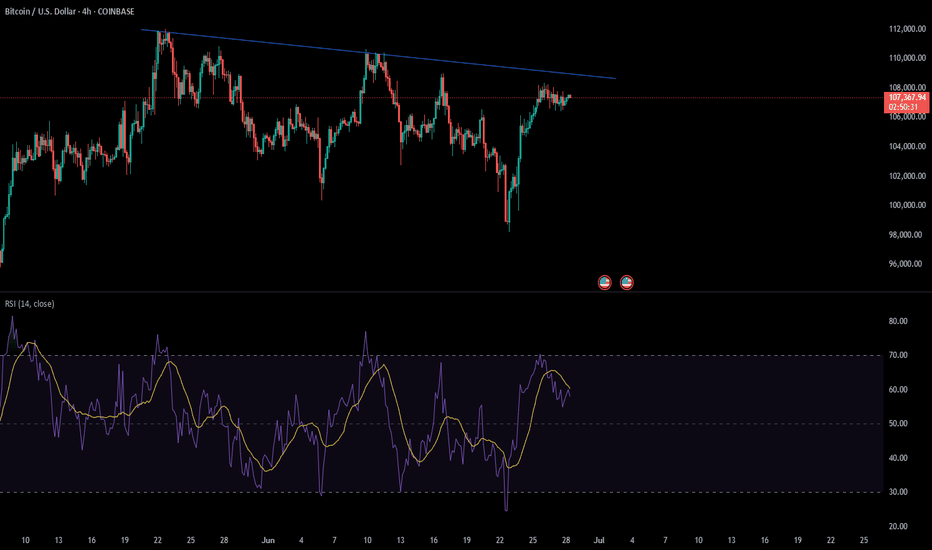
Playoff between down trend channel and up trend support in BTCThis is the situation Bitcoin finds itself in. On the one hand there is a strong downtrend channel which we keep getting thrown into, but on the other hand there is uptrend support that we also keep being bounced back into. We're currently in the confluence of both of these features, so shits about to get real.
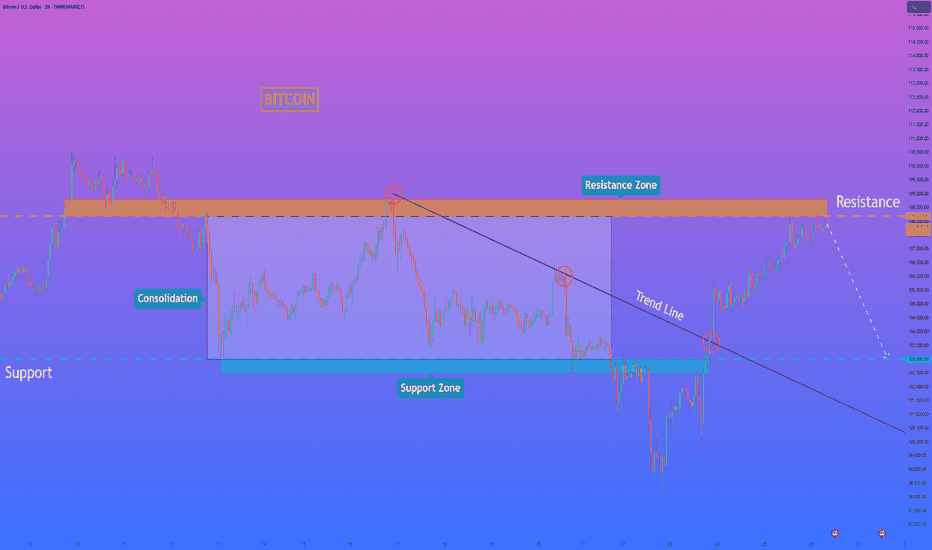
HelenP. I Bitcoin can drop from resistance levelHi folks today I'm prepared for you Bitcoin analytics. If we examine the chart, we can see that the price has approached a significant resistance zone between 108200 and 108800. This area previously acted as a ceiling for the price, and now coincides with the retest of the broken trend line from above. After a strong bullish push from the support zone near 103000, the price is currently consolidating just below resistance, which often signals hesitation and potential reversal pressure. Earlier, we observed a period of consolidation around the support zone, followed by a breakout that broke above the trend line. However, the current structure suggests that the breakout may have been temporary. With multiple signs of slowing momentum and price failing to break convincingly through the resistance, a bearish move from this level becomes increasingly likely. Given the context, I expect BTCUSD to reject this resistance and move downward toward the 103000 support level again. That is my current goal, as I anticipate the price to complete a corrective wave in line with the overall structure. If you like my analytics you may support me with your like/comment ❤️
Disclaimer: As part of ThinkMarkets’ Influencer Program, I am sponsored to share and publish their charts in my analysis.
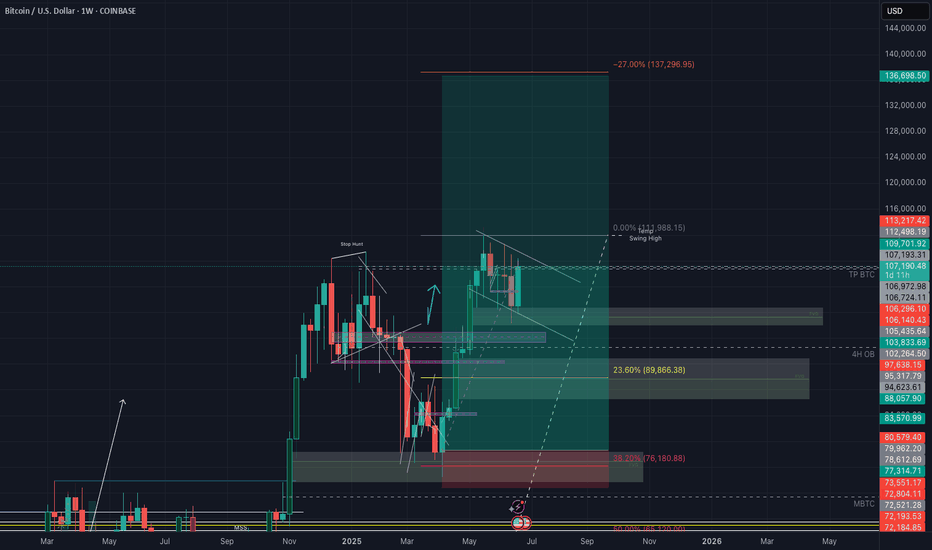
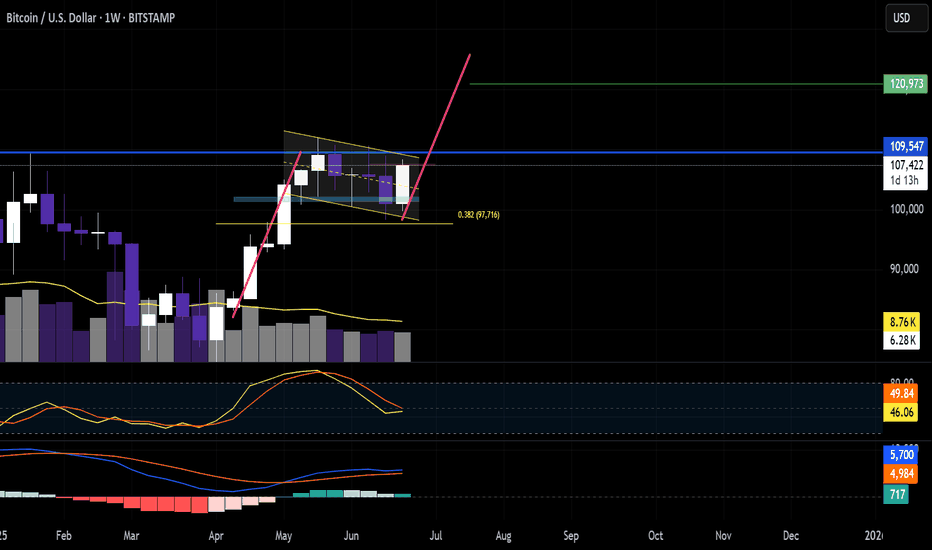
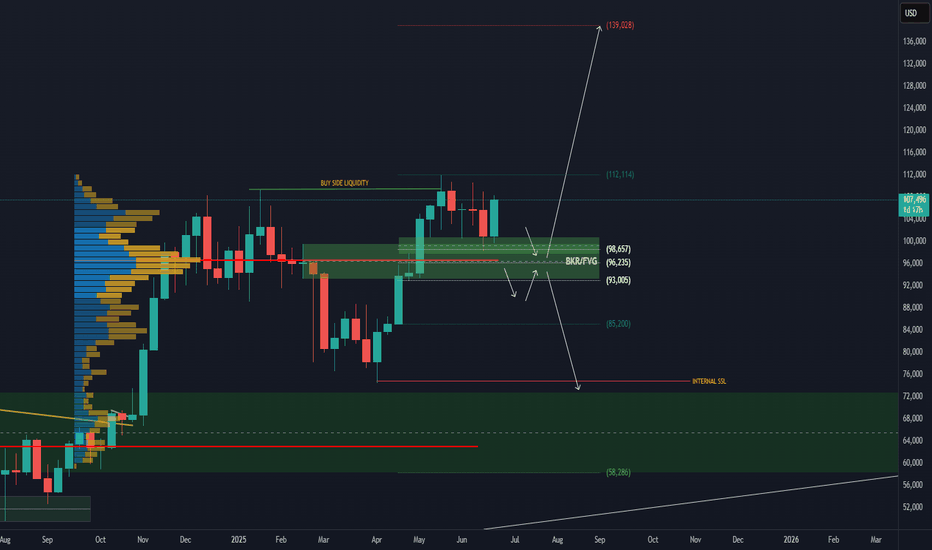
BTCUSD - Weekly Bullish Momentum Targeting $115K, Eyeing $137KI'm currently observing a strong bullish structure on the weekly timeframe for Bitcoin, trading at $107,305 at the time of writing. The current weekly candle shows aggressive buying pressure, and if this momentum sustains through the close, we could see a continuation toward the $115,200 level.
There’s visible liquidity and unfilled price action around $109,500, which I expect to be taken out as price moves upward. Once cleared, Bitcoin could either:
1. Continue straight to \$115K+, or
2. Briefly retrace before resuming the uptrend.
From a Fibonacci retracement perspective, BTC previously pulled back to the 38.2% level ~$76,000 before launching into the current leg up, a classic continuation signal within an uptrend.
Given the current price action and historical behavior, I’m targeting the following levels:
Short-term target: $115,200
Long-term target (multi-month): $137,200-$137,300
Stop loss and entry would depend on the timeframe of execution, but from a weekly structure, invalidation would occur if BTC breaks below the last major higher low around $98,000-$96,000.
Let’s see how this weekly candle closes. If the momentum holds, the next leg could already be unfolding.
BRIEFING Week #26 : Are we going for a Bubble ?Here's your weekly update ! Brought to you each weekend with years of track-record history..
Don't forget to hit the like/follow button if you feel like this post deserves it ;)
That's the best way to support me and help pushing this content to other users.
Kindly,
Phil
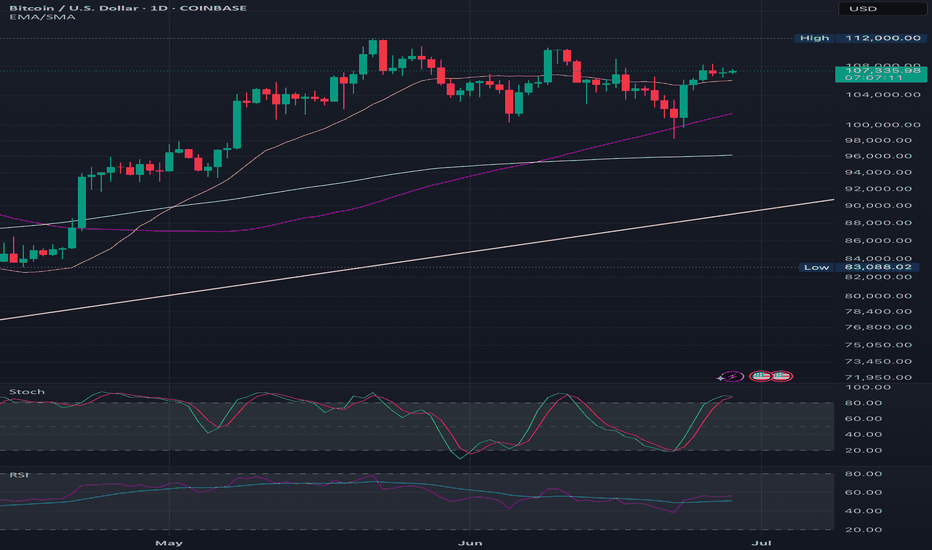
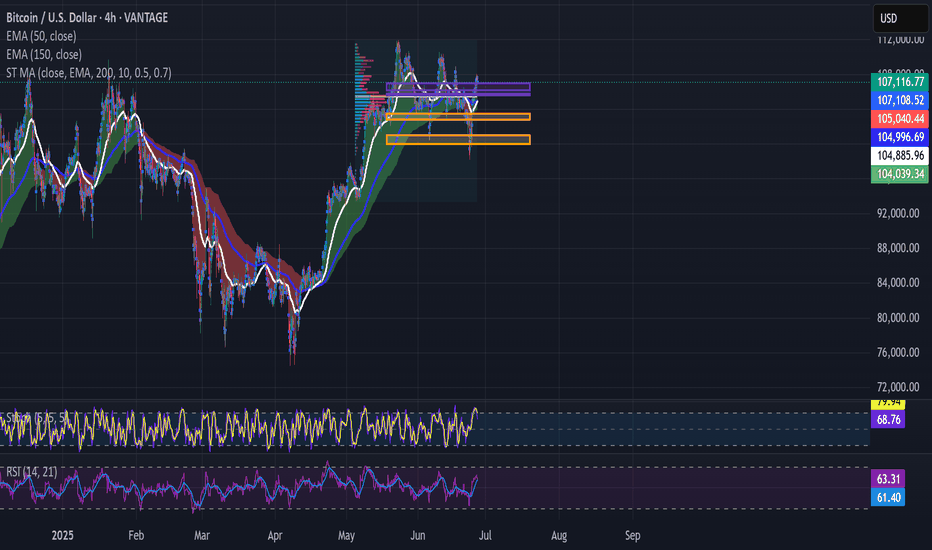
Has Bitcoin Topped? Trump’s SBR Impact | Deep Dive Analysis🚨 Has COINBASE:BTCUSD topped? Even with Trump's Bitcoin Strategic Reserve? 🚨
In this deep dive, we analyze COINBASE:BTCUSD major factors that could point to a major reversal or breakout and to uncover whether a market top is forming.
We’ll cover:
Powerful Indicators
Bitcoin / BTC Trends
Price Action
EMA / SMA Trends
Volume Delta
Trend reversal / breakout
Bullish / Bearish / Confirmation from Indicators
order flow analysis
Timeframes (1W, 1D, 1m, 6M etc.)
Bullish and Bearish Sentiment
Strength Candles
👉 Like, comment below, and follow for more pro-level crypto insights.
MartyBoots here , I have been trading for 17 years and sharing my thoughts on COINBASE:BTCUSD .
Whether you're a short-term trader or long-term investor, this post provides the technical insight and edge to help you make better informed decisions.
📉 Stay ahead of the market. Watch the full breakdown and view charts to decide for yourself: Has Bitcoin really topped?
Watch video for more details and below I will show some powerful charts with descriptions.
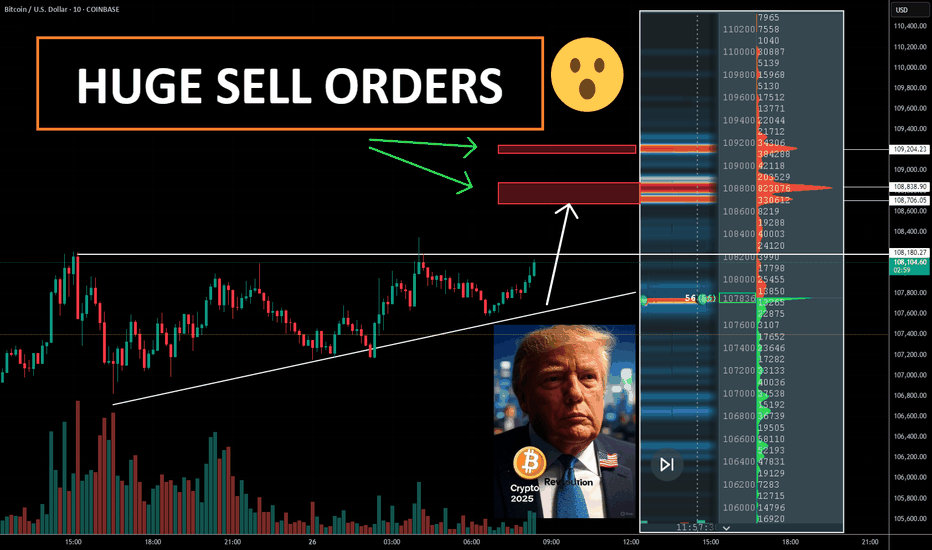
Warning in near term - LARGE ORDERS
Consolidation in price with large orders above
The Red lines = LARGE ORDERS
Large orders can act as an magnet to price
Large orders can also be support and resistance
Price Above the white 100 moving average
Price strong above it
Price weak below it
Strength Candles
Still Bullish
Multiple timeframes still green
Sentiment Tool Still Bullish
Still Bullish
Multiple timeframes and settings still green
3 Drive Structure
Equal Measured moves
Implies Top Is Not In
Target = $126k
Bullish Engulfing Candle
Implies higher prices to come
👉 Like, comment below, and follow for more pro-level crypto insights.
#Bitcoin #Trump #BTC #CryptoTrading #TechnicalAnalysis #CryptoMarket #BitcoinTop #TradingView #StrategicBitcoinReserve
BTCUSD TRADE SETUP 📈 **Bitcoin (BTC/USD) 1H Chart Analysis — June 28, 2025**
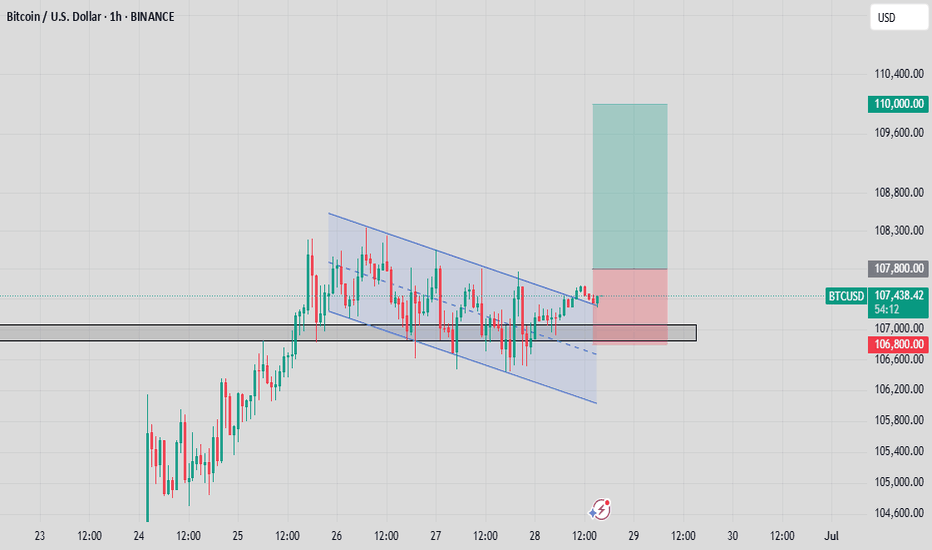
🔍 **Pattern Identified: Bullish Flag Breakout**
🧠 **1. Market Context**
* This is the **1-hour chart** of **BTC/USD** on Binance.
* Price recently formed a **bullish flag pattern**, which is a **continuation pattern** signaling a potential breakout in the **direction of the previous trend (upward)**.
🔧 **2. Technical Breakdown**
🔹 **Trend Before the Flag**
* Price had a strong **impulsive move up** from \~105,000 to \~107,800.
* That was followed by a **consolidation phase** forming a downward sloping **channel** (blue parallel lines), creating the **flag**.
🔹 **Flag Channel**
* Price oscillated inside this flag for nearly 2 days (June 26–28).
* The **channel** is clearly defined, and price **respected both upper and lower bounds** during the consolidation.
🚀 **3. Breakout Confirmation**
* Price has now **broken out of the upper boundary** of the flag.
* A clean **break and candle close** above the trendline suggests **bullish momentum** is returning.
* This breakout is occurring around the **107,400–107,800** zone, which is also a **key structure level** acting as local resistance.
---
🎯 **4. Trade Setup**
✅ **Entry:**
* Around **107,400–107,800**, post-confirmation of the breakout.
❌ **Stop-Loss (SL):**
* Placed just below the **flag support / demand zone**, around **106,800**.
* This protects against a fake breakout or pullback into the flag.
🎯 **Target (TP):**
* Projected at **110,000**, which is aligned with the height of the initial flagpole projected from the breakout point.
* This also represents a psychological round number and a previous resistance level.
---
📊 **Risk-Reward Ratio (RRR)**
* **RRR = \~3:1**
* For every \$1 risked, the potential reward is \$3 — **excellent reward structure**.
---
📌 **Key Insights for the Traders**
* This is a **classic bullish flag breakout** play—very reliable in trending markets.
* **Volume confirmation** (not shown in chart but should be checked live) is important — higher volume during breakout gives stronger conviction.
* Watch for a possible **retest of the breakout level** (around 107,800) before the next move up.
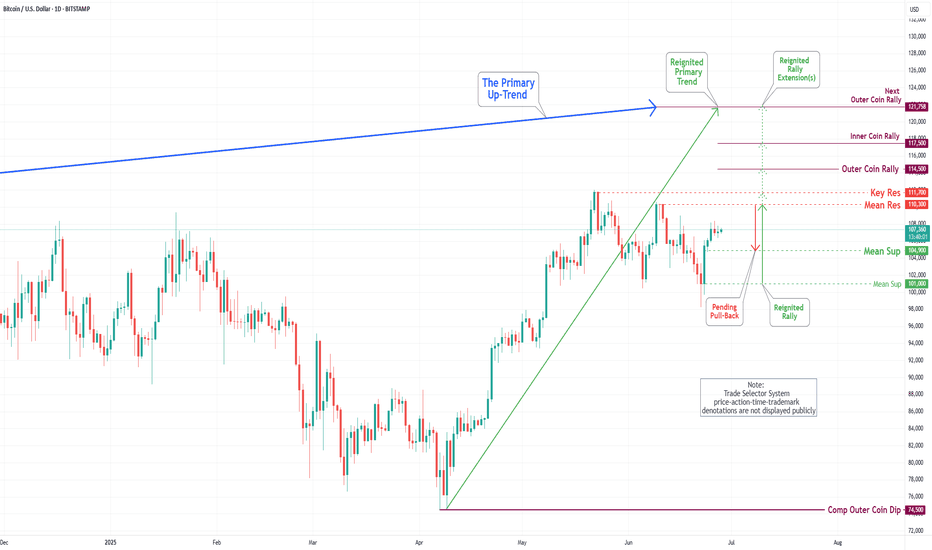
Bitcoin(BTC/USD) Daily Chart Analysis For Week of June 27, 2025Technical Analysis and Outlook:
Throughout this week’s trading session, Bitcoin has demonstrated an upward trajectory and is positioned to achieve the specified targets of Mean Resistance 110300 and Key Resistance 111700. This progression may ultimately culminate in the realization of the Outer Coin Rally 114500 and beyond. Nevertheless, it is crucial to recognize the possibility of a subsequent decline from the current price to the Mean Support level of 104900 before a definitive upward rebound.
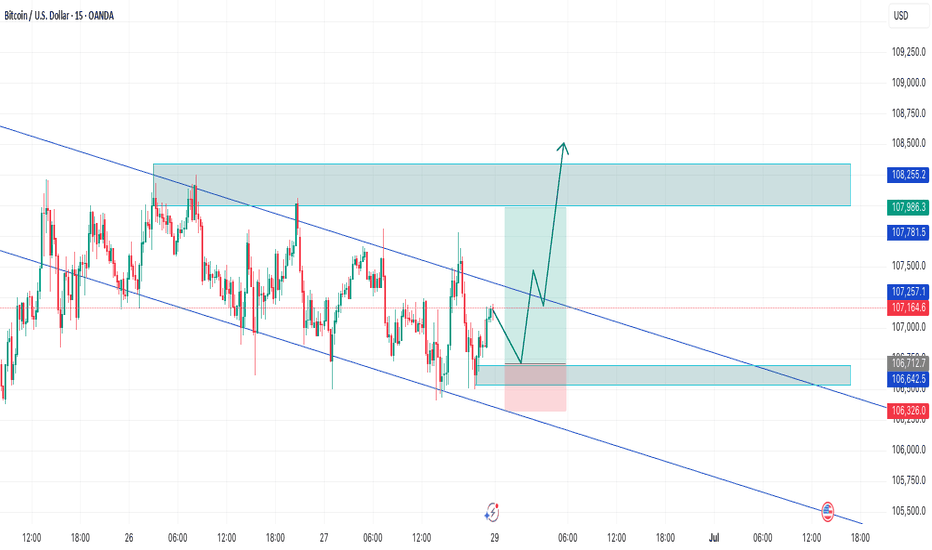
BTCUSD LONG BULLISH FLAG📊 BTCUSD Trade Setup – 15m Chart
🔔 Shared by RKZ FX SIGNAL
We're currently monitoring a bullish setup forming inside a descending channel. Price is showing signs of accumulation near the demand zone around 106,640 – 106,700, with a potential bullish break from the falling wedge structure.
🟢 Trade Idea (Potential Buy Setup):
Entry Zone: Around 106,650 – 106,700
Stop Loss: Below 106,326 (below liquidity & demand zone)
Take Profit: Targeting supply zone between 107,980 – 108,250
Risk to Reward Ratio: ~1:3
🧠 Analysis Notes:
Price has tapped into a fresh demand zone and shown a short-term bullish reaction.
Still inside the descending channel, but momentum is building for a breakout.
Confirmation will be stronger once price breaks the midline and retests the top boundary as support.
🔔 Wait for price action confirmation at entry zone before entering. Avoid early entries.
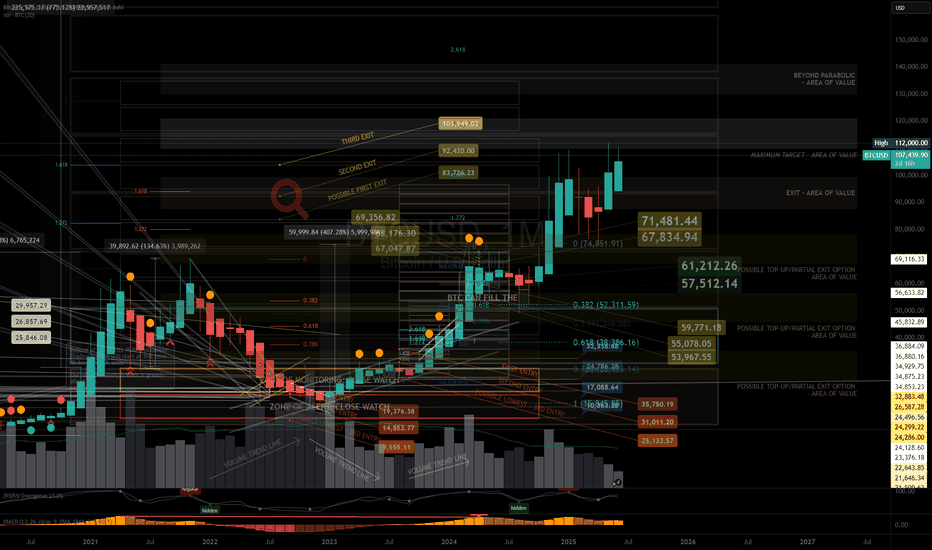
BTC Bento Box Analysis 6.28.25So far so good, I am back after 2 years of hibernation (been studying forex charts.) My analysis remains true to what BTC has done for the past 2 years. So much to learn in analyzing charts from crypto to forex to blue chips.
Again, we follow the tops and bottoms of the boxes. Minor and major boxes will suggest major and minor high and low reversals.
In a couple of weeks, i will study the charts and draw new Bento boxes for a year or two predictions as to where the most probable BTC ATH and ATL will take us to a new level.
Get ready to open buy/sell positions in the months to come.
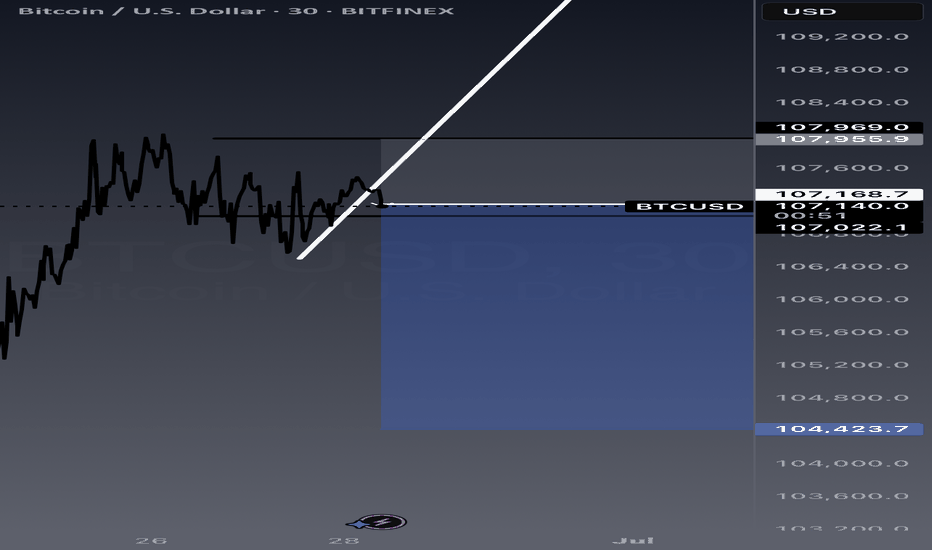
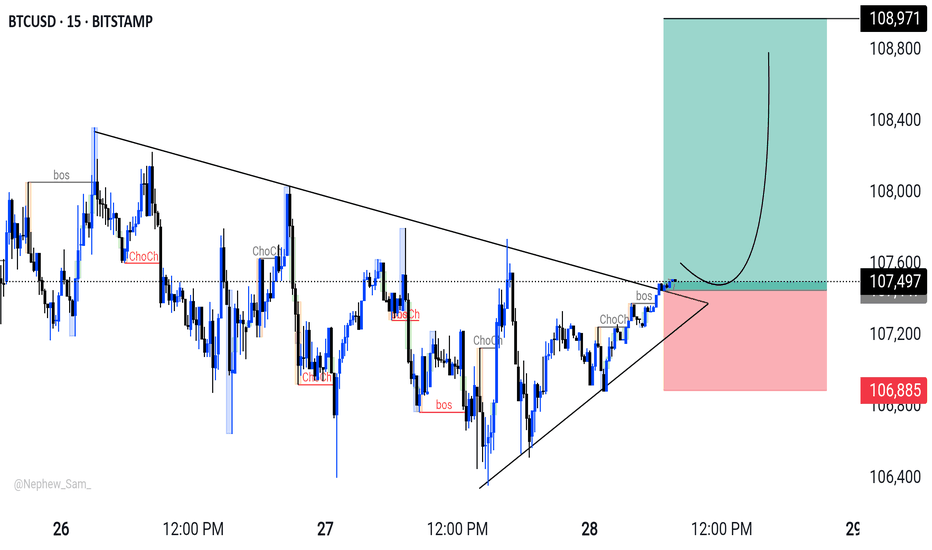
BTC/USD: Breakout Watch - short setup BTC/USD 15-min: Watching for a potential long opportunity. Price is pressing against a key descending trendline, with recent internal 'bos' and 'ChoCh' indicating a shift in momentum.
Plan:
* Entry: Targeting a retest around 107,509 after a confirmed trendline breakout.
* Target: 108,971
* Stop Loss: 106,885
Risk management is key! What are your thoughts?
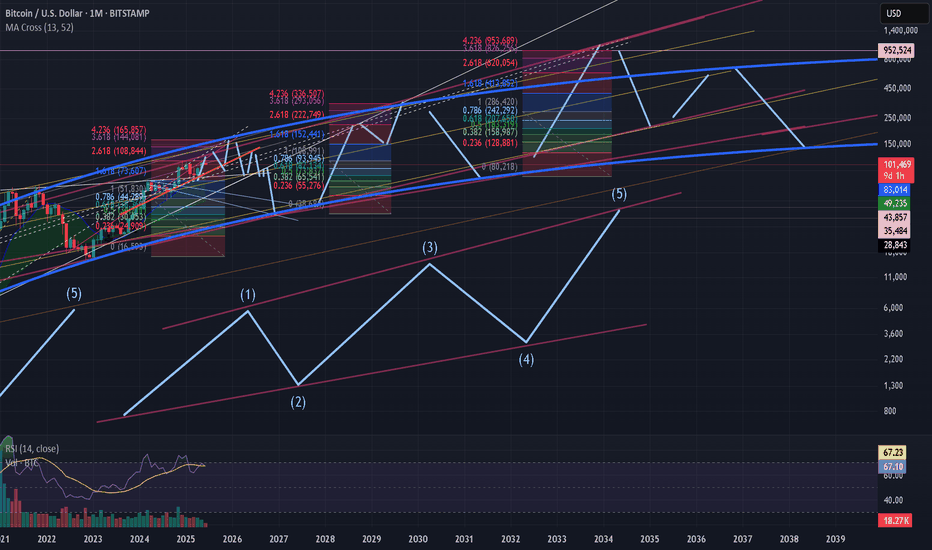
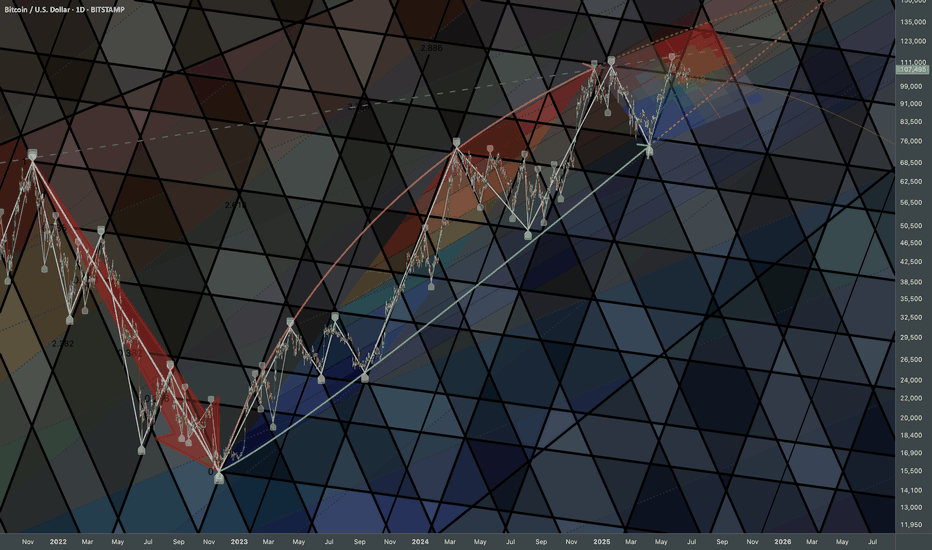
Bitcoin: Curve AdjustmentsBottoms can be expressed as a curve which matches logarithmic growth patterns. In the long-term perspective it serves as signal of trend's transition phase in broader scale. Coordinate of top adjusted accordingly.
Extending them is crucial because together they gives boundaries of range compression. Some sort of wave limits which help to clarify price-based levels.
Decoding the Dollar's Next MoveThe Dollar Index (DXY) currently stands at a critical crossroads, with its weekly close below 98.00 poised to dictate the trajectory of major asset classes for the coming weeks. The DXY closed as a bearish weekly candle at 97.2, confirming the "Bearish Dollar Scenario" as it closed below the 98.00 level. The market sentiment is currently cautious, awaiting clear directional cues from the DXY2. Our analysis will explore the Bearish Dollar Scenario, outlining potential price movements and actionable recommendations across a range of correlated assets
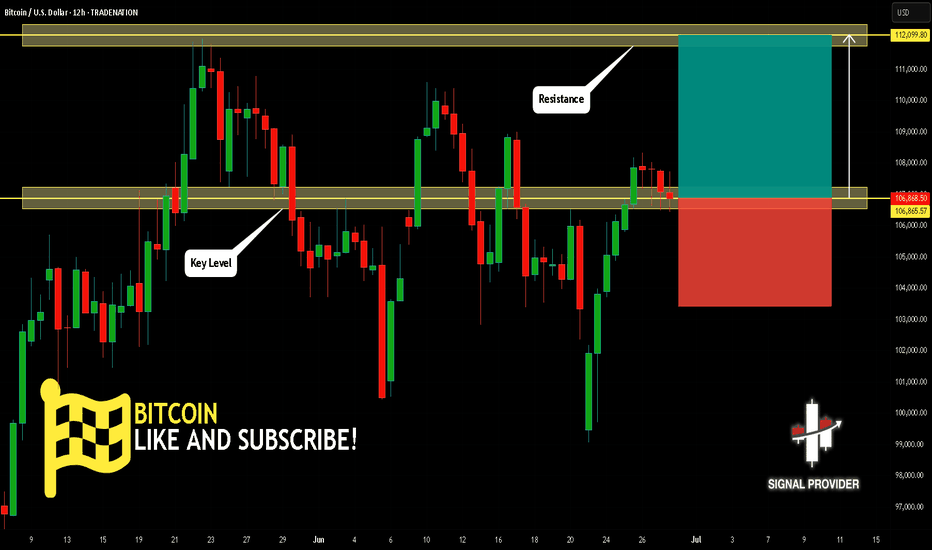
BITCOIN Is Bullish! Buy!
Here is our detailed technical review for BITCOIN.
Time Frame: 12h
Current Trend: Bullish
Sentiment: Oversold (based on 7-period RSI)
Forecast: Bullish
The market is approaching a significant support area 106,865.57.
The underlined horizontal cluster clearly indicates a highly probable bullish movement with target 112,099.80 level.
P.S
Overbought describes a period of time where there has been a significant and consistent upward move in price over a period of time without much pullback.
Disclosure: I am part of Trade Nation's Influencer program and receive a monthly fee for using their TradingView charts in my analysis.
Like and subscribe and comment my ideas if you enjoy them!
