Bull-Flag within a Bull Flag means Exponential gains coming ???As of Friday, June 27, 2025, at 9:41:55 PM PDT, here's an analysis of Bitcoin:
Current Price & Performance:
Last Price: Approximately $107,280.10 (as of June 27, 2025)
Recent Performance: Bitcoin has been showing resilience above the $105,000 mark and has consolidated in a range between $100,000 and $110,000 recently, after hitting an unprecedented price of around $111,814 last month.
Bull Flag in a Bull Flag Pattern (Nested Bull Flags)
A "bull flag" is a bullish continuation pattern characterized by:
Flagpole: A sharp, strong upward price move.
Flag: A period of consolidation or slight retracement that forms a rectangular or parallelogram shape, typically with lower trading volume.
Breakout: A resumption of the uptrend with a strong move out of the flag, ideally on increased volume.
A "bull flag in a bull flag" (or nested bull flag) implies that a smaller bull flag is forming within a larger, ongoing bull flag pattern. This suggests a powerful, sustained uptrend where even the pauses for consolidation are themselves exhibiting bullish continuation characteristics.
Identifying this for Bitcoin:
To identify this pattern in Bitcoin, we would look for the following on a daily or higher timeframe chart:
1. The "Larger" Bull Flag:
Flagpole (Large): Bitcoin's overall parabolic run from its post-bear market lows to its recent all-time highs (e.g., $111,814). This multi-month or multi-year rally constitutes the significant "flagpole."
Flag (Large): The current consolidation phase Bitcoin is undergoing after reaching those all-time highs. This "flag" would be characterized by a broad trading range (e.g., between $100,000 and $110,000, or a wider range after its initial peak). This large flag would be a period of consolidation following the massive flagpole.
2. The "Smaller" Bull Flag (Nested within the larger one):
Flagpole (Small): Within this larger consolidation "flag," Bitcoin might experience shorter, sharper upward impulses. For example, if Bitcoin has a sudden 10% surge from $100,000 to $110,000 within the larger flag. This specific surge acts as the "flagpole" for the smaller flag.
Flag (Small): Following this smaller surge, Bitcoin then enters a mini-consolidation phase (a few days to a week or two), forming a tighter "flag" pattern within the broader trading range. This would be a slight downward or sideways channel on lower volume.
Breakout (Small): A breakout from this smaller flag would see Bitcoin push higher within the larger consolidation range, perhaps targeting the upper boundary of the larger flag (e.g., aiming for $110,000 or new highs).
Current Bitcoin State and the Pattern:
Based on recent market commentary and price action:
Overall Context: Bitcoin is in a long-term bull market, having recovered significantly from previous lows and testing all-time highs. This broad trend provides the context for large "flagpoles."
Larger Flag: Bitcoin's current consolidation around the $100,000-$110,000 zone, after its surge to $111,814, clearly fits the description of a large "flag" forming after a substantial "flagpole." This is a critical consolidation phase for the overall bull run.
Smaller Flag (Potentially Forming): Recent news mentions that Bitcoin surged over 10% since last Sunday (early June 2025) and has been consolidating between $100,000 and $110,000 for over three days. This description fits the start of a nested bull flag:
The 10% surge could be the smaller flagpole.
The consolidation for over three days within the $106,390 - $108,384 range after that surge could be the smaller flag formation.
If this smaller flag resolves to the upside, it would push Bitcoin towards the upper boundary of the larger flag ($110,000 to $112,000) or beyond.
Significance of a Nested Bull Flag:
Strong Underlying Momentum: The presence of a smaller bull flag within a larger one suggests exceptionally strong buying pressure and conviction among bulls. Even during periods of overall consolidation, traders are quick to accumulate on dips, leading to these smaller continuation patterns.
Layered Confirmation: It provides multiple layers of bullish signals. A breakout from the smaller flag reinforces the bullish bias within the larger flag, increasing the probability of an eventual breakout from the larger pattern.
Entry Opportunities: For traders, the smaller flags offer shorter-term entry opportunities within a larger trend, allowing them to capitalize on mini-surges as the broader consolidation unfolds.
Caution:
Confirmation is Key: Like all chart patterns, bull flags require confirmation. For the smaller flag, watch for a decisive breakout above its upper trendline on increasing volume. For the larger flag, the ultimate confirmation would be a sustained break above its all-time high resistance (around $112,000) on significant volume.
Volatility: Bitcoin is known for its volatility, and even continuation patterns can have false breakouts or deeper retracements than anticipated.
Volume: Volume confirmation is crucial. The "flag" portion should ideally show decreasing volume, while the "breakout" should be accompanied by a surge in volume.
In summary, Bitcoin appears to be currently in a large consolidation phase which could be interpreted as a significant "bull flag." Within this larger "flag," recent price action suggests the potential formation of a smaller, nested bull flag, where a recent mini-surge (small flagpole) is followed by a short consolidation (small flag). This indicates strong underlying bullish sentiment, with market participants potentially looking for a push towards the upper boundaries of the broader consolidation range.
This analysis is based on technical patterns and current market information. It is not financial advice. Always perform your own due diligence and consult with a financial professional before making investment decisions, especially in highly volatile assets like cryptocurrencies.
BTCUSD.PM trade ideas
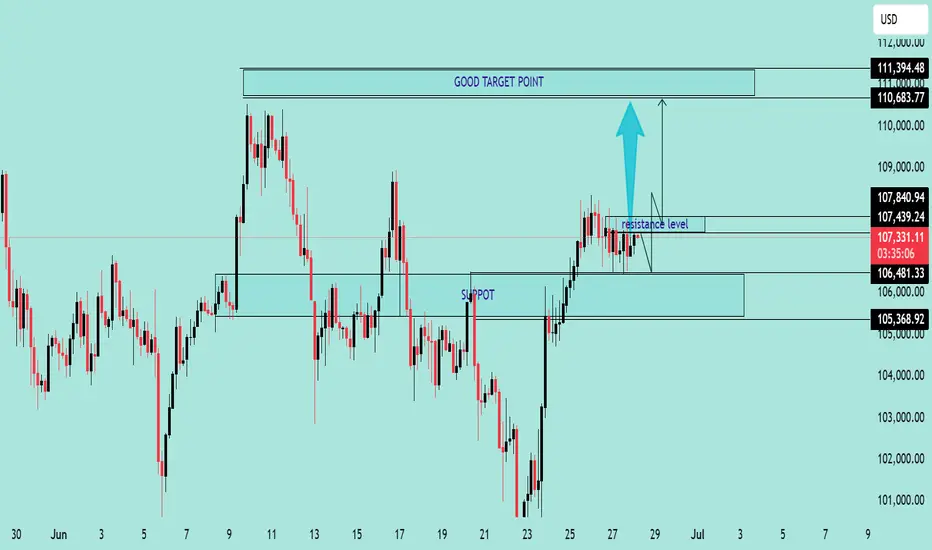
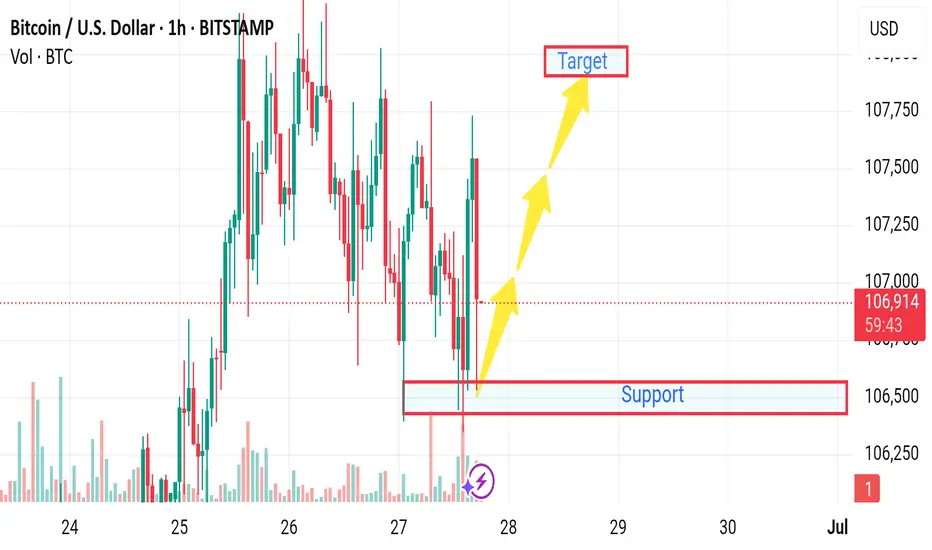
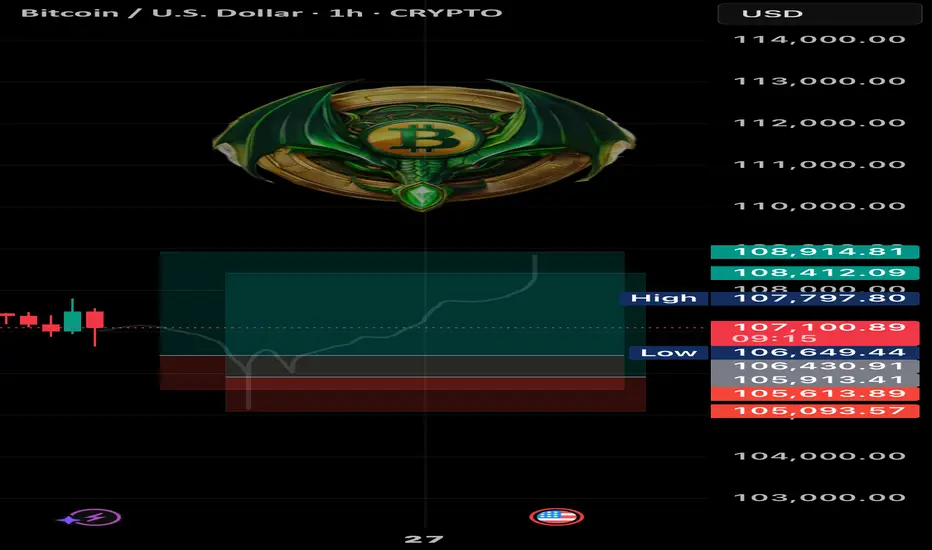
BTC/USD Consolidation Breakout Setup Chart Overview:
The BTC/USD chart shows a strong bullish impulse followed by a consolidation phase just below a key resistance level, suggesting a potential bullish continuation.
🔹 Key Technical Zones:
📍 Support Zone:
105,368 – 106,481 USD
This area acted as a strong demand zone where price reversed aggressively.
📍 Resistance Level:
107,439 – 107,840 USD
Price is currently consolidating just below this resistance, indicating a buildup for a breakout.
🎯 Target Zone:
110,683 – 111,394 USD
A clean breakout above resistance could push price into this target area.
🔹 Technical Signals:
✅ Bullish Flag Formation:
After a strong impulse move, BTC is forming a sideways range, indicating bullish accumulation.
⬆️ Breakout Potential:
A confirmed breakout and retest above 107,840 could validate a move toward the 111K region.
⚠️ Invalidation Point:
A drop below 106,481 would invalidate the bullish bias and may trigger a deeper pullback.
📌 Conclusion:
As long as BTC holds above the 106,481 support and breaks above the 107,840 resistance, bullish momentum is expected to continue toward the 111K zone. Traders should watch for a breakout confirmation and manage risk accordingly. 💹
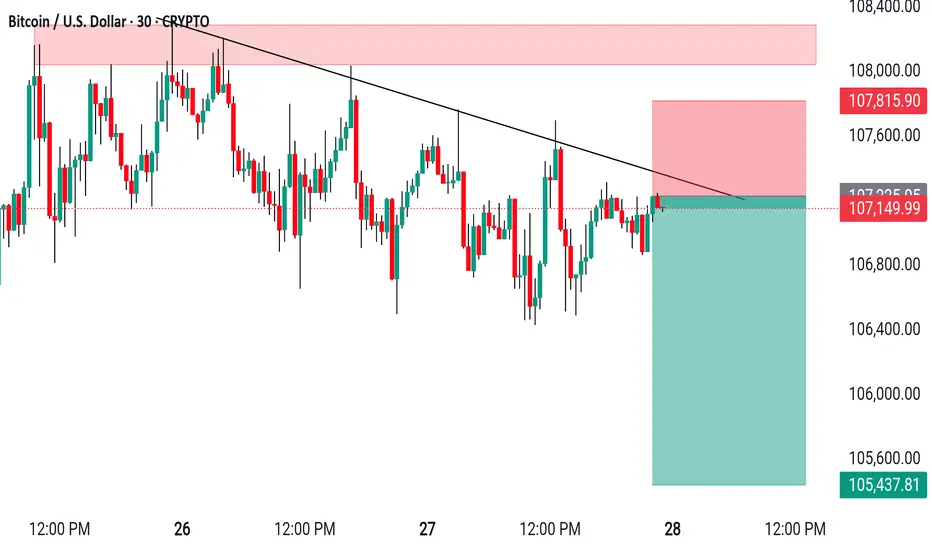
BTCUSD Short setup on the 30-min chart#BTCUSD Short setup on the 30-min chart.
Resistance holding strong.
> Entry: ~$107,140
> SL: $107,815
> TP: $105,437
> What are your thoughts? #Bitcoin #Crypto #TradingView
btcusd bitcoin entering bear market that will last 1 year to 20kBearish divergence on rsi and mcad indication of bear market that usually last year.
Bottom is approximately 20k were also unfilled CME gap still exists.

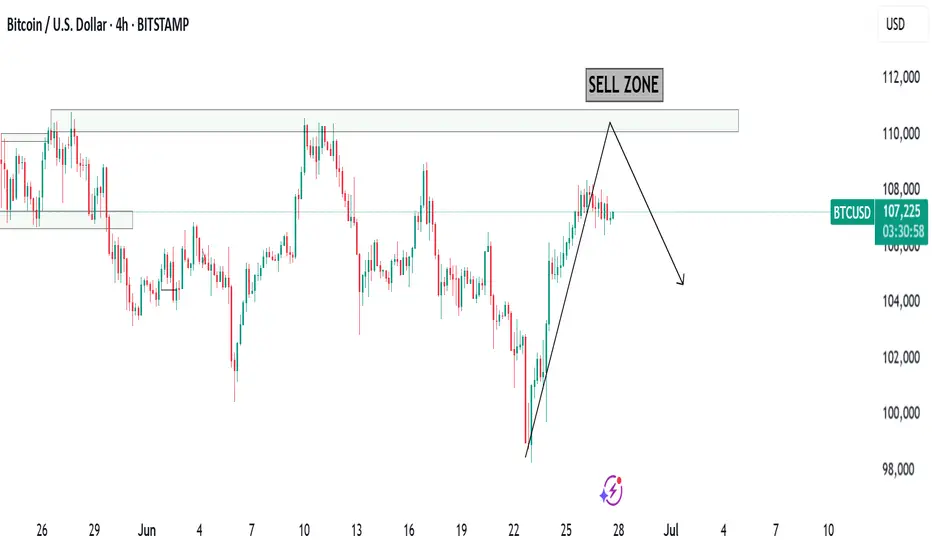
Unusual situation - Will you short BTCUSD?Going short is not the first thought when talking about BTCUSD, yet the 3 recent lower highs together with an "evening star" pattern are saying exactly that.
Will you take this offer?
What do you think?
Comment below, share your thoughts and analysis!!
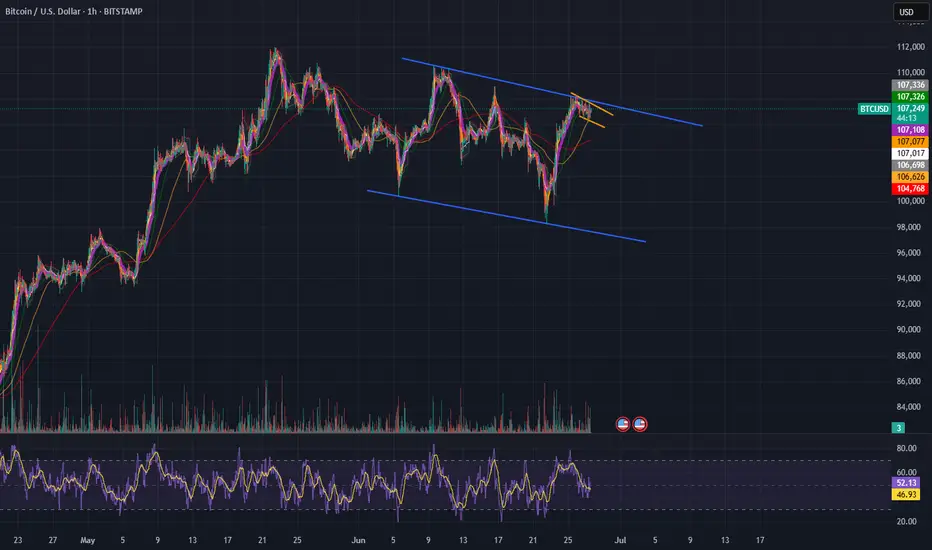
$BTC - $120K IS COMINGBTC is currently forming one giant bull flag since the May high. It is teasing the top of the channel while holding the 1H 100MA firmly consecutive times. Within this bull flag, the last few days have formed an additional bull flag at the top of the channel as well.
This weekend will see us breakout of both and to the upside. I am targeting $120K here with $135K if we overextend. Let's see
Bitcoin Structurally Momentum Bullish – On-Chain Confirmed.⊢
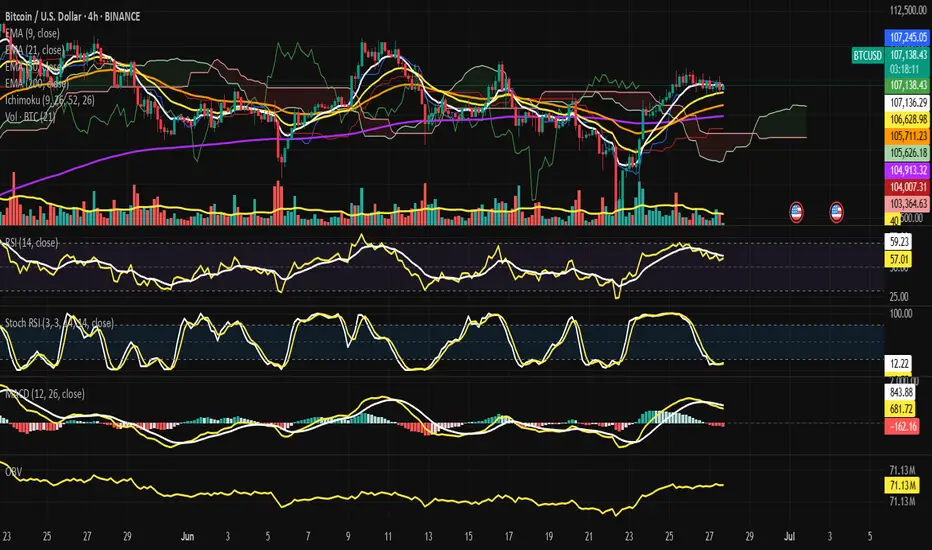
⟁ BTC/USD – BINANCE – (CHART: 4H) – (June 27, 2025).
⟐ Analysis Price: $106,840.15.
⊢
⨀ I. Temporal Axis – Strategic Interval – (4H):
▦ EMA(9) – ($107,126.95):
∴ Current price is slightly below the EMA(9), indicating the beginning of intraday buyer fatigue;
∴ EMA(9) still curves upward, sustaining the recent bullish momentum, but showing signs of deceleration.
✴️ Conclusion: Short-term strength is weakening; potential micro-shift in sentiment underway.
⊢
▦ EMA(21) – ($106,574.03):
∴ EMA(21) acts as immediate dynamic support, now closely tested;
∴ Still sloping upward, suggesting buyers are attempting to defend the structure.
✴️ Conclusion: Tactical support remains intact - this is the battlefield line.
⊢
▦ EMA(50) – ($105,651.25):
∴ Mid-range structure confirms trend stability as price remains well above the EMA(50);
∴ EMA(50) direction remains mildly bullish, reinforcing medium-term control by buyers.
✴️ Conclusion: Medium trend unshaken; pullbacks remain controlled within bullish context.
⊢
▦ EMA(200) – ($104,890.51):
∴ Long-term baseline remains untouched, with price notably above;
∴ The slope of EMA(200) is stable and slightly positive.
✴️ Conclusion: Structural bullish foundation remains intact. No long-term threat detected.
⊢
▦ Ichimoku Cloud (9/26/52/26):
∴ Price remains above the Kumo cloud; Tenkan and Kijun are aligned in bullish formation, though beginning to flatten;
∴ Chikou Span remains free and clear above historical price — no conflict.
✴️ Conclusion: Structure is still bullish, but compression in the cloud signals potential pause in directional conviction.
⊢
▦ Volume (BTC) + MA(21):
∴ Volume sits below its 21-period moving average, indicating waning buyer participation;
∴ No breakout or capitulation candle - sentiment is reserved.
✴️ Conclusion: Lack of conviction - volume confirms indecision and pause in impulse.
⊢
▦ RSI + EMA9 – (RSI: 54.78 / EMA9: 59.70):
∴ RSI curves downward from the upper-neutral zone - momentum is retreating;
∴ RSI has crossed below its EMA(9), which typically signals fading bullish strength.
✴️ Conclusion: Momentum has weakened - buyers are hesitating.
⊢
▦ Stoch RSI – (K: 9.72 / D: 10.22):
∴ Oscillator is deep in the oversold region, preparing a bullish cross;
∴ No confirmation of reversal yet - early signal.
✴️ Conclusion: Setup for potential rebound exists, but signal remains unconfirmed.
⊢
▦ MACD – (MACD: 725.17 / Signal: 883.72 / Histogram: –158.55):
∴ MACD histogram turns increasingly negative, suggesting decay in momentum;
∴ Though MACD line remains above signal, curvature favors a bearish crossover soon.
✴️ Conclusion: Momentum fading; risk of technical crossover if weakness persists.
⊢
▦ OBV – (71.13M):
∴ OBV is flat and shows no divergence, suggesting balanced pressure;
∴ Movement remains parallel to EMA21, confirming neutrality.
✴️ Conclusion: Volume flow is not supporting a continuation; neutral.
⊢
🜎 Strategic Insight – Technical Oracle:
∴The structure remains bullish at the macro and medium levels;
∴ As evidenced by EMA alignment and Ichimoku posture. However, momentum signals are fading, and the current 4H candle lacks conviction;
∴ A breakout requires stronger volume and RSI reacceleration - until then, the tactical stance is suspended.
⊢
∫ II. On-Chain Intelligence – (CryptoQuant):
▦ 1. Exchange Netflow Total – (All Exchanges):
∴ Current readings show net outflows dominating, indicating coins moving out of exchanges - typically interpreted as holding behavior and bullish bias;
∴ No recent spike in inflows that would suggest imminent selling pressure or dump risk.
✴️ Conclusion: Exchange behavior is structurally bullish - environment favors accumulation.
⊢
▦ 2. Exchange Stablecoins Ratio – (All Exchanges):
∴ The ratio remains low and stable, meaning high stablecoin reserves vs. Bitcoin on exchanges - suggesting potential buying power in standby;
∴ No spike in the ratio - no immediate conversion from stablecoins into Bitcoin.
✴️ Conclusion: Stablecoins on standby confirm latent demand - supportive for bullish continuity if triggered.
⊢
▦ 3. Funding Rates – (All Exchanges):
∴ Funding is positive but mild, indicating long interest, yet not overheated;
∴ No excessive leverage detected - absence of speculative imbalance.
✴️ Conclusion: Derivatives market supports a healthy uptrend with no signs of crowd euphoria.
⊢
▦ 4. Estimated Leverage Ratio – (All Exchanges):
∴ Leverage ratio remains within neutral bounds, not expanding aggressively;
∴ Suggests market is currently not dominated by overleveraged positions.
✴️ Conclusion: The structure is stable - no systemic risk from forced liquidations.
⊢
▦ 5. Taker Buy/Sell Ratio – (All Exchanges):
∴ The ratio is slightly above 1.0 - meaning more aggressive buying than selling, but without dominance;
∴ Reinforces sentiment of cautious buying, not yet euphoric.
✴️ Conclusion: Taker flow confirms moderate bullish sentiment, no reversal pressure.
⊢
🜎 Strategic Insight – On-Chain Oracle:
∴ On-chain metrics align with structural bullishness;
∴ Netflows, leverage, and taker activity all support continuation;
∴ Importantly, stablecoin ratios signal dry powder remains available, meaning the market holds the potential energy for further upside - if volume and technical confirmation align.
⊢
⧈ Codicillus Silentii Strategic Note:
∴ In the discipline of silence, one waits as price tests its dynamic zone. The wise act after structure, not inside uncertainty;
∴ The chain speaks in whispers. Smart liquidity waits. The structure is armed - but momentum requires ignition. Not fear, not hope - signal.
⊢
𓂀 Stoic-Structural Interpretation:
∴ Structurally Bullish - (Tactically Suspended);
∴ The core architecture remains intact, but the absence of volume and declining oscillators justify a suspended stance for entry;
∴ On-chain and chart-based structures are aligned in bullish posture, but technical indicators remain in a suspended tactical phase. Awaiting breakout or deeper pullback for positioning.
⊢
▦ Tactical Range Caution:
∴ Watch $106,574 (EMA21) and $105,651 (EMA50) for reactive buying;
∴ Below $104,890 (EMA200) - structure weakens;
∴ Upside breakout requires volume reclaim above $107,330;
∴ Resistance: $107,330 / $108,200.
⊢
⧉
⚜️ Magister Arcanvm (𝟙⟠) – Vox Primordialis!
𓂀 Wisdom begins in silence. Precision unfolds in strategy.
⧉
⊢
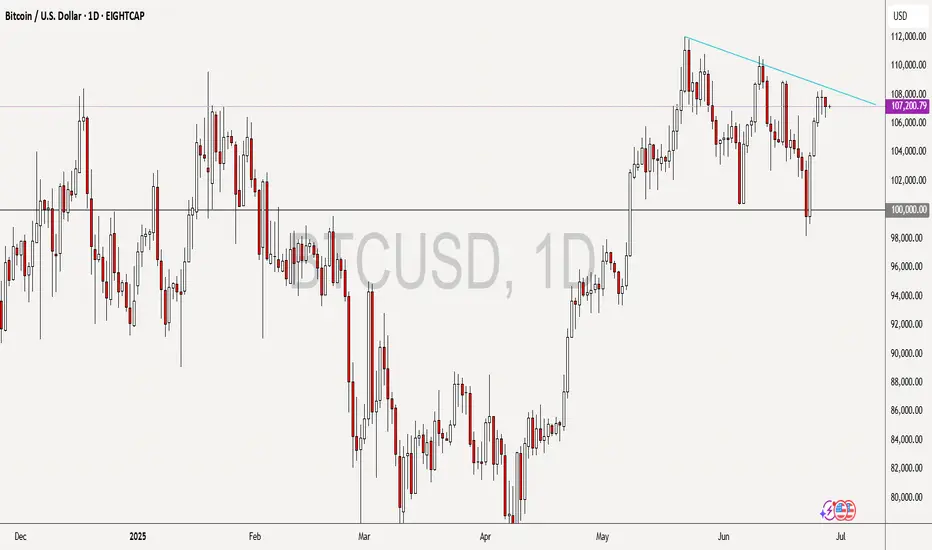
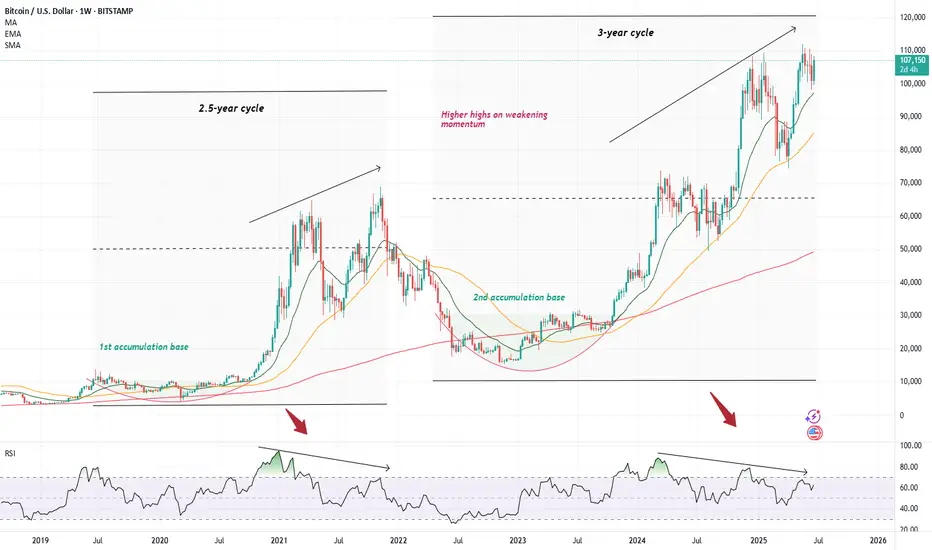
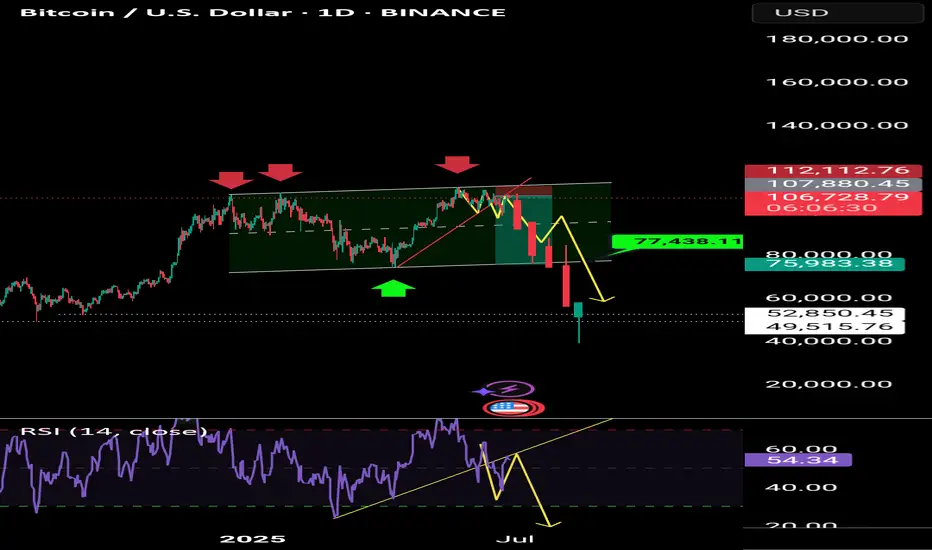
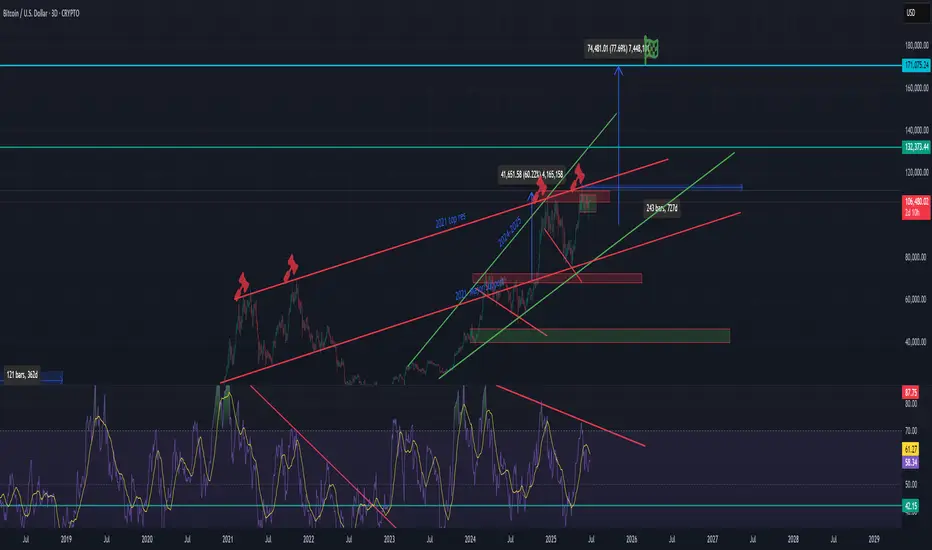
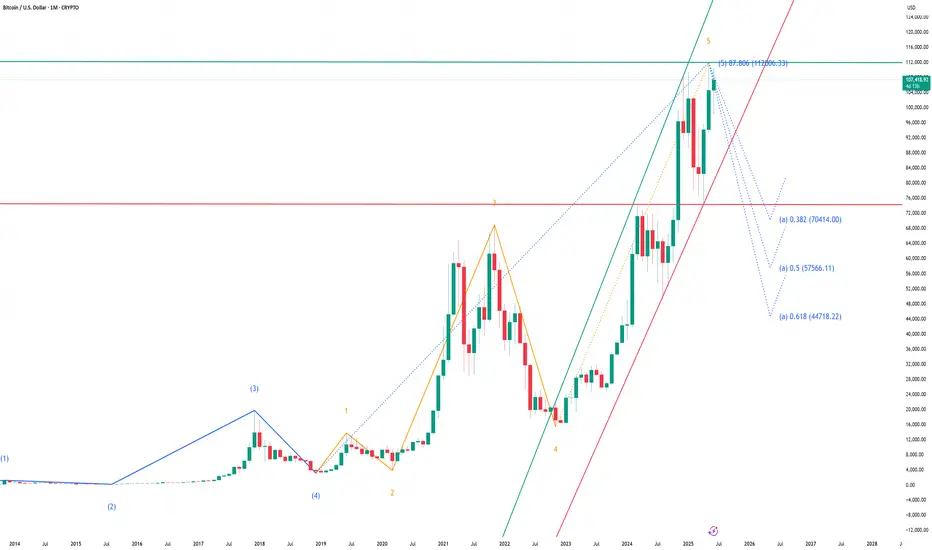
Cautionary tale on BitcoinI decided to temporarily depart from my usual trade ideas to wave a cautionary finger at the chart of Bitcoin, where I have noticed a rather worrying pattern within the weekly charts. However, before I delve in, I would like to stress that I am a very rigid believer in the long-term prospect of our monetary saviour and what I am supposed to write about only concerns the usual, inevitable cyclicality that always entails the otherwise upward-sloping trajectory of Bitcoin ( CRYPTO:BTCUSD )
Although overall this has not felt like much of a crypto bull run given the apparently absent performance of altcoins (apart from an occasional 1000x on a well-targeted memecoin), Bitcoin has, in the meantime, trod its usual path upwards. Since the '22 lows, it has mimicked its regular pattern where after a devastating plummet lower, it has spent several long months accumulating until it has burst out of its cocoon to provide a 6x return to its strong believer. However, the mimicking is almost too good as we have now started painting a very similar picture to what eventually transpired to be the '21 top. We have reached a strong above >100k top only to hit a vicious correction (announcement of tariffs), similar to what Bitcoin did in May of 2021 (China crackdown, tech selloff). The price then quickly consolidated - which I am not an avid fan of as a formation of a more robust base would be more preferable (though would take longer ) - and bitcoin shot back up again, quickly reclaiming the previous highs; just like it did in October/November 2021. This creates an unfortunate setup best represented by the series of lower highs on an RS I while the price keep climbing higher - creating the probably best-know bearish signal with higher highs built on weaker and less robust momentum.
We know how this ended in 2021, and I am not suggesting that Microstrategy should blow up, go bankrupt and sell all its bitcoin (though definitely a possibility) - however, one must admit that there are currently quite a lot of uncertainties that could unwind at any time (one such coming on July 8th with the second version of the lets-blow-up-the-stock-market day). With a stock market priced to perfection, and with what seems like a large pile of uncertainties hovering in the air, it seems like any one of these could light up the fire underneath these lovely valuations we have reached, and although I would love for cryptocurrency prices to be completely independent of the stock market, we usually know how this goes.
So, what to do about this? Preferably nothing . If you are as much of a believer as I am in the necessity of bitcoin in today's financial world, this is just another blip in an otherwise long and profitable ride. So, I won't be any selling any of it - hopefully only adding once we decline. I would also add that I am not expecting as much of a bloodbath as last time. I think Bitcoin has reached a point where the 80-90% declines become very rare. However, regarding my other allocations in crypto assets, I am not as optimistic, hence I decided to sell most of everything else. Although I love the premise of Ethereum, the chart looks pretty horrific, currently drawing a perfect head-and-shoulder on a 4h chart (which I might write about as well as a short idea).
I will end this essay the same way I started it - I know absolutely nothing, and maybe I will come back at the end of the summer, beautifully tanned and relaxed as we all are in Europe, and find everything at all-time highs. I just currently believe the risk-reward ratio is not skewed in my favour, and I don't know how about you, but I tend to listen to my probability gods, especially on the eve of another strong SPAC year .
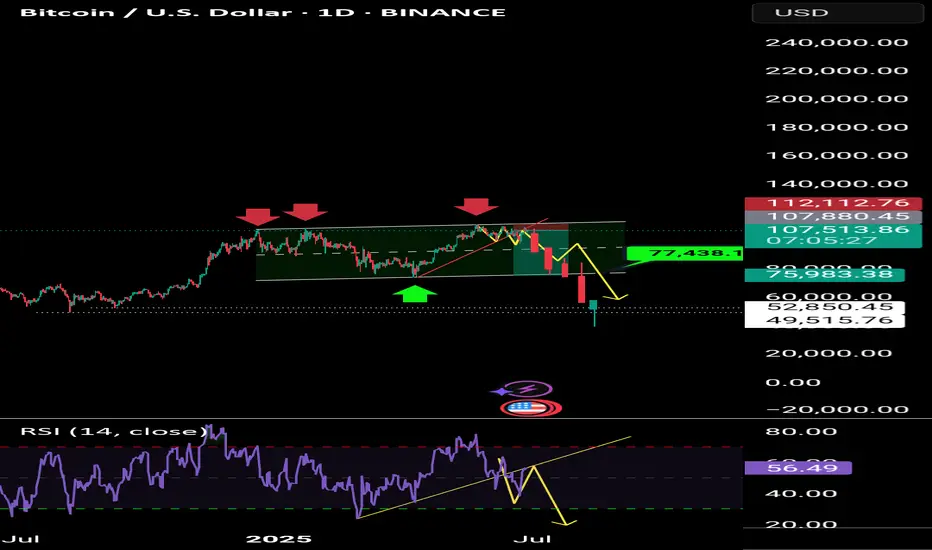
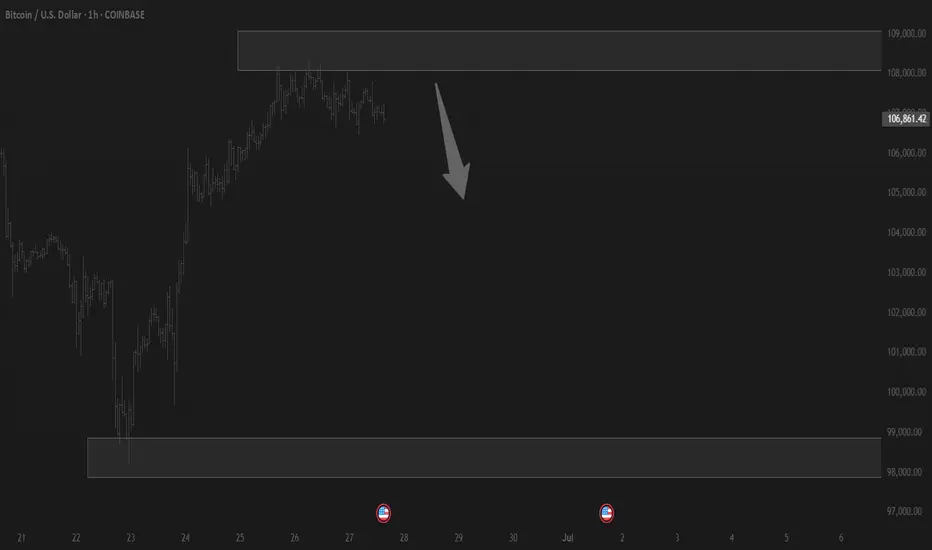
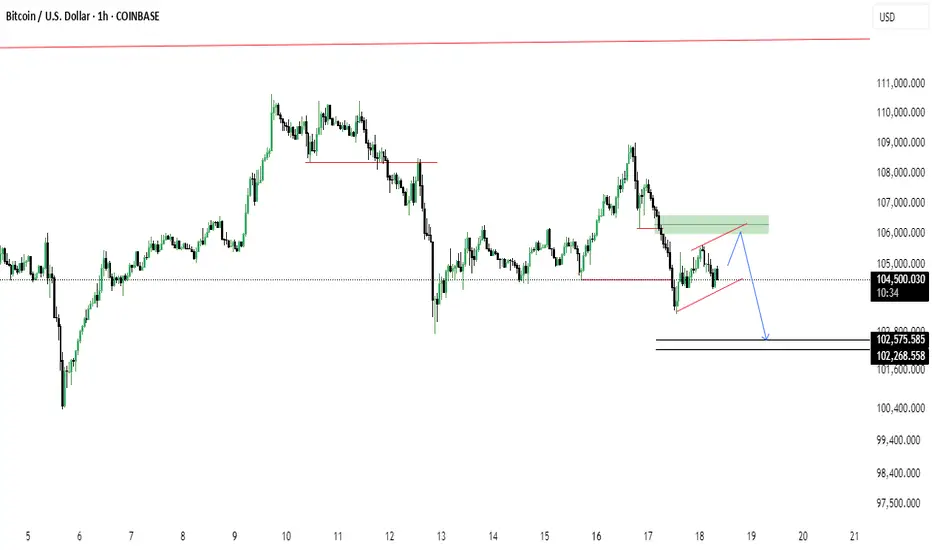
Market next target ⚠️ Disruption & Analytical Weaknesses:
1. Support Zone Already Broken (Wick Penetration):
The candlestick wick clearly pierced the support level drawn on the chart.
This indicates that buyers are weak at that level — the support is not holding firmly.
Relying on this support for a bullish bias is risky, as it may soon turn into resistance.
2. Volume Confirms Weakness, Not Strength:
The bounce from the support zone happens on low or declining volume, suggesting lack of strong buying interest.
A legitimate bullish reversal should be backed by a volume surge — here, that’s absent.
3. False Sense of Recovery:
The analysis shows arrows projecting straight up to the “Target” level, implying a smooth bullish recovery.
This is unrealistic given the recent choppy price action and repeated failures to hold gains above 107,200.
Price action suggests uncertainty or distribution, not clean bullish momentum.
4. Tight Range and High Volatility Ignored:
Price has been ranging between ~106,400 and ~107,600 with rapid whipsaws.
This kind of structure is often indicative of indecision, and setting a clear directional target without breakout confirmation is premature
Only all market sellllll This market is just liquidating and scares you into shorting, and suddenly it drops terribly, so if you have a short trade, hold until the first target is 75,000 and the second target is 39,000.😜😜😜😜😜
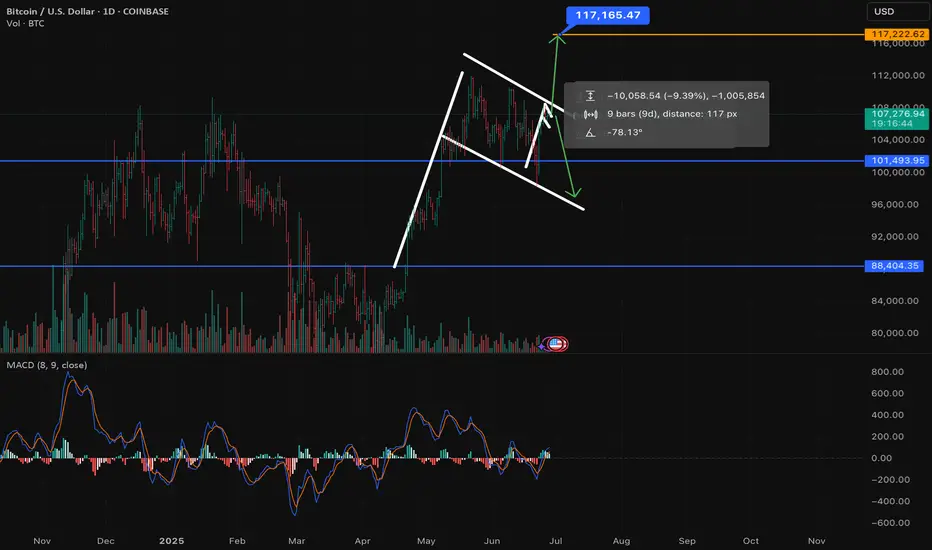
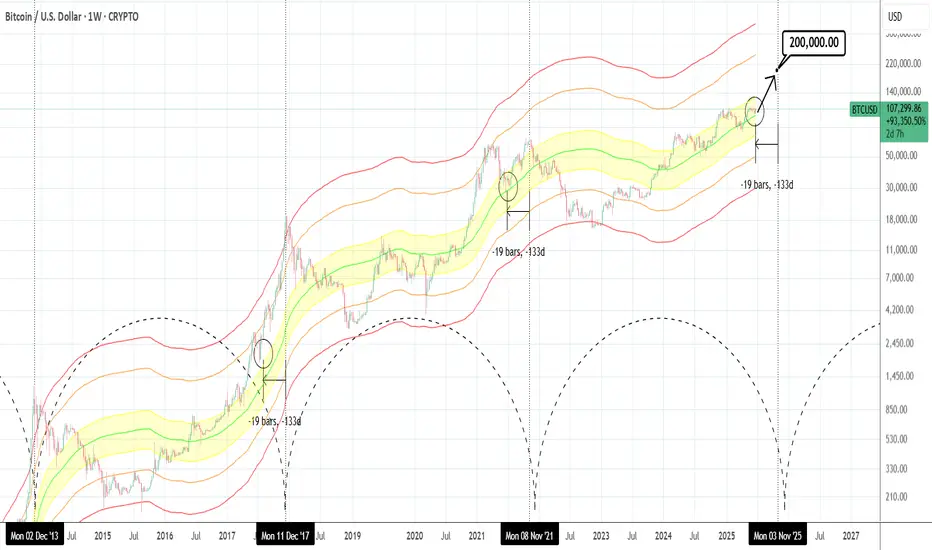
BTCUSD: Hasn't gone parabolic yet.Bitcoin is just now re-entering the bullish state on its 1D technical outlook (RSI = 55.820, MACD = 291.960, ADX = 15.180), being correcting/consolidating in the past 30 days. According to the Mayer Multiple Bands, it's stil inside the range (upper band) of the 1 Stdev Below-Mean-1 Stdev Above (yellow range). This suggest significant upside potential as being roughly 19 weeks before the Cycle tops, it matches the late June 2021 bottom inside that zone as well as the July 2017 bottom just over the top of that zone. The orange trendline has been the minimum target on every Cycle but looks unlikely to hit it by the end of the year. If however it goes parabolic as all Cycles had at this stage, $200,000 isn't at all far fetched before the Cycle tops.
## If you like our free content follow our profile to get more daily ideas. ##
## Comments and likes are greatly appreciated. ##
Bitcoin sell short This market is just liquidating and scares you into shorting, and suddenly it drops terribly, so if you have a short trade, hold until the first target is 75,000 and the second target is 39,000.
Bitcoin ready for big sell This market is just liquidating and scares you into shorting, and suddenly it drops terribly, so if you have a short trade, hold until the first target is 75,000 and the second target is 39,000.
BTC Breakout or dropBitcoin has been trading in a range from 97.5K-112K for some time we tested 97K weekend and we bounce over 10% but we fail to make a ATH, also Bitcoin has strong bearish divergences that hardly anyone pays key attention to and these are almost identical to 2021 cycle top.
I have draw the resistance line and support from 2021 my theory is that IF we invalidate the bearish divergences we can see price action between 145K + . I do not think we can see a 320K price per bitcoin this cycle this will maybe happen in 2028 or 2032 cycle. Now if we do not breakout and invalidate the bearish divergences we can see the price dropping back to test the major 2021 support which is around 78K-84K only when this support if broken and we close a full body weekly candle below it then this confirms bear market has started.
Price action has move almost 8X from the 2022 ATL which is a decent return if you bought and hold.
If you enjoy the TA feel free to join my network its absolutely FREE.
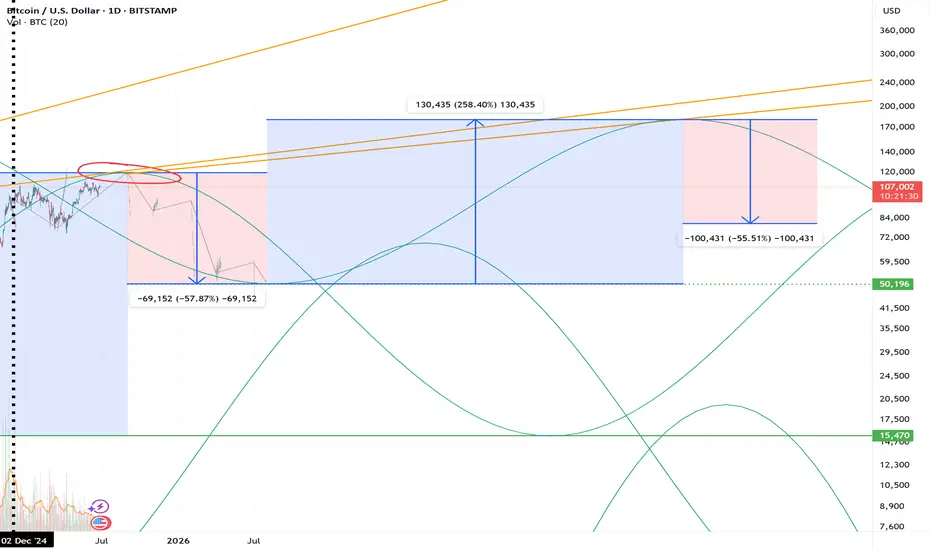
Future idea: Bitcoin Valuation in 2030I've been thinking about how this and previous cycles seems to follow some general trends and my previous prediction is seemingly playing out pretty well. I'm hoping to look back in 5 years and be right.
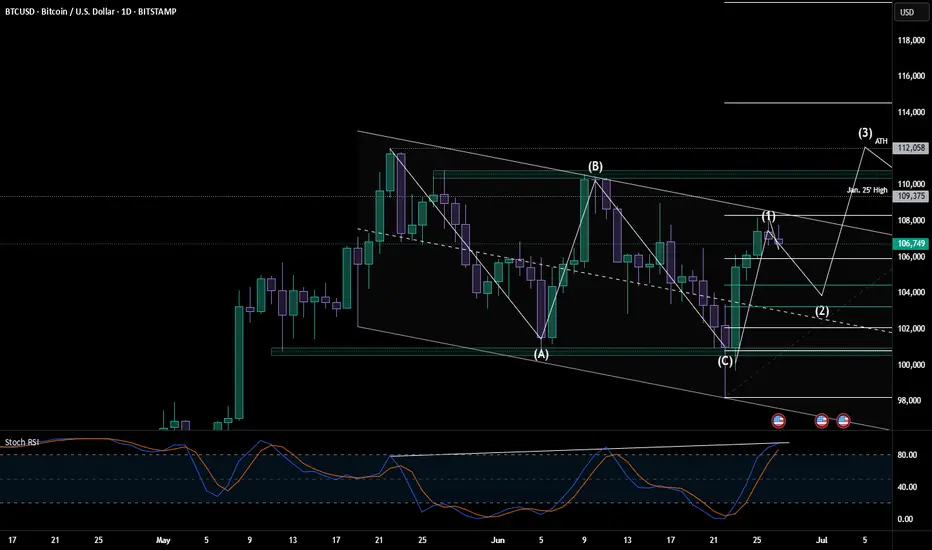
BTC Looking for a Wave 2 Reset Before the Real MoveBITSTAMP:BTCUSD looks like it just wrapped a clean ABC correction and kicked off a fresh 5-wave impulse. We’ve probably topped out on wave 1 heading into the weekend, Stoch RSI is flashing overbought, price is hitting resistance just under 108.3K, and we’re also seeing some bullish divergence creeping in.
I’m expecting a pullback from here, ideally into that 0.5–0.618 retrace zone (103.2K–104.4K). That would line up well with the mid-channel and EMA support. From there, we could be set up for a proper wave 3 breakout (as long as we don't get any more surprise tariffs or wars).
Fed still leaning dovish into Q4, even with some Q3 inflation and tariff noise. Rate cut odds ramp into Sept/Dec, so bigger picture looks constructive. In my eyes, the longer the FED holds off on these cuts, the longer this cycle extends.
Key zones I’m watching:
Support: 105.3K > 103.2K > 100.8K
Resistance: 108.3K > 112K > 114.5K+
If we dip and hold structure, I’ll be watching for confirmation to load into wave 3.
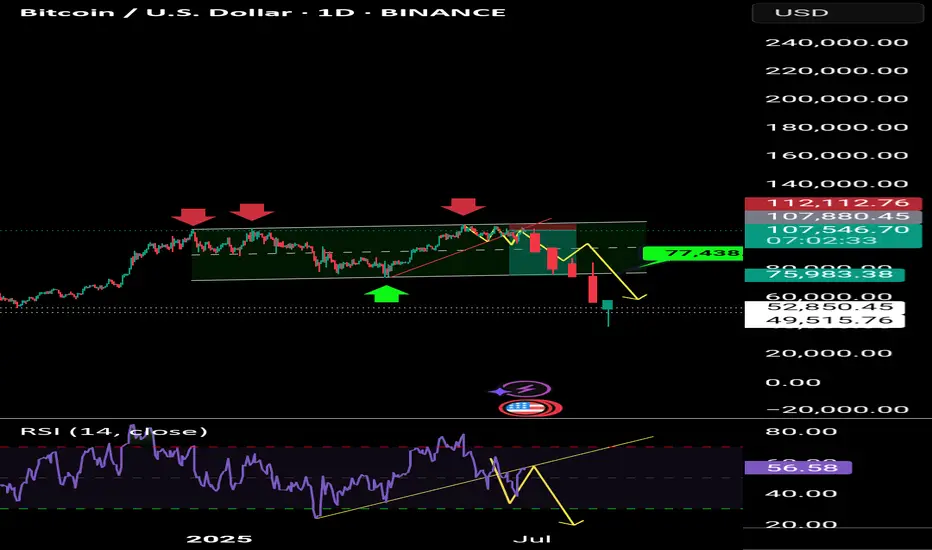
$BTC – Three Possible Scenarios in the Near FutureCRYPTOCAP:BTC – Three Possible Scenarios in the Near Future:
🔹 Optimistic: Growth up to $140,000
🔹 Conservative: Growth up to $112,000
🔹 Pessimistic: Decline to $75,000 – $85,000
🚨 Key Levels to Watch:
▪️ $112,000 — a breakout above this level could open the path to $135,000 – $145,000
▪️ $100,000 – $103,000 — if BTC drops into this zone, it could trigger a decline toward $85,000 – $95,000
▪️ $83,000 — falling to this level may indicate further downside to $30,000 – $50,000
Trading balanceTrading balance The price of the asset has rebounded from the balance zone. With the prospect of growth into the resistance zone.
BTC LONG TP:108,600 26-06-2025Looks like a classic fakeout before a big move 💥
Entry between 105,800 – 106,450, targeting 108,400 – 108,900, with an average 3.5 RR.
🕐 Timeframe: 1H
⏳ Duration: Fast move
Context: Expecting a quick manipulation before an expansion toward 108,500 – 109,500. The only problem? The stop. Manage it based on your own strategy — this one’s spicy.
If the move doesn’t happen within the expected time, the setup is invalid.
We don’t use indicators, we’re not out here drawing lines or cute little shapes — I just give you a clean trade.
BTCUSDTPrice action trading is a methodology in financial markets where traders make decisions based on the actual price movements of an asset over time, rather than relying heavily on technical indicators or fundamental analysis. It involves observing and interpreting patterns and trends in price charts to predict future price movements.
BTC/USD Rising Wedge Breakdown Ahead?Bitcoin shows signs of a potential bearish reversal as price forms a rising wedge beneath a key supply zone. After a recent drop, price is retesting the 106k area (green zone), possibly setting up for continuation to the downside.
🔹 Rising wedge pattern near resistance
🔹 Bearish retest at previous support turned resistance
🔹 Potential drop targets: 102,575 and 102,268
🔹 Break below wedge support could accelerate the fall
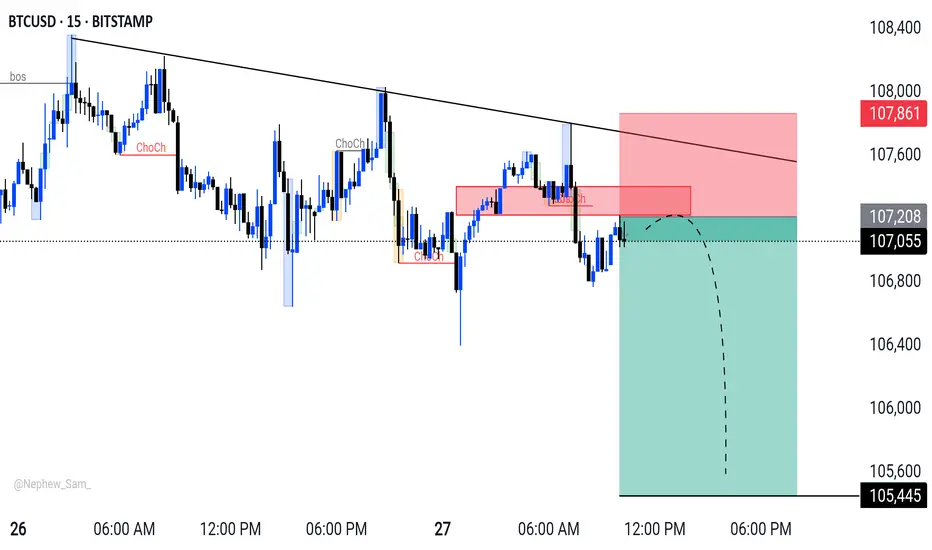
BTCUSD Short Idea - Looking for further downsideBTCUSD (15m timeframe).
* Bearish Trend: Price has been respecting the downtrend line.
* Structure Break (ChoCh): Multiple 'ChoCh' (Change of Character) signals indicate a shift in market structure to bearish.
* Supply Zone Entry: I'm looking for a retest of the recent supply zone around 107,208 - 107,059 for a short entry.
* Stop Loss: Placed above the last significant high and supply zone around 107,861.
* Target: Aiming for 105,445, potentially lower, targeting previous lows and liquidity.
Always manage your risk! Let me know your thoughts."
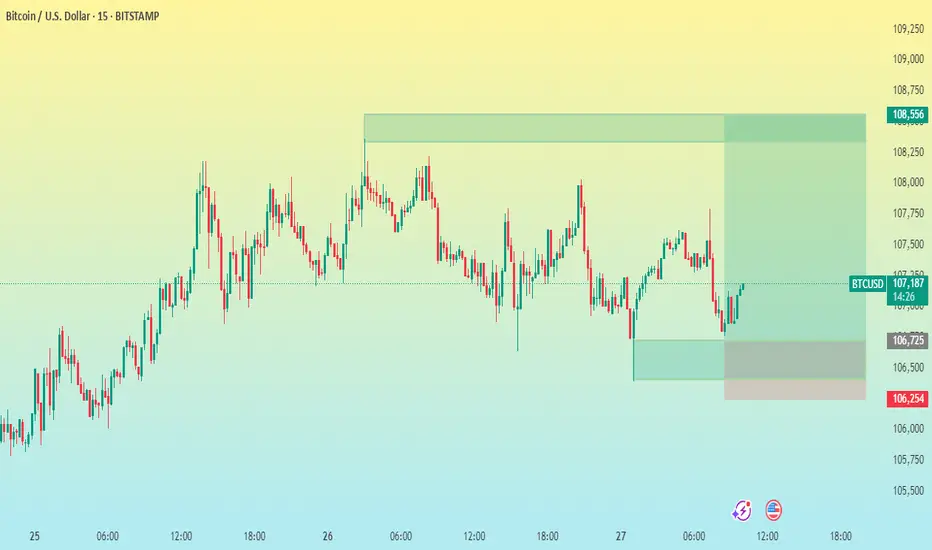
BTC/USD 15 M CHART PATTERN 🕵♂ Chart Context
Asset: Bitcoin (BTC) vs. USD
Exchange: Bitstamp
Timeframe: 15-minute
Date Range: June 25–27, 2025
Chart Type: Candlestick
---
📊 Technical Analysis
1. Trend
Short-term trend: Sideways to slightly bullish.
Market saw an earlier uptrend, then consolidation with lower highs and higher lows (forming a range).
Price is currently rebounding from the lower part of the range.
2. Key Levels
Entry Level: ~107,123 – likely where a long trade was entered.
Support Zone:
Minor: 106,725
Strong: 106,254 (stop-loss level, clear structure support)
Resistance Zone / Target: 108,556 – a prior high and possible supply zone.
3. Risk-Reward Ratio
Entry: 107,123
SL: 106,254 (−869 points)
TP: 108,556 (+1,433 points)
RR Ratio: ≈ 1.65:1 – acceptable for intraday trading.