Valtrix Group: Crypto Today – Bitcoin Explodes Toward $120,000The global cryptocurrency market continues to surprise: Bitcoin is confidently approaching the $120,000 mark, reinforcing the role of digital assets as an integral part of the global financial system.
Record Growth: What’s Behind Bitcoin’s New Surge?
Amid rising institutional interest, growing retail demand, and expectations of interest rate cuts in the U.S., Bitcoin is demonstrating impressive growth. Over the past few weeks alone, the cryptocurrency has surged by more than 20%, and Valtrix Group analysts believe the psychological threshold of $120,000 could be crossed in the near future.
Key drivers of this growth include:
Active institutional buying, including investment funds and major banks;
Reduced Bitcoin supply following this year’s halving;
Stabilizing regulatory environment in regions like the U.S., Europe, and Southeast Asia;
A shift by traditional investors into digital assets amid geopolitical instability and inflationary concerns.
How Is the Market Reacting?
Altcoins are also experiencing significant growth, following the market leader. Ethereum has surpassed $7,000, while tokens such as Solana and Avalanche have jumped more than 30% in a week.
Investors are increasing trading volumes and locking in profits, but interest in long-term HODL strategies is also on the rise. According to Valtrix Group, this is not just a short-term speculative wave, but a sustainable trend backed by strong fundamentals.
What’s Next? Forecast from Valtrix Group
Our analysts believe that Bitcoin could reach $125,000–$130,000 in the short term if the current momentum continues. However, we advise investors to proceed with caution: high volatility remains a defining feature of the crypto market.
Valtrix Group recommends:
Diversifying portfolios to include digital assets;
Applying risk management strategies;
Monitoring news cycles and macroeconomic indicators.
Valtrix Group continues to closely monitor market developments, providing clients with up-to-date analytics, investment guidance, and digital finance support.
BTCUSD.PM trade ideas
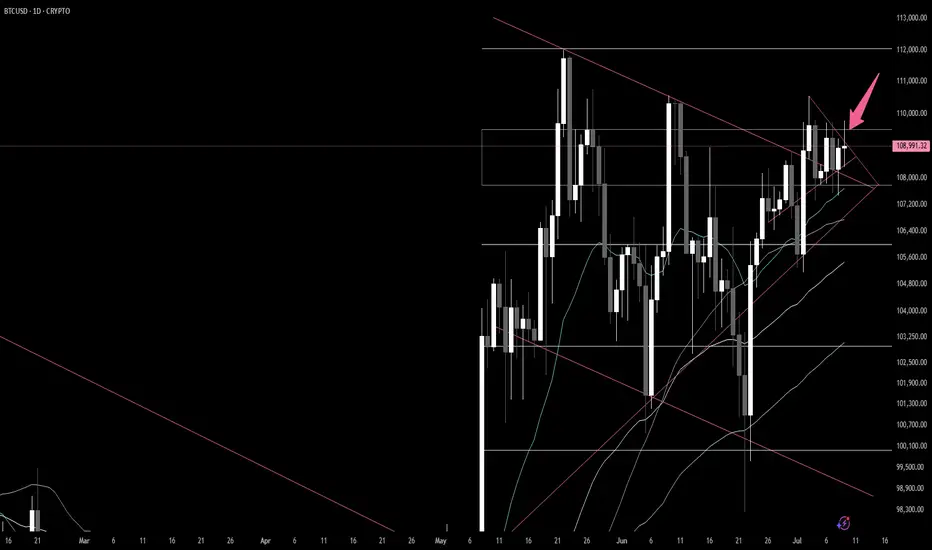
BITCOIN - Price can drop from resistance area to $103000Hi guys, this is my overview for BTCUSD, feel free to check it and write your feedback in comments👊
Some days ago, price entered a pennant pattern, where it at once made an upward impulse from support line.
Then the price reached $98700 level and soon broke it, after a small correction, and then continued to move up.
Later BTC rose to the resistance line of the pennant, but soon turned around and started to decline, breaking $110000 level.
Price little corrected and then tried to bounce back and failed, after which it fell to $98700 level and then started to grow.
In a short time, BTC rose to a $110000 resistance level and tried to break it again, but recently turned around and started to fall.
Now, I expect that BTC can grow to the resistance area and then drop to $103000 support line of the pennant.
If this post is useful to you, you can support me with like/boost and advice in comments❤️
Disclaimer: As part of ThinkMarkets’ Influencer Program, I am sponsored to share and publish their charts in my analysis.
Key Insights: Financial Markets Transformation by 2030For years, this page has been my space to share in-depth market research and personal insights into key financial trends. This post reflects my perspective — a strategic outlook on where I believe the digital finance industry is heading.
The financial world is evolving at an unprecedented pace, and it's easy to overlook subtle shifts. But the undeniable fact is that we are now standing at the intersection of three powerful industries — financial markets, blockchain, and artificial intelligence. We are positioned at the cutting edge of technology, where innovation is not a future concept but a present reality.
This post serves as a reference point for future trends and a guide to understanding the transformative forces shaping financial markets by 2030. These are not just facts, but my vision of the opportunities and challenges ahead in this rapidly converging digital ecosystem. Staying ahead today means more than following the market — it means recognizing that we are part of a technological shift redefining the core of global finance.
📈 1. Electronic Trading Evolution
Full transition from traditional trading floors to AI-driven digital platforms.
Integration of blockchain and smart contracts ensures transparency, automation, and risk reduction.
Real-time data analytics democratizes market access and enhances strategic decision-making.
🤖 2. Algorithmic Trading Growth
Accelerated by AI, machine learning, and big data analytics.
High-frequency trading (HFT) boosts efficiency but introduces new volatility factors.
Adaptive algorithms dynamically adjust strategies in real time.
Strong focus on regulatory compliance and ethical standards.
🔗 3. Tokenization of Real World Assets (RWA)
Transforming asset management with projected growth to $18.9 trillion by 2033. (now 18.85B)
Enhances liquidity, accessibility, and transparency via blockchain.
Institutional adoption is driving mainstream acceptance.
Evolving regulations (DLT Act, MiCA) support secure tokenized ecosystems.
🏦 4. Institutional Adoption & Regulatory Frameworks
Digitalization of fixed income markets and exponential growth in institutional DeFi participation.
Key drivers: compliance, custody solutions, and advanced infrastructure.
Global regulatory harmonization and smart contract-based compliance automation are reshaping governance.
💳 5. Embedded Finance & Smart Connectivity
Embedded finance market to hit $7.2 trillion by 2030.
Seamless integration of financial services into everyday platforms (e-commerce, mobility, etc.).
AI, blockchain, and IoT power real-time, personalized financial ecosystems.
Smart contracts reduce operational friction and enhance user experience.
🛡 6. Financial Crime Risk Management
Market expected to reach $30.28 billion by 2030.
AI-driven threat detection and anomaly monitoring strengthen AML compliance.
Blockchain ensures data integrity and automates cross-border regulatory adherence.
Global collaboration (FATF, EU AML) fortifies defenses against evolving financial crimes.
🌍 7. Consumer Behavior & Financial Inclusion
Digital banking bridges the gap for underbanked populations, especially in emerging markets.
Mobile solutions like M-Pesa revolutionize access to financial services.
Biometrics, microfinance, and AI-powered engagement tools foster inclusive economic participation.
🚀 Conclusion
By 2030, financial markets will be defined by technology-driven efficiency, regulatory adaptability, and inclusive growth.
Success will favor those who embrace innovation, leverage automation, and engage in cross-sector collaboration.
The future belongs to agile stakeholders navigating a landscape shaped by AI, blockchain, tokenization, and smart finance connectivity.
Best regards, EXCAVO
_____________________
Disclosure: I am part of Trade Nation's Influencer program and receive a monthly fee for using their TradingView charts in my analysis.
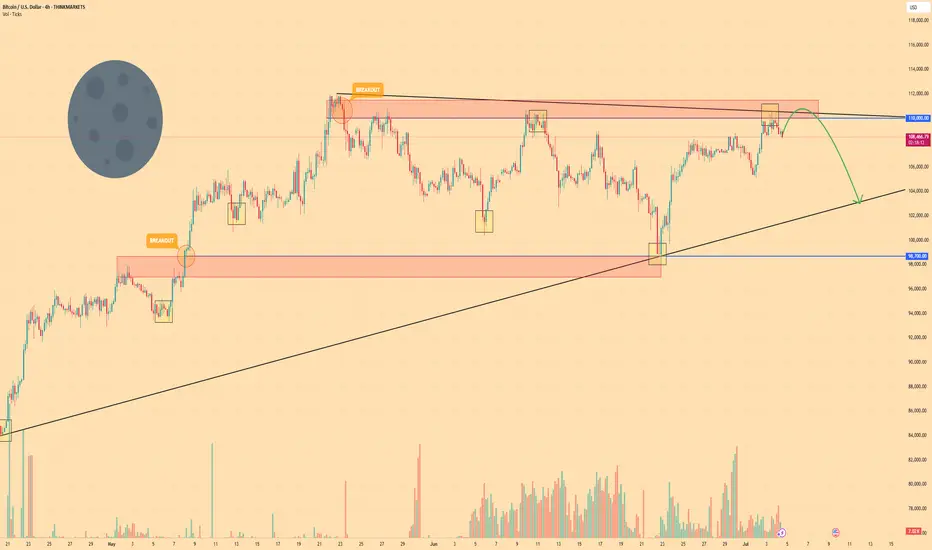
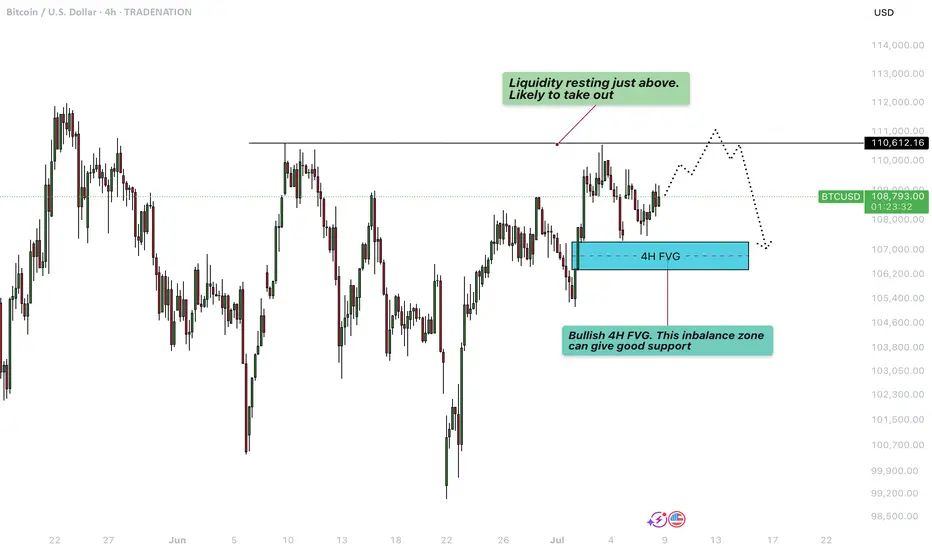
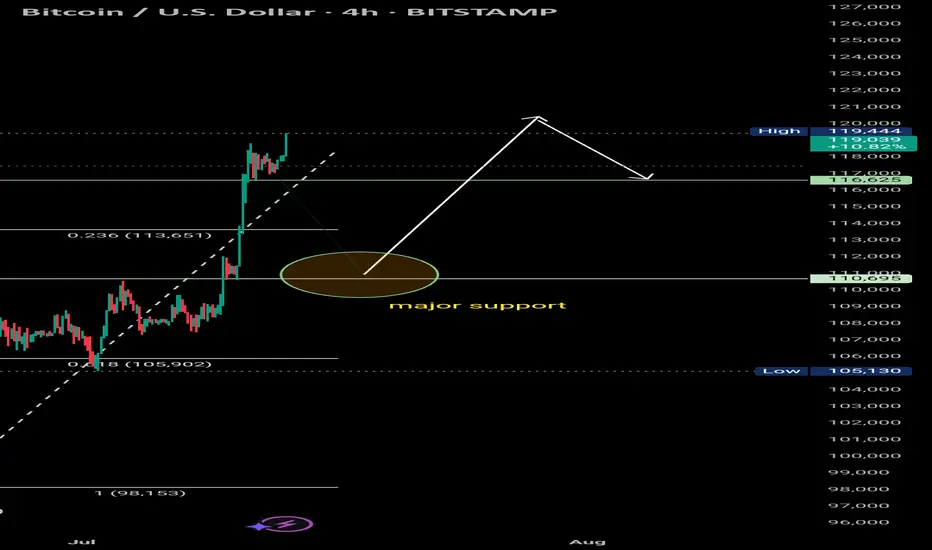
Bitcoin - Liquidity grab at $111.000?This 4-hour BTCUSD chart illustrates a potential short-term bullish continuation scenario followed by a deeper retracement, highlighting key liquidity levels and an important Fair Value Gap (FVG) support zone.
Liquidity sweep
At the top of the current price action, just above the $110,612.16 level, there is a clear area of resting liquidity. This zone has likely accumulated a significant number of stop-loss orders from traders who are shorting the market or who went long earlier and are protecting profits below previous highs. The market tends to seek liquidity to fill institutional orders, making this zone a high-probability target for a sweep. As a result, price is likely to take out these resting stop orders in a quick upward move, often referred to as a "liquidity grab" or "stop hunt", before potentially reversing or consolidating.
Bullish 4H FVG
Following this liquidity sweep, the chart suggests a retracement into a bullish 4-hour Fair Value Gap (FVG) located around the $106,600 to $107,400 region. This imbalance zone was formed during an impulsive move up, leaving behind a gap between the wicks of consecutive candles. Such gaps represent areas where demand previously overwhelmed supply, and they often act as strong support on a retest. If price revisits this zone, it is expected to offer support and could serve as a base for another upward push, assuming bullish momentum remains intact.
Downside risk
However, if the bullish FVG fails to hold as support and price breaks down through this imbalance zone, it would signal a weakening of bullish structure. In that case, the breakdown would likely lead to a deeper correction or even a trend reversal, with price seeking lower levels of support further down the chart. This would invalidate the short-term bullish scenario and suggest that sellers are gaining control, possibly triggering further liquidations and more aggressive selling pressure.
Conclusion
Overall, the chart is currently leaning bullish, anticipating a liquidity sweep to the upside followed by a potential pullback into the FVG. The reaction at the FVG will be critical in determining whether the market can continue higher or if it shifts into a deeper bearish correction.
Disclosure: I am part of Trade Nation's Influencer program and receive a monthly fee for using their TradingView charts in my analysis.
Thanks for your support.
- Make sure to follow me so you don't miss out on the next analysis!
- Drop a like and leave a comment!
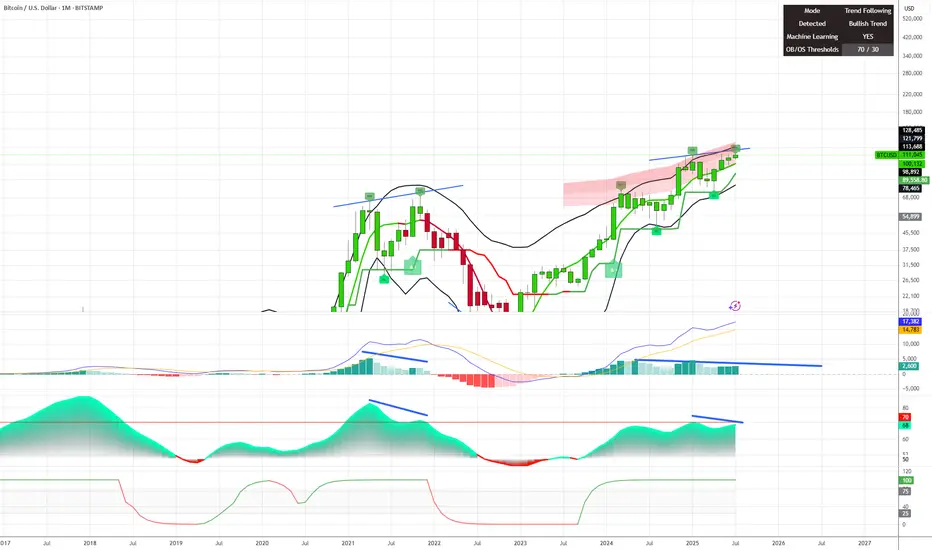
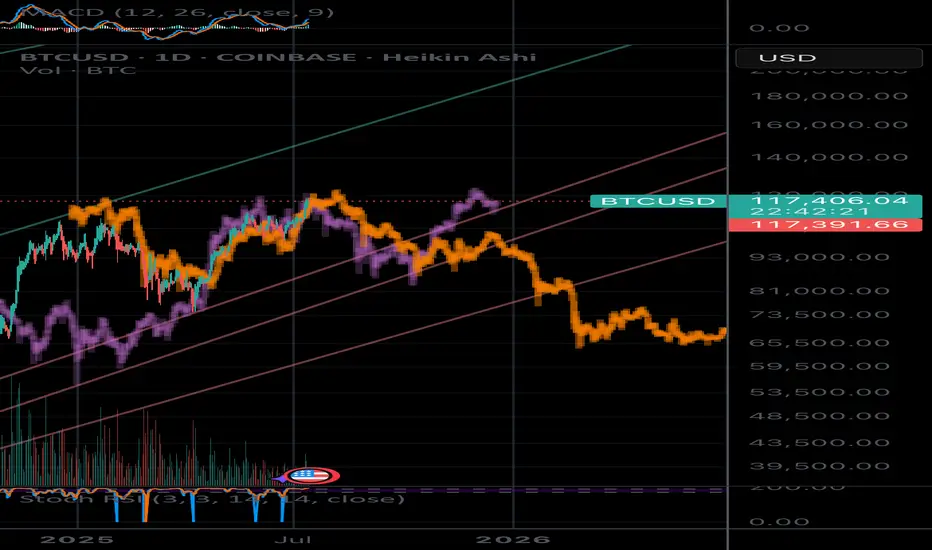
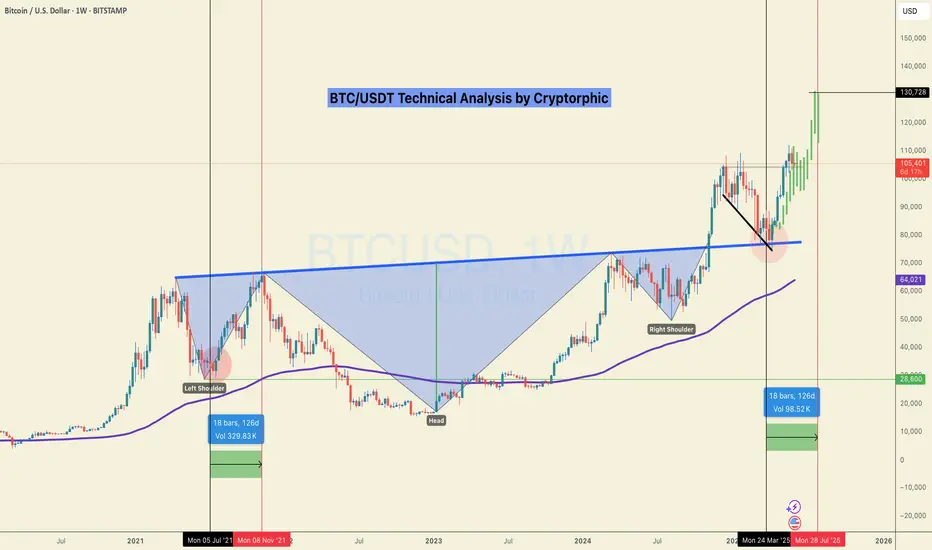
Double Top Monthly TimeframeBitcoin Monthly – Double Top + Bearish Divergence (MACD & RSI) | Bull Cycle Over? [/b
Technical Breakdown:
We're witnessing strong signals that the Bitcoin bull cycle could be over. Here's why:
1. Monthly Double Top
Price has failed to break convincingly above the previous ATH 112k
Two clear peaks on the monthly chart, forming a classic double top pattern.
2. Bearish Divergence – RSI & MACD
MACD and RSI: Lower highs while price made equal/higher highs → Momentum weakening.
Trend reversal likely - level to watch 89k breaking this bullish trend line level, bitty will be shifting to a bearish trend..
It's too early and too bold to short and call the top is in — you need to trust your chart.
Bearish divergence confirmed
Likely end of 2023-2025 bull cycle
The permabulls won’t like this — but charts don’t bend to hopium
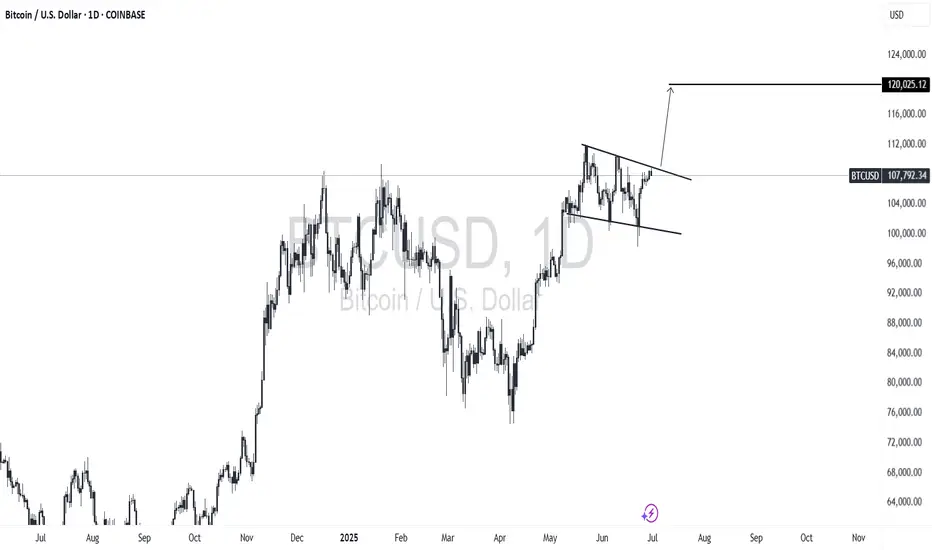
Breakout July 10, 2025Price is getting compressed in a smaller higher pennant above the upper limit bull flag. I suspect that we see one more sharp pullback in mid-late August before achieving cycle pico top. Brace yourselves, tomorrow should be the day!
July 14 Bitcoin Bybit chart analysisHello
It's a Bitcoin Guide.
If you "follow"
You can receive real-time movement paths and comment notifications on major sections.
If my analysis was helpful,
Please click the booster button at the bottom.
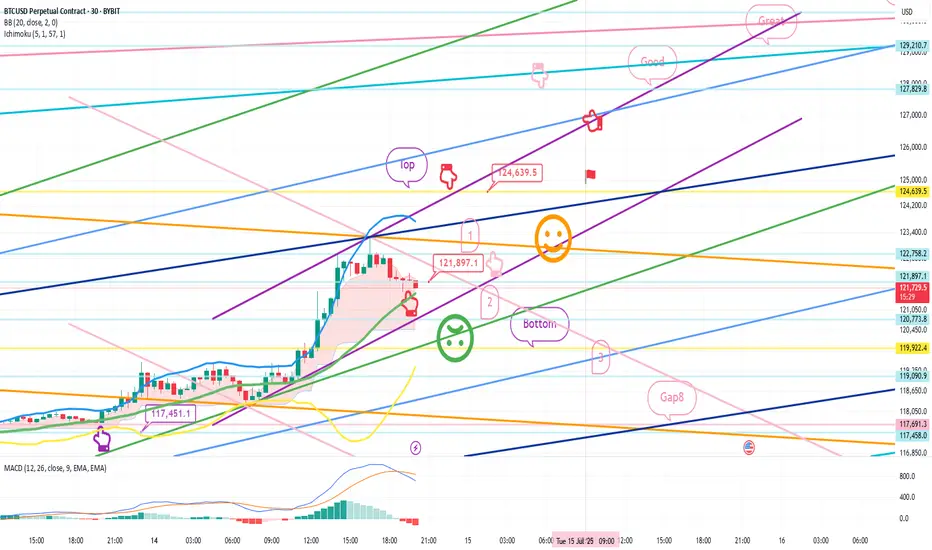
This is a Bitcoin 30-minute chart.
There is no separate Nasdaq indicator announcement.
Nasdaq upper gap reversal condition and
Bitcoin is moving sideways after a sharp rebound until the afternoon.
I created today's strategy based on the vertical decline condition based on the 5-minute trend reversal in Tether Dominance.
On the lower left, I connected the long position entry section of 117,451.1 dollars that I entered on the 11th.
* In the case of the red finger movement path,
This is a one-way long position
current position chase purchase strategy.
1. Chasing purchase at 121,897.1 dollars / Stop loss price when the green support line is broken
2. 124,639.5 dollars long position 1st target -> Good, Great in order of target price
Since I left a simulation in the middle,
I think it would be good to use it for re-entry after liquidating the long position.
The movement within the 1st section at the top and the 2nd section at the bottom
is an extreme sideways movement, and from a long position,
if it succeeds in rebounding within the 2nd section, it becomes a strong upward condition.
From the 3rd section breakout today,
the low point is broken in the newly created weekly and daily chart candles this week,
so please note that the upward trend may be delayed.
The next support line is the Gap8 section created last week.
Up to this point, I ask that you simply refer to and utilize my analysis
and I hope that you operate safely with principle trading and stop loss prices.
Thank you.
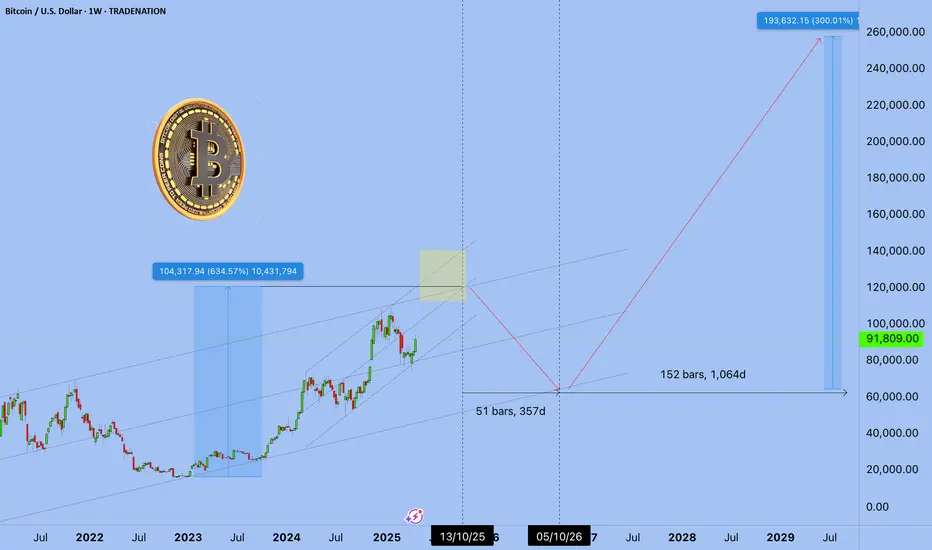
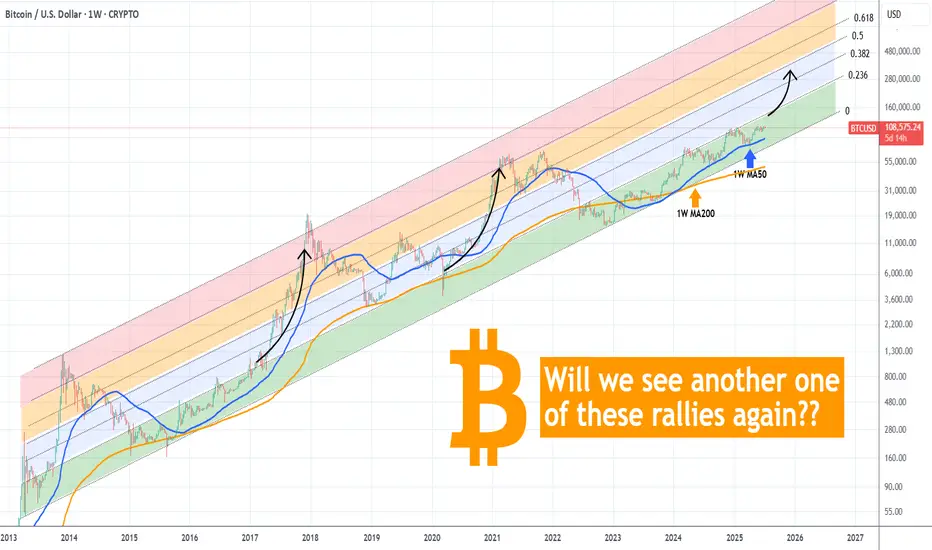
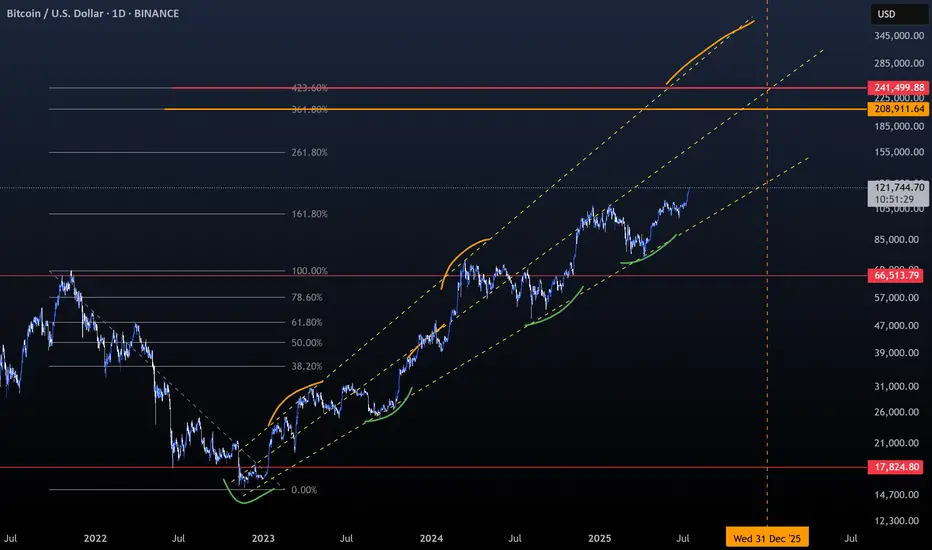
BITCOIN Is there enough time for another parabolic rally?Bitcoin (BTCUSD) is practically consolidating on the short-term, having just recently been rejected off its new All Time High (ATH). Despite the short-term volatility, the long-term outlook is still a very strong, structured uptrend, a Channel Up pattern that is now technically aiming for its next Higher High.
Incredibly enough, this Channel Up since the November 2022 market bottom, has been almost entirely within the Buy Zone (green) of the Fibonacci Channel Up going back all the way to April 2013!
As you can see during the previous two Cycles, every time BTC got above that Buy Zone, it started a parabolic rally. So far, we haven't got such rally on the current Cycle and with time running out (assuming the 4-year Cycle model continues to hold), do you think we will get one this time around?
Feel free to let us know in the comments section below!
-------------------------------------------------------------------------------
** Please LIKE 👍, FOLLOW ✅, SHARE 🙌 and COMMENT ✍ if you enjoy this idea! Also share your ideas and charts in the comments section below! This is best way to keep it relevant, support us, keep the content here free and allow the idea to reach as many people as possible. **
-------------------------------------------------------------------------------
💸💸💸💸💸💸
👇 👇 👇 👇 👇 👇
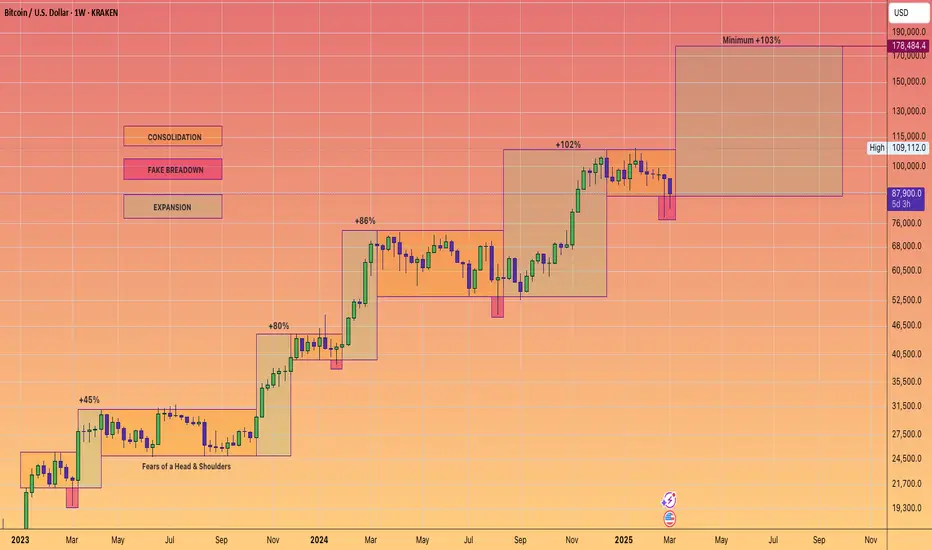
BITCOIN's PUMPs are Getting LARGER this Bull Market...However, it may take a bit longer to realize those expansionary moves.
If Bitcoin adheres to the established cycle pattern, we can anticipate a minimum surge of 103% that should carry us into the fourth quarter of this year.
Consolidation ----> Fake breakdown ----> then expansion.
Are you ready?
Inverted BTC tells the full storyahhh here we are again bulls with the same playbook late in the cycle. we will see 40k before 200k
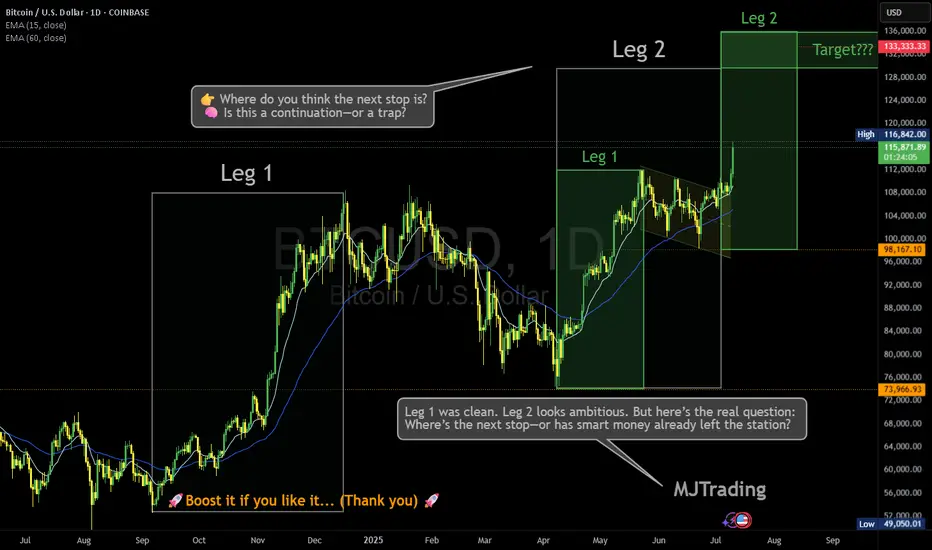
Where is the next stop? 133,333?Leg 1 was clean. Leg 2 looks ambitious. But here’s the real question: Where’s the next stop—or has smart money already left the station?
BTC just sliced through both EMAs with conviction, now hovering above $116K. Volume’s decent, sentiment’s euphoric… but is this rally genuine markup, or a cleverly disguised distribution phase?
🔍 Price targets like $133K are seductive—but what if consolidation isn’t horizontal anymore?
Vertical consolidation is real. And it’s where retail gets baited hardest.
📊 Leg 2 might still play out—but don’t ignore the possibility that this is the final markup before a liquidity sweep.
👉 Where do you think the next stop is? 🧠 Is this a continuation—or a trap?
Drop your guess...
Who has entered here:?
Who can let the winners run in this situation:
#MJTrading #ATH
#Bitcoin #BTC #CryptoTrading #SmartMoney #MarketStructure #WyckoffMethod #LiquiditySweep #DistributionPhase #TechnicalAnalysis #TradingView #CryptoChart #PriceAction #EMA #Consolidation #CryptoStrategy #TrendReversal #CryptoCommunity
Educational: how to spot bitcoin tops before they happenBitcoin is rising, but how far can it go? In this video, I walk through key tools to spot local tops, including funding rates, Twitter sentiment, and pattern targets. We also discuss setups in XRP and Solana, and what to watch ahead of the US crypto regulation update on July 22.

BTC crash to 50kLooks like the top is in!
This should propagate into a nice bear run.
Crypto community got BTC to 100,000$
That’s the PUMP
Then the ETF opens the flood gates for corrupt / corporate money supply… that’s the DUMP signal!
Take their money and run!
Where to? Maybe the park… I’m gonna run my DOGE!
#BTC/USDT It's not over yet! Eying at 130K +ALTCOIN CHEAT SHEET!The last time I shared this chart was on April 14th, when Bitcoin was trading around $84,000 — right when panic was setting in across the market.
The message back then was simple: don’t panic, it’s just a retest.
And here we are again, revisiting the same sentiment with a new chart!
There are a lot of “double top” charts circulating in the space right now, but let me be clear: it’s not over yet.
Before jumping to conclusions, go through this chart and analysis to understand the full picture.
Bitcoin closed the week at $105,705 — certainly higher than most expected just a few days ago.
This marks the first red weekly candle after seven consecutive green closes, which is normal in the context of a healthy uptrend. We're still midway toward the broader target, so there’s no reason to panic or shift into disbelief.
Yes, we may see further corrections in BTC over the coming days or week, potentially down to $98K, and in a less likely scenario, even $ 92K. But this time, Ethereum is showing signs of strength and is likely to outperform Bitcoin, creating high-quality entry opportunities across the altcoin market. In other words, this phase is not a threat, it's an opportunity. BTC is still destined to hit $130k+ as per charts and other important metrics.
Here’s a typical market structure and reaction flow to help put things in perspective:
1. Bitcoin rallies — Altcoins underperform or get suppressed due to capital rotation into BTC.
2. Bitcoin corrects — Altcoins correct further as fear increases and dominance rises.
3. Bitcoin stabilises — Ethereum begins to gain strength, often leading the altcoin recovery.
4. ETH/BTC ratio increases — Ethereum holds up better while many altcoins continue to lag.
5. Bitcoin breaks ATH — This triggers a gradual recovery in altcoins.
6. BTC dominance peaks — Altcoins start gaining serious momentum.
7. Capital rotates from BTC and ETH into altcoins — Sectors tied to the current narrative (like meme coins this cycle, and Metaverse/NFTs in the last one) begin to lead.
8. Altcoin season begins — Utility and mid-cap tokens follow, often delivering strong returns in the final phase.
This pattern has repeated across cycles. Currently, we appear to be in the transition between Bitcoin stabilising and Ethereum gaining dominance — typically the stage that precedes a strong altcoin rally.
Now is not the time to assume the move is over. Stay objective, monitor capital rotation closely, and prepare for what comes next.
If your views resonate with mine, or if this post adds any value to you, please boost with a like and share your views in the comments.
Thank you
#PEACE
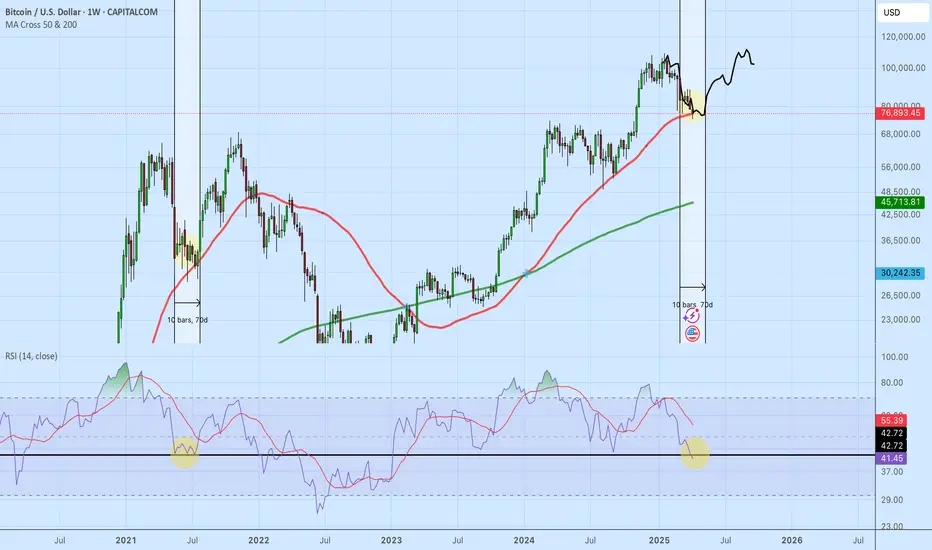
BTC - Onward and upwardThe 200 EMA is about to cross the 200 DMA and I show the last time that happened then I use the fractal from that period to project what BTC could do if something similar. It also lines up with fibs and channels. Let's see what happens
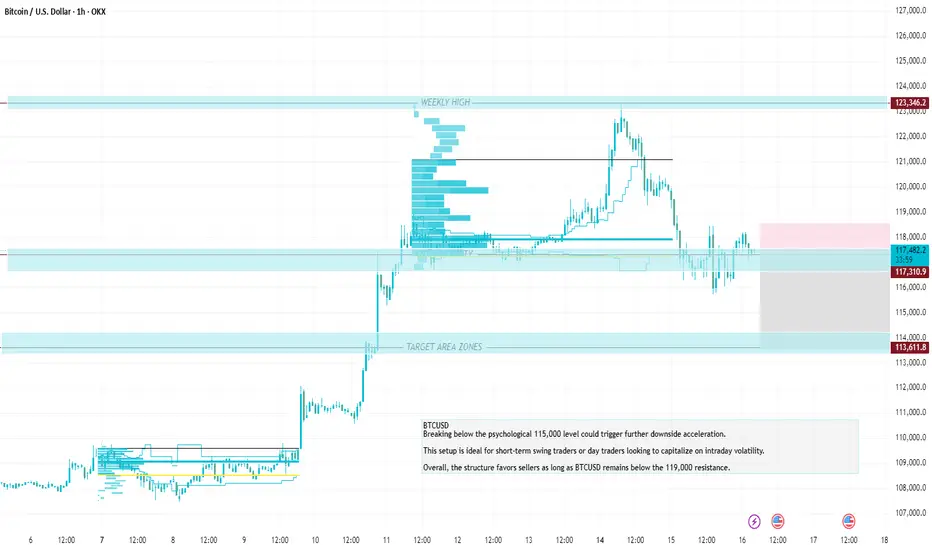
Breaking below the psychological 115,000 level could trigger furMomentum indicators such as RSI and MACD likely show bearish divergence or downward momentum, supporting the short thesis.
The recommended stop-loss for this setup is at 119,000, which is just above recent resistance and protects against false breakouts.
This SL level offers a good risk-reward ratio, with approximately 2:1 or better depending on entry precision.
If price fails to reclaim 119,000 or form higher highs, the bearish momentum is expected to persist.
Price rejection candles or bearish engulfing patterns near 117,500 further validate short entries.
Breaking below the psychological 115,000 level could trigger further downside acceleration.
This setup is ideal for short-term swing traders or day traders looking to capitalize on intraday volatility.
Overall, the structure favors sellers as long as BTCUSD remains below the 119,000 resistance.
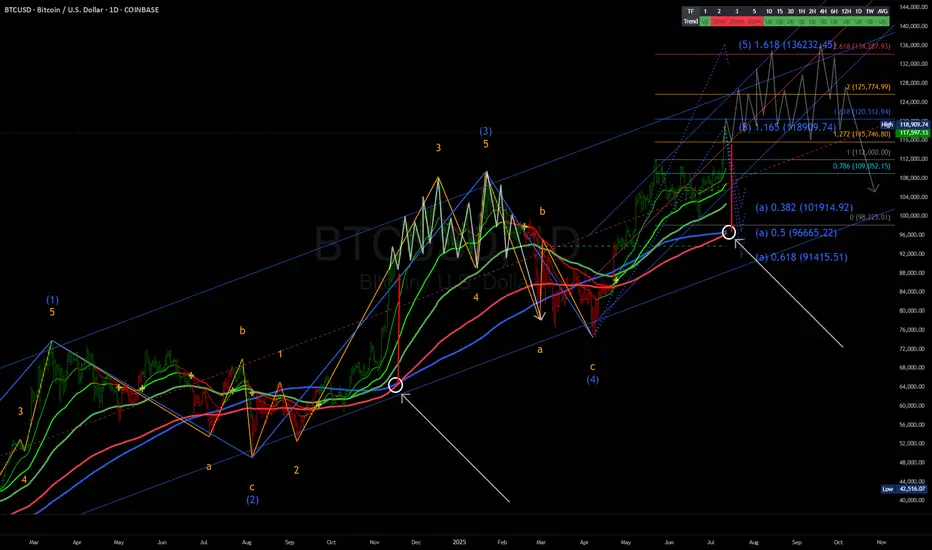
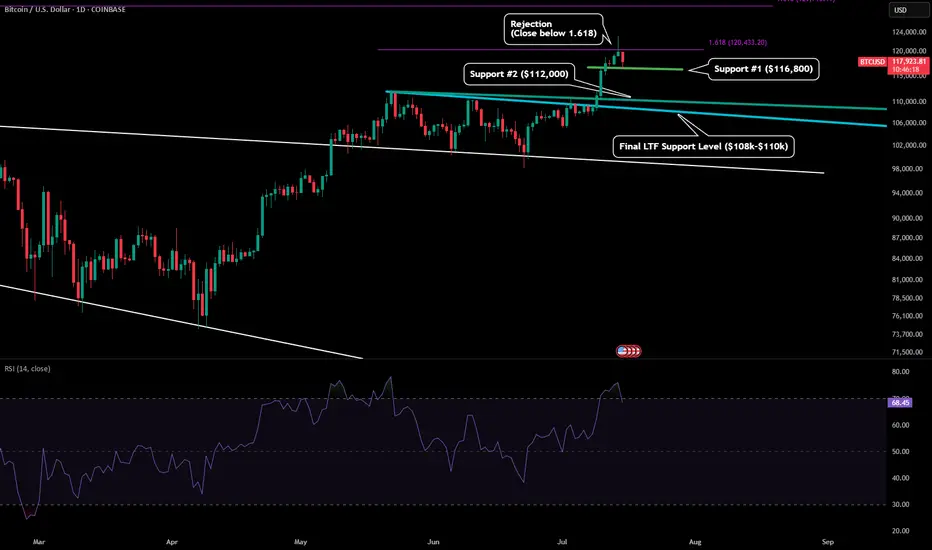
BTC - LTF Retracement TargetsPlease refer to our previous post:
After identifying our first target right around $120.4k we are seeing the first signs of a cooloff. Until we get a daily candle close above this level price is likely to flush some leverage. The main move to $140k area is still likely to happen, but if we see a retracement in the short term here are the LTF levels to watch.
Support level #1 has been established with most of the candle bodies around $116.8k. If we lose that level then price is likely to test our previous ATH.
Support level #2 would be a test of our previous ATH around $112k or our teal trendline that connects the wick tops.
The final support level would be our macro old ATH right around $108-$110k. There is also a trendline there (which depending on what time it could be tested) would also be right in line with those price targets.
Bitcoin has made a new high at $119, 444.
High: $119,444 – New swing high reached, showing +25.71% gain from the recent low.
Bullish Continuation/If the support holds, buyers are expected to step in and push price further above the recent high toward the next resistance range of $124K+.
BTC is clearly gearing up for its next big move.Could we see 120k next per the pattern unfolding before us?
It may not (or it could) happen now, but BTC definitely looking BULLISH!
Bitcoin Early, Not LateA simple graphic with all annotations included :
- Trend.
- Fibonnacci.
- Middle Line.
- Support and Bounces.
- Resistances and dips.
- Everyone gets Bitcoin at the price they deserve.
- Not a price Prediction, keep things simple.
Happy Tr4Ding !
BITCOIN 2025 - THE LAST HOPECRYPTOCAP:BTC currently finds itself at the intersection of geopolitical tensions and broader macroeconomic uncertainty. Although traditionally viewed as a hedge against systemic risk, it is presently exhibiting characteristics more aligned with high-risk assets. The FED's forthcoming policy decisions will likely play a pivotal role in determining whether Bitcoin stabilizes or experiences further downward pressure.
The chart represents the most optimistic scenario for Bitcoin to date
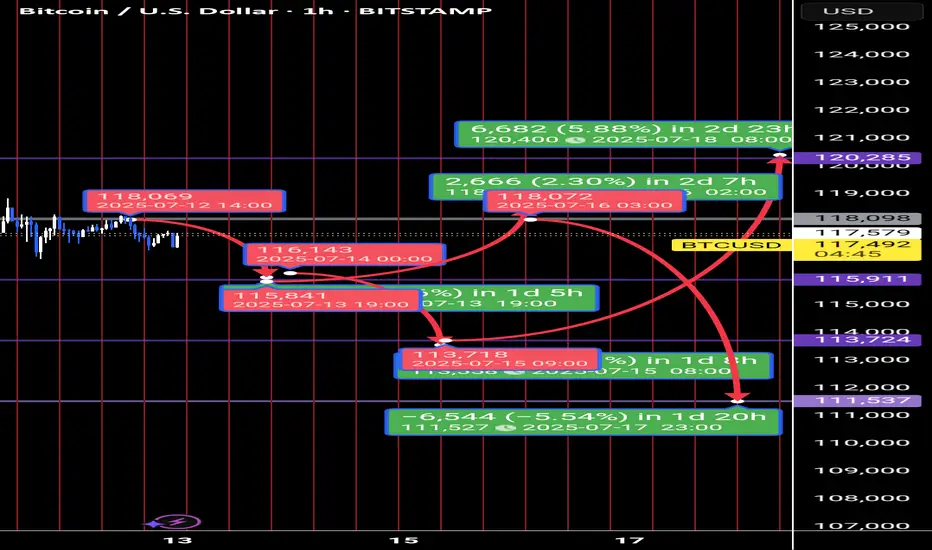
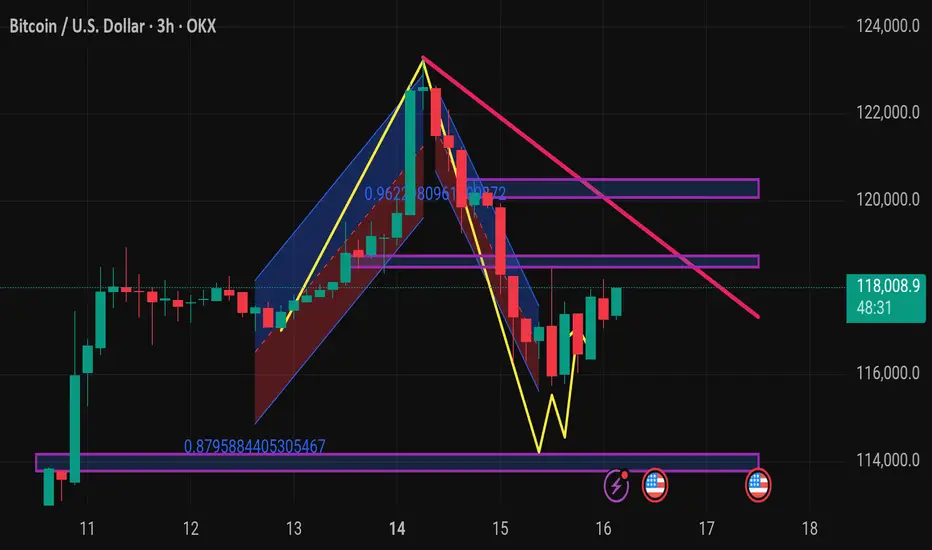
BTC Forecast: CPI Trap or Liquidity Sweep?Powered by Advanced Time-Price Analysis | Dr.Gemy | Digital Gann Strategy
Using Time Cycles, IPDA logic, and Digital Gann structure, the upcoming week for Bitcoin is setting up for a high-probability liquidity event, especially with high-impact macro data scheduled.
📍In the next 18 hours, we expect a short-term correction toward the 115,911 USD zone.
---
⏰ CPI (Tuesday) & PPI (Wednesday) = catalysts for smart money traps.
I expect a textbook liquidity hunt around the inflation data window.
Time is more important than price.
🔮 Two Critical Scenarios Unfolding:
✅ Scenario 1 – CPI Trap Setup (Tuesday News Play)
🕒 If BTC continues correcting into Tuesday (July 15), targeting 113,724 USD, this will align perfectly with the release of U.S. CPI (Inflation) data at 3:30 PM GMT+3.
📈 A fake bullish breakout above 118,098 USD could follow, luring retail traders with an inflation-driven spike, only to be reversed sharply to collect liquidity around 111,537 USD.
🧠 CPI y/y forecast is 2.6% vs 2.4% prior – higher inflation could spark temporary bullish reaction, but the underlying setup suggests it's a trap.
---
🎭 Scenario 2 – Smart Money Pump and Dump
📈 BTC might front-run expectations with an early week rally to retest 118,098 USD, only to reverse midweek (around Wednesday's PPI release) as the market reacts to deeper macro data and shifting dollar strength.
💣 Downside continuation could sweep below 113,724 USD, ultimately reaching the key demand base at 111,537 USD, which marks the beginning of the last major impulsive move.
---
🧠 Strategic Concepts Used:
Time Fractals (9H Cycle Lines)
Gann Reversal Timing & Breaker Blocks (H4)
Smart Money Traps around News
IPDA Voids & Liquidity Pools
CPI/PPI/Macro Liquidity Zones
#CryptoForecast #BTCUSD #CPIWeek #GannTiming #SmartMoney #LiquiditySweep #IPDA #ForexStyleCrypto #DigitalGann #DrGemy