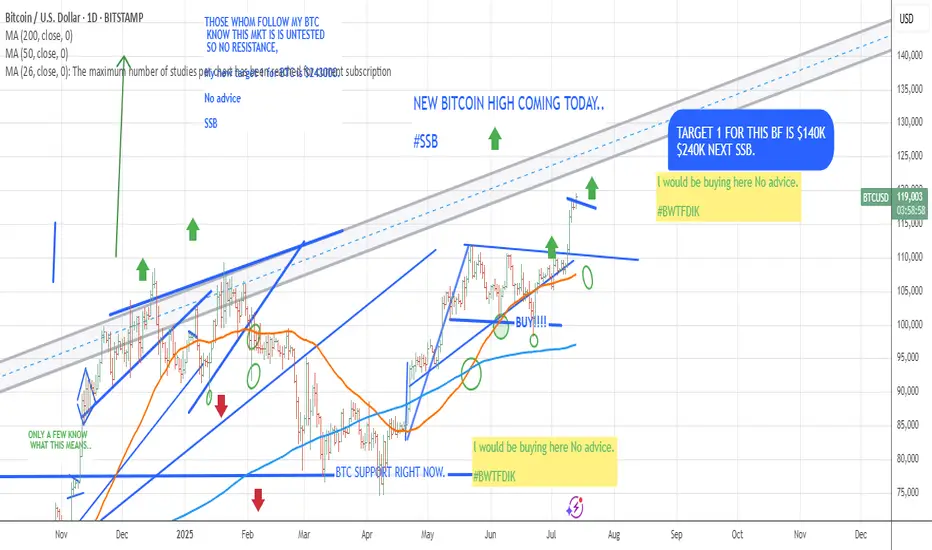
Bitcoin Wave AnalysisBase on Wave Analysis We see this Move For BitCoin
it seems bitcoin is near to finish the last bullish wave and will start for a big correction
BTCUSD.PM trade ideas
#BTC #BITCOIN $240K BITCOIN COMING PROBABLY WITHIN 3 MONTHS.
CHART speaks for itself for any following TA
BWTFDIK
SSB
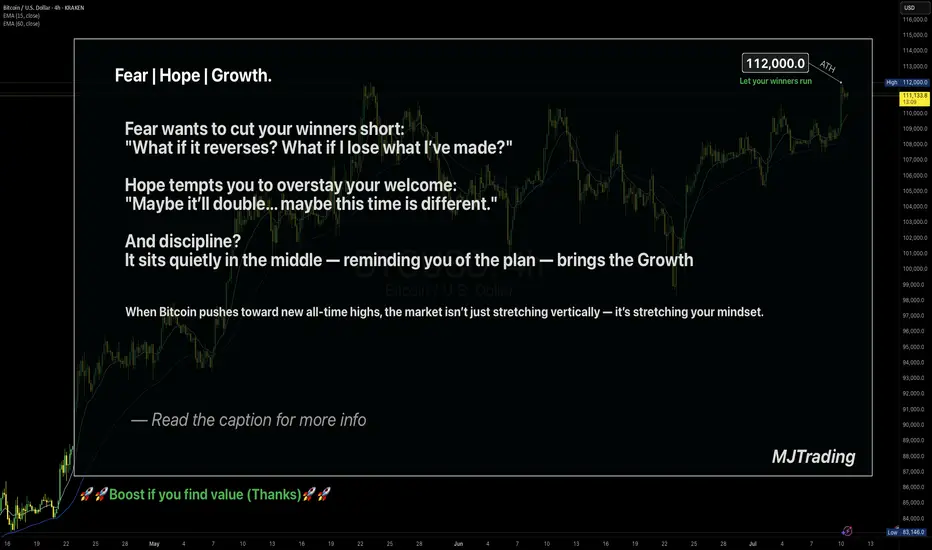
Let your winners run🧠 Fear | Hope | Growth – When Trading Meets Emotion
The message on the chart isn't just poetic — it's real psychology.
🔹 Fear wants to cut your winners short.
It sneaks in after a small move in your favor.
"What if it reverses? I better lock this in."
And just like that, a great trade turns into a missed opportunity.
🔹 Hope drags you into holding too long.
It dreams: "Maybe it doubles... maybe this time it'll be massive."
But it's not guided by data — it's driven by fantasy.
🔹 Discipline is what sits in the middle.
Quiet. Neutral.
It doesn’t scream or seduce — it just follows the plan.
And that’s where Growth lives — not just on the PnL, but in your psychology.
When Bitcoin pushes toward new ATHs, these emotions get amplified.
The real question becomes: Can you manage yourself, not just your trade?
📌 A Real Example from My Desk
In my earlier BTCUSD idea — “Another Edge – Decision Time” (shared above) —
I sent that setup to one of my managed clients.
He entered long exactly at the edge of the channel — a clean, strategic buy.
Price moved beautifully in our favor…
But he manually closed the trade at 106,600 — long before the move matured.
Why?
Because fear of giving back profit overwhelmed the original plan.
The chart was right. The timing was right.
But the exit was emotional, not tactical.
✅ The trade made money.
❌ But the lesson is clear: a profitable trade doesn’t always mean a disciplined one.
🎯 Final Takeaway:
“Fear kills your winners. Hope kills your timing. Discipline grows your equity and your character.”
🗣 What would you have done in that position?
Held longer? Closed at resistance? Let it run toward ATH?
Let’s talk psychology — drop your thoughts 👇
#MJTrading
#TradingPsychology #BTCUSD #FearHopeDiscipline #LetYourWinnersRun #PriceAction #BTCATH #ForexMindset #CryptoStrategy
Bitcoin Longer: Clear Blue Skies for Wave 3 of 5As I explained in this video, I believe that we are currently in a wave 3 of 5 for Bitcoin and we should be breaching new highs as we have an undergoing wave 3. However, take note that the risk-reward is not good to go long. So I would recommend holding if you already have a position but to be very cautious if you are thinking of initiating a new long position.
The stop loss is $109,700. The near-term take profit is $113,923 before a potential pull back and then up to $115,000.
Good luck!

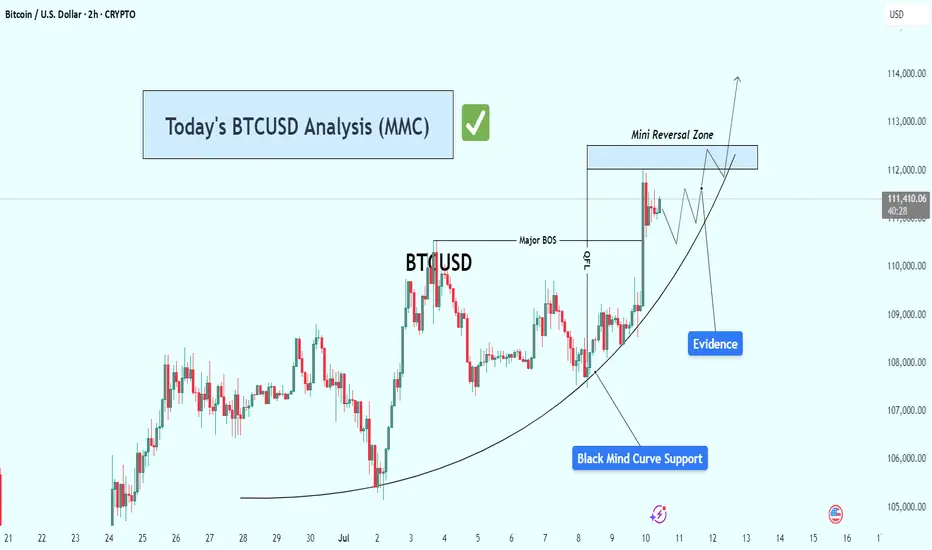
BTCUSD Analysis – Riding the Mind Curve & Bullish Setup Target🔎 Technical Narrative & Market Structure Analysis
Bitcoin is currently respecting a textbook parabolic support structure represented by the Black Mind Curve—a dynamic visual model reflecting the psychology of crowd behavior transitioning from uncertainty to confidence. This curved structure often precedes strong bullish continuation patterns, especially when paired with evidence of smart money involvement.
The current price action shows sequential higher lows, each of which is supported directly by the Mind Curve. These bounces confirm demand stepping in consistently at higher levels, a strong sign of controlled accumulation and momentum building.
🧠 Key Chart Components Explained
✅ 1. Mind Curve (Dynamic Support)
A custom-drawn parabolic curve reflects the ongoing upward force from buyers.
Bitcoin has tested and bounced from this curve multiple times, showing it is respected by market participants.
As price hugs the curve more tightly, the compression could lead to a volatility breakout.
✅ 2. Major BOS (Break of Structure)
A significant market structure break occurred as price took out a previous swing high.
This BOS confirms a shift in market sentiment from ranging/sideways to uptrend formation.
The BOS now acts as a reference point for bullish momentum and could serve as support on a potential retest.
✅ 3. QFL Zone (Quantity following line )
Located just below the BOS, this zone marks the last area where aggressive buyers stepped in before the breakout.
These levels are often defended on a retest and are used by institutional traders to re-enter positions.
✅ 4. Evidence Candle
This sharp bullish impulse candle is what we call an "evidence candle"—it pierces minor resistances with strength and volume.
It represents institutional-level interest and confirms smart money accumulation.
Such candles typically precede either continuation or minor pullback for re-accumulation.
✅ 5. Reversal Zone (Target Zone)
This zone lies ahead at approximately 112,500 to 113,000, a confluence of previous supply, key psychological level, and potential liquidity pool.
It's the next logical area where price may pause, react, or break through if momentum sustains.
⚔️ Scenarios to Watch
🟩 Bullish Scenario:
Price continues riding the curve support upward.
Breaks and closes above the Reversal Zone, ideally with volume and continuation candle.
Potential upside extension toward 114,000–115,000.
🟨 Neutral/Consolidation Scenario:
Price consolidates just below the Reversal Zone.
May form a flag/pennant or triangle structure.
Bullish continuation likely if the curve holds beneath.
🟥 Bearish/Invalidation Scenario:
Price breaks below the Mind Curve and BOS, closing below with momentum.
This would signal a potential breakdown of the bullish structure.
Invalidation zone likely sits below 110,000, and a breakdown could open room to revisit the 108,500–109,000 area.
📌 Confluence Factors Supporting the Bullish Bias:
Respect of Mind Curve over time = hidden institutional support
Presence of BOS and QFL = structure and order block confluence
Evidence candle = high-volume trigger point
Reversal Zone = logical magnet for price, supported by liquidity and previous reactions
📈 Summary & Trading Thesis
Bitcoin is currently in a bullish microstructure within a larger range. The parabola-style Mind Curve suggests that this structure is maturing toward an inflection point. The break above BOS, evidence of strength, and alignment with demand zones all support a move toward the 112,500–113,000 Reversal Zone. If momentum sustains, this could become the start of a broader bullish leg.
📢 Final Thought:
While the setup is bullish, discipline and patience are key. Watching how price behaves around the Reversal Zone will be critical. A clean breakout or solid rejection will provide the next high-probability signal.
XRP breaks out: 19% rally in sightXRP has just broken out of an inverse head and shoulders pattern, a classic bullish setup that points to a potential 19% rally. The breakout comes at a time when the US is expected to deliver key crypto regulation updates by July 22. If the legal outcome is positive, it could fuel further upside not only in XRP but across the broader crypto market. This setup offers a strong risk-to-reward profile, especially if Bitcoin also breaks out of its current rectangle pattern.
This content is not directed to residents of the EU or UK. Any opinions, news, research, analyses, prices or other information contained on this website is provided as general market commentary and does not constitute investment advice. ThinkMarkets will not accept liability for any loss or damage including, without limitation, to any loss of profit which may arise directly or indirectly from use of or reliance on such information.

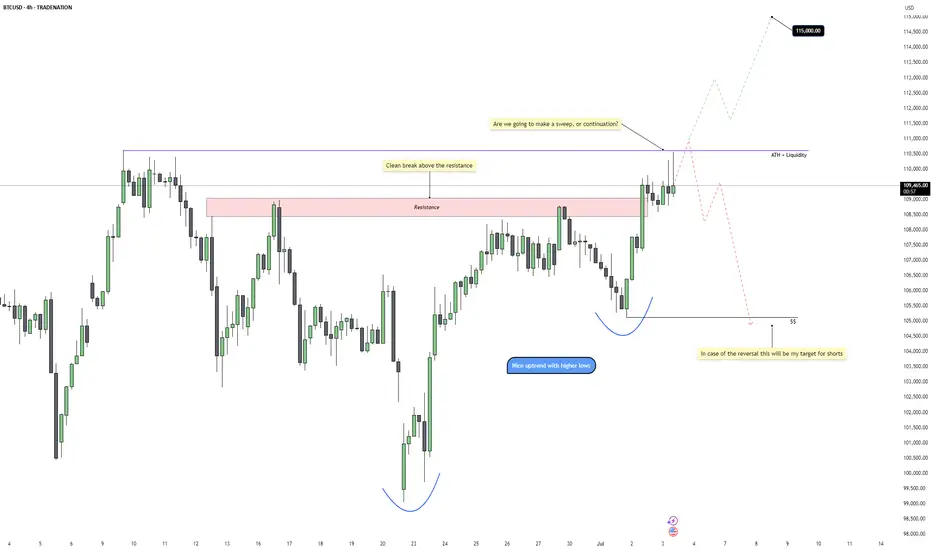
Bitcoin – ATH Sweep or Breakout?Bitcoin is pushing into a critical decision point as it challenges the previous all-time high near 110k. After a strong push out of a rounded bottom formation with clean higher lows, price has now broken above the last visible resistance area and is hovering just under the ATH liquidity. This rally has been aggressive, but the reaction here will determine whether this move becomes an extended breakout or a classic trap.
Liquidity and Key Resistance
The ATH zone around 110k carries a large pool of liquidity, and price is now testing it for the first time since the breakout. We’ve already had a clean break above the prior resistance zone, but we haven’t yet seen a confirmed close above ATH with convincing volume. If price manages to close strongly above this level on the 4H or daily chart, that would be a sign that bulls are in full control. Until then, the possibility of a sweep and rejection remains firmly on the table.
Sweep Scenario and Downside Levels
If we fail to close convincingly above the ATH and instead see a wick through followed by a strong reversal, that would confirm the sweep. In that case, I’d expect short setups to activate quickly, with downside targets sitting around 105k. This level marks the structure support below the most recent breakout, and would be a logical point for price to rebalance before continuing any broader uptrend. A rejection from current levels would also trap late longs and provide fuel for a quick retracement.
Bullish Breakout Scenario
If we do get that proper breakout above 110k, backed by strong volume and continuation candles, the upside opens fast. There’s very little structure above the ATH, so price could move cleanly up into the next round psychological target around 115k. This move would confirm continuation of the higher timeframe trend and offer short-term breakout retests for potential long re-entries.
Volume and Candle Confirmation Are Crucial
At this stage, the setup is binary and all about confirmation. A clean 4H or daily close above ATH with follow-through volume will flip the bias fully bullish. But if we get signs of exhaustion and a failed breakout attempt, the sweep setup becomes highly probable. Waiting for confirmation here is key, rather than trying to front-run the move.
Conclusion
Bitcoin is sitting right at a high-stakes level. We either continue into price discovery toward 115k if momentum follows through, or we see a classic liquidity sweep and rejection back into 105k. The clean structure and recent higher lows support both sides of the argument, but execution will depend on how price reacts around the ATH. Either way, this zone is the key pivot for the next major swing.
Disclosure: I am part of Trade Nation's Influencer program and receive a monthly fee for using their TradingView charts in my analysis.
___________________________________
Thanks for your support!
If you found this idea helpful or learned something new, drop a like 👍 and leave a comment, I’d love to hear your thoughts! 🚀
Triangle, Flag, or Wedge? How to Trade These Chart PatternsWhat is the real difference between an ascending triangle, bull flag, and wedge? We break down these common patterns using real examples from gold and Bitcoin, explain why trendlines can be tricky, and discuss what actually matters when trading these setups.
This content is not directed to residents of the EU or UK. Any opinions, news, research, analyses, prices or other information contained on this website is provided as general market commentary and does not constitute investment advice. ThinkMarkets will not accept liability for any loss or damage including, without limitation, to any loss of profit which may arise directly or indirectly from use of or reliance on such information.

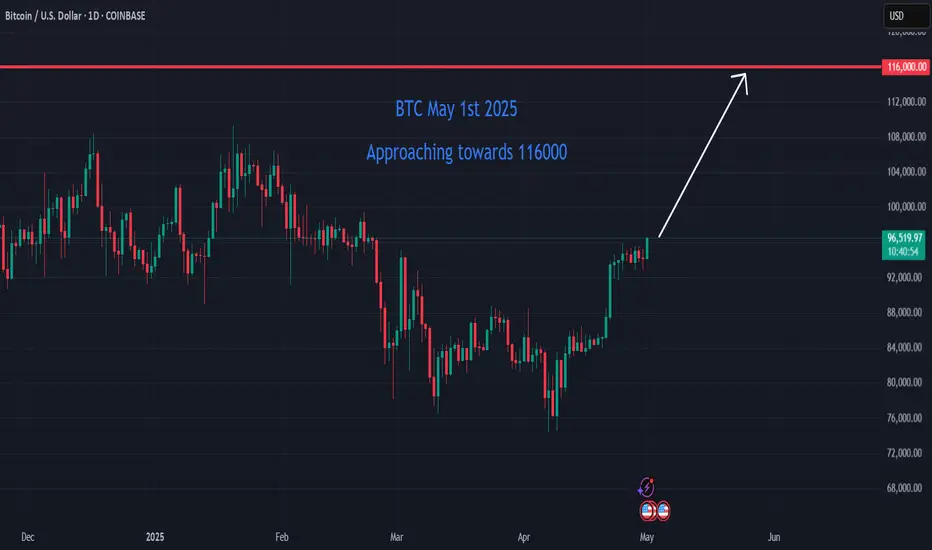
Bitcoin on the Brink: Short-Term Surge Toward $116K Bitcoin (BTC) is currently trading at approximately $96,390, approaching the $116,000 mark. Here's a short-term analysis using Cycle Analysis, Elliott Wave Theory, and Gann Analysis to inform potential trading strategies.
________________________________________
📈 Cycle Analysis: Mid-2025 Surge
Historical patterns suggest that Bitcoin tends to reach its peak between 518 and 546 days after a halving event. Given the most recent halving in April 2024, analysts anticipate a potential price peak around mid-2025, approximately 1.5 years post-halving. Notably, Bitcoin is currently about 35 days ahead of its typical cycle, indicating a possible acceleration in price growth.
________________________________________
📊 Elliott Wave Analysis: Wave 3 in Progress
Elliott Wave Theory suggests that Bitcoin is currently in the third wave of its bullish cycle, which is typically the most powerful and extended wave. Recent analyses indicate that the third wave is unfolding, with potential targets ranging from $114,500 to $120,500. A conservative estimate places the peak of this wave between $127,000 and $150,000
________________________________________
📐 Gann Analysis: Price-Time Equilibrium
Gann Analysis utilizes geometric angles to predict price movements. The "2×1 Fan" line, representing a 45-degree angle, is considered a fair value line. Historically, Bitcoin's price has peaked near this line during parabolic run-ups. Currently, Bitcoin's price is approaching this level, suggesting a potential peak.
________________________________________
🧭 Short-Term Trade Setup
✅ Entry Points:
• Accumulation Zone: $85,000 to $90,000
• Current Price: $96,390
🎯 Target Levels:
• Short-Term Peak: $116,000 to $135,000
• Medium-Term Peak: $150,000
⚠️ Risk Management:
• Potential Correction: After reaching the peak, anticipate a significant pullback, possibly 30–50%.
• Exit Strategy: Consider taking profits as Bitcoin approaches upper resistance zones.
________________________________________
🧾 Conclusion
Bitcoin is in the final stages of its current bullish cycle, with projections indicating a potential peak between $150,000 and $278,000. However, caution is warranted as market corrections are typical following such surges. Investors should consider taking profits as Bitcoin approaches upper resistance levels and prepare for potential pullbacks.
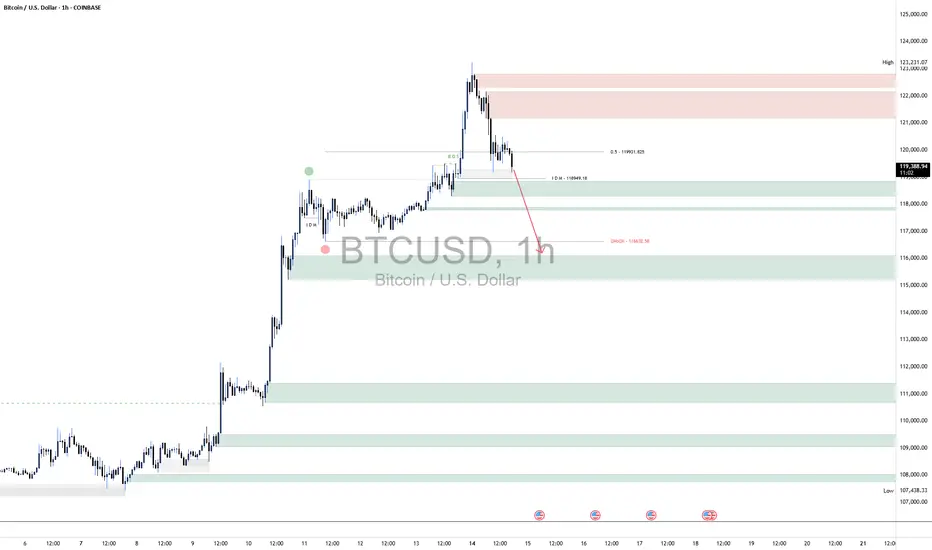
BTC ShortBTC’s 1‑hour structure is showing clear signs of weakness following rejection from the premium supply zone between 122 000 and 123 200. After sweeping equal highs and tapping into the 50 % internal retracement level around 119 900, price sold off sharply, breaking below the intraday demand at ~119 000. This shift in market structure signals bearish intent in the short term.
The strong rejection, combined with increased sell-side volume, indicates that the rally was more likely a liquidity grab than true bullish strength. As a result, BTC is now expected to continue lower toward the 117 000 level to clear resting liquidity beneath recent lows. This level aligns with the previous CHOCH (Change of Character) and is a key liquidity pocket.
Once BTC grabs the liquidity below 117 000, we anticipate a potential bullish reaction and reversal, as smart money may use this area to re-accumulate and drive price higher.
However, until that liquidity is collected, the bias remains bearish in the short term. As always, proper risk management is essential—define your invalidation clearly and manage position size responsibly to protect capital in this volatile environment.
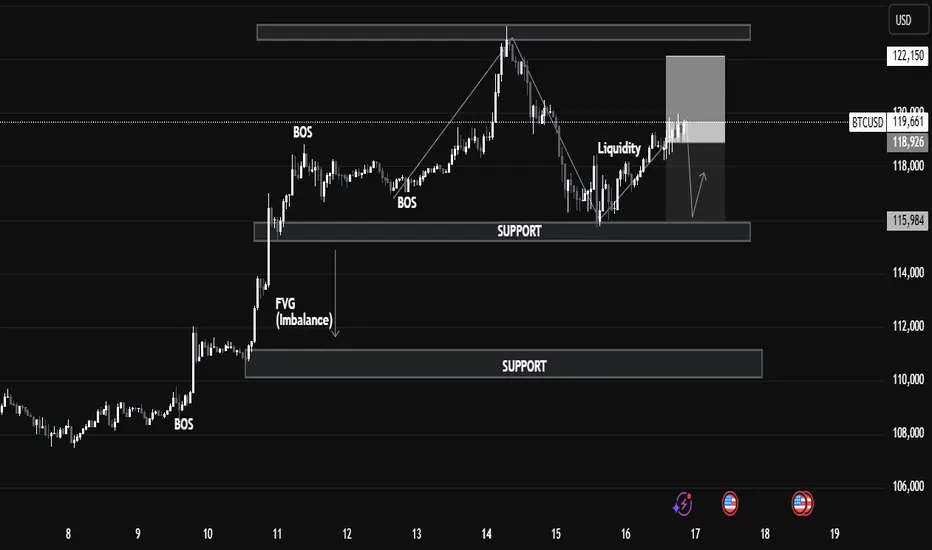
BTCUSD - Smart Money Trap Before the Next Move?1. Market Structure & BOS (Break of Structure):
We can observe multiple BOS levels around July 10–12, signaling a strong bullish transition.
2. Break of Structure (BOS)
Definition: BOS occurs when price breaks above a previous swing high with conviction.
Application on Chart: The BOS on July 11 marked the continuation of bullish market structure.
This indicated strong buying pressure, often driven by institutional order flow.
📉 3. Fair Value Gap (FVG)
Definition: A Fair Value Gap is an inefficiency or imbalance in the market where price moves too quickly, skipping potential orders.
On Chart: The FVG is present between July 11–12.
Expectation: Price often returns to these zones to “rebalance” or mitigate orders before continuing the trend.
Educational Note: FVGs act as magnet zones and are often used to identify entry points or liquidity pools.
💧 4. Liquidity Sweep
Definition: A liquidity grab occurs when price spikes above a recent high or low to trigger stop-loss orders before reversing.
On Chart: Just above resistance, a liquidity grab took place.
Purpose: Institutions often sweep liquidity before large moves to fill larger orders.
🔹 Resistance & Supply Zone:
The resistance area between 122,150–123,500 has held firmly, causing a notable correction.
This region aligns with institutional order blocks, suggesting potential smart money selling.
🔹 Support & Demand Zone:
The nearest support zone lies at 115,984, marked by previous consolidation and BOS.
Price is likely to revisit this zone, acting as a retest for demand re-entry, providing a strong buy-side opportunity if confirmed.
🔹 Current Price Action:
BTC is consolidating around 119,253, with a possible liquidity sweep above short-term highs.
BTC Touching Heights !BTC Extremely bullish. BTC analysis shows that it touch supply zone of 107500 and later went to cross the day before previous day high which was residing on 109,684 and then swept previous week high which was 110,600 with strong buying. It hinted crossing the all time high. After crossing all time high of 111,900 gave a change of around 6000 dollars , At this position the BTC outlook shows it may show reversal of around 4K dollars change. The possibilities for the BTC are shown here. Take risk accordingly.
Disclaimer : It isn't a financial advice check my analysis and decide on your own.
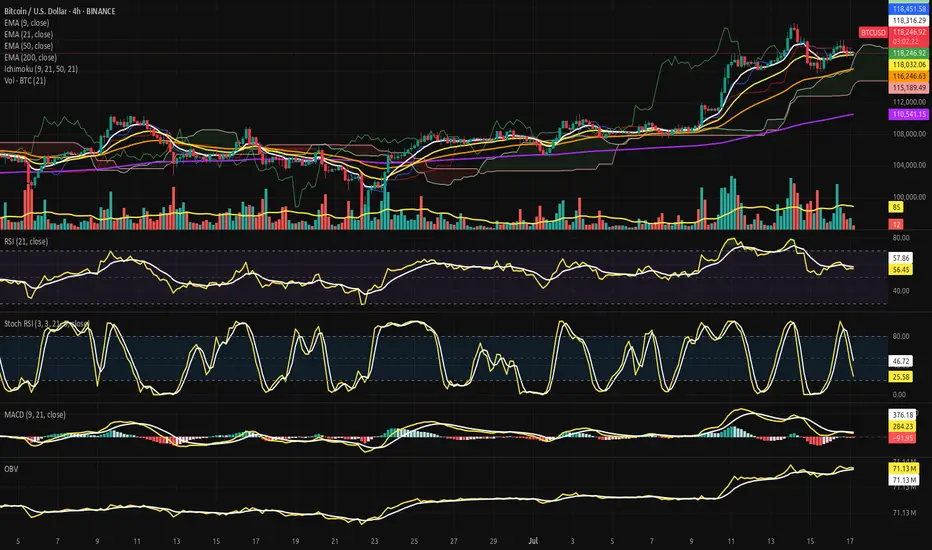
Bitcoin Strategic Compression Beneath the Cloud Gate.⊣
⟁ BTC/USD - BINANCE - (CHART: 4H) - (July 17, 2025).
◇ Analysis Price: $118,099.62.
⊣
⨀ I. Temporal Axis - Strategic Interval – (4H):
▦ EMA9 - (Exponential Moving Average - 9 Close):
∴ EMA9 is currently positioned at $118,286.83, marginally above the current price of $118,099.62;
∴ The slope of the EMA9 has begun to turn sideways-to-downward, indicating loss of short-term acceleration;
∴ The price has crossed below EMA9 within the last two candles, suggesting an incipient rejection of immediate bullish continuation.
✴️ Conclusion: Short-term momentum has weakened, positioning EMA 9 as immediate dynamic resistance.
⊢
▦ EMA21 - (Exponential Moving Average - 21 Close):
∴ EMA21 is measured at $118,018.67, positioned slightly below both price and EMA9, indicating a recent tightening of trend structure;
∴ The slope of EMA21 remains positive, preserving the medium-range bullish structure intact;
∴ EMA21 has been tested multiple times and held as support since July 15 - confirming tactical reliability as dynamic floor.
✴️ Conclusion: EMA21 stands as a critical pivot zone; any sustained breach would denote structural stress.
⊢
▦ EMA50 - (Exponential Moving Average - 50 Close):
∴ EMA50 is currently located at $116,240.85, well below current price action;
∴ The curve maintains a healthy positive inclination, affirming preservation of broader intermediate trend;
∴ No contact or proximity to EMA50 over the last 20 candles - indicating strong bullish detachment and buffer zone integrity.
✴️ Conclusion: EMA50 confirms medium-term bullish alignment; not yet challenged.
⊢
▦ EMA200 - (Exponential Moving Average - 200 Close):
∴ EMA200 stands at $110,539.69, forming the base of the entire 4H structure;
∴ The gradient is gradually rising, reflecting accumulation over a long time horizon;
∴ The distance between price and EMA200 reflects extended bullish positioning, yet also opens risk for sharp reversion if acceleration collapses.
✴️ Conclusion: Long-term structure remains bullish; early signs of overextension exist.
⊢
▦ Ichimoku Cloud - (9, 21, 50, 21):
∴ Price is currently above the Kumo (cloud), placing the pair within a bullish regime;
∴ Tenkan-sen (conversion) and Kijun-sen (base) lines show narrowing separation, suggesting momentum compression;
∴ Senkou Span A > Span B, and the cloud ahead is bullishly twisted, though thinning - indicating potential vulnerability despite structural advantage.
✴️ Conclusion: Bullish regime intact, but loss of momentum and cloud compression warrant caution.
⊢
▦ Volume + EMA21:
∴ Current volume for the latest candle is 3 BTC, compared to the EMA21 of 84 BTC;
∴ This indicates an extremely low participation phase, often associated with distribution zones or indecisive consolidation;
∴ Previous impulsive candles (July 15) reached well above 100 BTC - the current contraction is stark and strategically significant.
✴️ Conclusion: Absence of volume threatens trend continuation; energy depletion apparent.
⊢
▦ RSI - (21) + EMA9:
∴ RSI (21) is positioned at 55.73, marginally above neutral zone;
∴ EMA 9 of RSI is 57.71, crossing downward against RSI - bearish micro signal;
∴ No divergence is present versus price action - oscillator confirms current stagnation rather than exhaustion.
✴️ Conclusion: RSI losing strength above neutral; lacks momentum for breakout, but no capitulation.
⊢
▦ Stoch RSI - (3,3,21,9):
∴ %K is 21.44, %D is 45.34 - both pointing downward, in deacceleration phase;
∴ Recent rejection from overbought zone without full reset into oversold - signaling weak bullish thrust;
∴ Historical cycles show rhythmical reversals near current levels, but only with supportive volume, which is absent now.
✴️ Conclusion: Short-term momentum failed to sustain overbought breakout - micro-correction expected.
⊢
▦ MACD - (9, 21):
∴ MACD line is at -104.80, Signal line at 268.16 - large separation, histogram deeply negative;
∴ The bearish crossover occurred with declining volume, implying fading momentum rather than aggressive sell-off;
∴ No bullish divergence formed yet - continuation of correction remains technically favored.
✴️ Conclusion: MACD confirms trend exhaustion; no reversal in sight.
⊢
▦ OBV + EMA 9:
∴ OBV is 71.13M, perfectly aligned with its EMA9 - indicating equilibrium in volume flow;
∴ No directional bias in accumulation or distribution - flatlining suggests passive environment;
∴ Prior OBV uptrend has stalled since July 15 - reinforcing narrative of hesitation.
✴️ Conclusion: Institutional flow is neutral; no aggressive positioning detected.
⊢
🜎 Strategic Insight - Technical Oracle: The current price structure presents a classic post-impulse compression configuration within a preserved bullish environment. Despite the higher timeframe alignment, multiple short-term indicators exhibit tactical dissonance and signs of momentum decay. This inconsistency reflects a market caught between structural optimism and tactical hesitation.
♘ Key strategic signals - Structural Alignment:
∴ All major EMA's (9, 21, 50, 200) remain stacked in bullish order with no bearish crossovers imminent;
∴ Price remains above the Ichimoku Cloud and above EMA50 - both confirming structural dominance by buyers.
♘ Momentum Degradation:
∴ RSI (21) is drifting below its EMA9, weakening the momentum required for further upside continuation;
∴ Stochastic RSI has rolled over aggressively, failing to reach oversold before reversing - mid-cycle weakness is confirmed.
♘ Volume Collapse:
∴ The current volume profile is critically weak - 3 Bitcoin against an average of 84 Bitcoins (EMA21);
∴ Price attempting to sustain above EMA's with no conviction signals distribution or passivity.
♘ MACD & OBV:
∴ MACD histogram remains deep in negative territory, and no bullish crossover is visible;
∴ OBV is flat - neither accumulation nor distribution dominates, leaving directional thrust suspended.
✴️ Oracle Insight:
∴ The technical field is Structurally Bullish, but Tactically Compressed.
∴ No breakout should be expected unless volume decisively returns above baseline (84 Bitcoins EMA);
∴ Below $117,800, the structure risks transition into a corrective phase;
∴ Above $118,450, potential trigger zone for bullish extension if accompanied by volume surge.
♘ Strategic posture:
∴ Wait-and-observe regime activated;
∴ No entry condition satisfies both structure and momentum at present;
∴ Tactical neutrality is advised until confirmation.
⊢
∫ II. On-Chain Intelligence - (Source: CryptoQuant):
▦ Exchange Reserve - (All Exchanges):
∴ The total Bitcoin reserves held on all exchanges continue a sharp and uninterrupted decline, now at ~2.4M BTC, down from over 3.4M in mid-2022;
∴ This downtrend has accelerated particularly after January 2025, with a visible drop into new lows - no accumulation rebound observed;
∴ Historically, every prolonged depletion of exchange reserves correlates with structural bullish setups, as supply becomes increasingly illiquid.
✴️ Conclusion: On-chain supply is structurally diminishing, confirming long-term bullish regime intact - mirrors technical EMA alignment.
⊢
▦ Fund Flow Ratio - (All Exchanges):
∴ Current Fund Flow Ratio stands at 0.114, which is well below historical danger thresholds seen near 0.20-0.25 during local tops;
∴ The ratio has remained consistently low throughout the 2025 uptrend, indicating that on-chain activity is not directed toward exchange-based selling;
∴ Spikes in this indicator tend to precede local corrections - but no such spike is currently present, reinforcing the notion of non-threatening capital flow.
✴️ Conclusion: Capital is not rotating into exchanges for liquidation - volume weakness seen in 4H chart is not linked to sell intent.
⊢
▦ Miners' Position Index - (MPI):
∴ The MPI sits firmly below the red threshold of 2.0, and currently ranges in sub-neutral levels (~0.5 and below);
∴ This suggests that miners are not engaging in aggressive distribution, and are likely retaining Bitcoin off-exchange;
∴ Sustained low MPI readings during price advances confirm alignment with institutional and long-term accumulation behavior.
✴️ Conclusion: Miner behavior supports structural strength - no mining-induced supply pressure present at this stage.
⊢
🜎 Strategic Insight - On-Chain Oracle:
∴ Across the three strategic indicators, no on-chain evidence supports short-term weakness;
∴ Supply is declining - (Exchange Reserve ↓);
∴ Funds are not preparing for exit - (Flow Ratio stable);
∴ Miners are not selling - (MPI subdued).
✴️ This constellation reinforces the thesis of Structural Bullishness with Tactical Compression, and suggests that any pullback is not backed by foundational stress.
⊢
𓂀 Stoic-Structural Interpretation:
∴ The multi-timeframe EMA stack remains intact and aligned - (9 > 21 > 50 > 200);
∴ Price floats above Ichimoku Cloud, and above EMA21 support, confirming elevated positioning within a macro bull channel;
∴ On-chain metrics confirm supply contraction, miner retention, and absence of fund rotation toward exchanges - structure remains sovereign;
∴ RSI - (21) slips under its EMA9 with low amplitude, indicating absence of energetic flow;
∴ Stoch RSI fails to reset fully and points downward - suggesting premature momentum decay;
∴ MACD histogram remains negative, while volume is significantly beneath EMA baseline (3 BTC vs 84 BTC);
∴ Price faces resistance at Kijun-sen ($118.451), acting as tactical ceiling; no breakout signal detected.
⊢
✴️ Interpretatio Finalis:
∴ Structural integrity remains unshaken - the architecture is bullish;
∴ Tactically, however, the battlefield is fogged - silence reigns in volume, hesitation in oscillators;
∴ A true continuation requires volume resurrection and resolution above $118,450. Until then, neutrality governs the edge.
⊢
⧉
Cryptorvm Dominvs · ⚜️ MAGISTER ARCANVM ⚜️ · Vox Primordialis
⌬ - Wisdom begins in silence. Precision unfolds in strategy - ⌬
⧉
⊢
BTUUSD ASIAN HIGH/LOW LIQUIDITY PURGESweeps often happen early in the London session
Price reverses back inside the range or moves strongly in opposite direction.
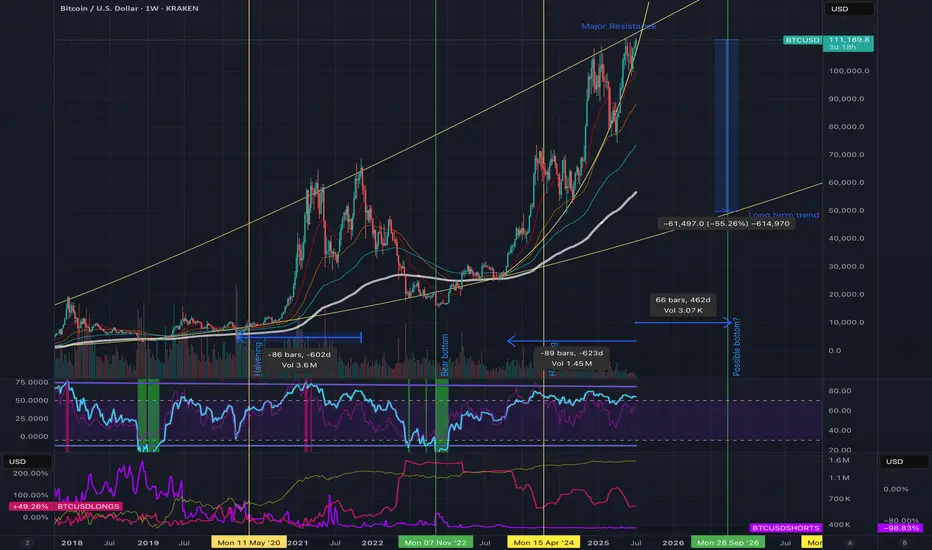
End in sight, Bull run near complete, don't be fooled. Bitcoin has experienced an incredible surge, rising from $15,000 to over $111,000 in this bull cycle so far. I expect the market peak to be around $114,000 to $115,000, with historical trends indicating strong resistance at these levels. As a long-term Bitcoin bull who has navigated through multiple cycles, I see several indicators suggesting we might be nearing a market top.
Firstly, this bull run has lasted 623 days, with only 462 days remaining until the predicted next cycle bottom. This could lead to a significant correction in the short term, potentially dropping prices by at least 50% down to below $40,000. Additionally, trading volume is declining; although exchange volume is decreasing, the number of trades per day is also dwindling. This means there’s less buying and selling pressure in the market. If this trend shifts to more selling pressure amidst such low volume, we could see a rapid decline. This scenario seems to align with what market whales may be anticipating.
MicroStrategy (MSTR) is certainly supporting the market, along with new institutional investors. However, we have yet to fully assess the impact of tariffs and other economic factors, which could result in fewer people willing to invest, especially in high-risk markets.
The Net Unrealized Profit/Loss (NUPL) has been high, remaining above 66 since March 2024, which also suggests that a correction is due, as many holders are currently in profit. Although institutional investment has been steadily increasing, we are now observing a plateau in the Accumulation/Ddistribution chart. The number of BTC long positions is decreasing, while shorts remain very low, indicating a lack of confidence that Bitcoin will rise significantly higher. This low interest in both longs and shorts suggests that market pressure could shift soon.
ETF inflows have remained stable, but profit-taking is likely to occur as investors seek to increase their positions in the bear market. While we all love Bitcoin and want the rally to continue, it's crucial to remember that a bear market will eventually happen, along with the next halving—it's just a matter of timing.
Looking at the charts, if anything signifies a market top more than “Laser Eyes,” it could very well be Trump coin. We might see another upward push, but history has shown that if everyone expects a massive rally in September or the fourth quarter, the opposite usually occurs; we end up buying the rumor and selling the news.
Safe trading, everyone! I remain a staunch Bitcoin bull, but I recognize that all good things must eventually come to an end and the next cycle will be so exciting, so make sure youe have the reserves to invest in the bear!
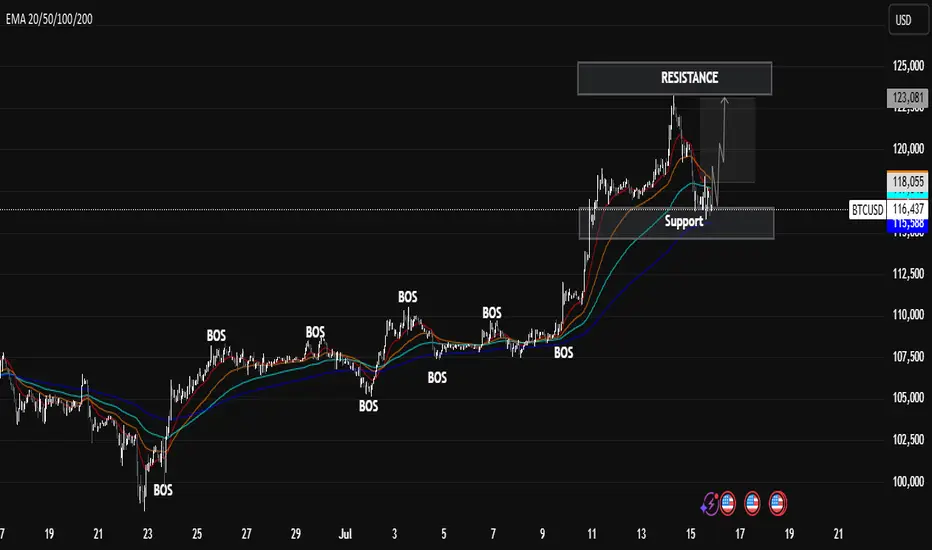
BTCUSD Technical Analysis – Break of Structure + SupportBTCUSD Technical Analysis – Break of Structure + Support/Resistance Strategy
🔍 Market Structure Insight
The chart clearly shows multiple Breaks of Structure (BOS) throughout the uptrend, indicating strong bullish momentum. Each BOS confirms a higher high formation and continued market strength.
📌 Key Zones
Resistance Zone: Price recently tested this level and faced rejection, indicating potential short-term selling pressure.
Support Zone: Price is currently retesting this level after a correction, showing signs of a possible bounce. It aligns well with the EMA support cluster (20–200 EMAs).
🔄 Current Price Action
After a significant impulse move to the upside, BTC is now in a corrective phase. However, the support zone is holding, and there's potential for a new bullish wave if price sustains above $115,000.
📈 Bullish Scenario
Price holds above support
EMA cluster continues to act as dynamic support
Break above $118,000 resistance could trigger the next rally toward $122,000+
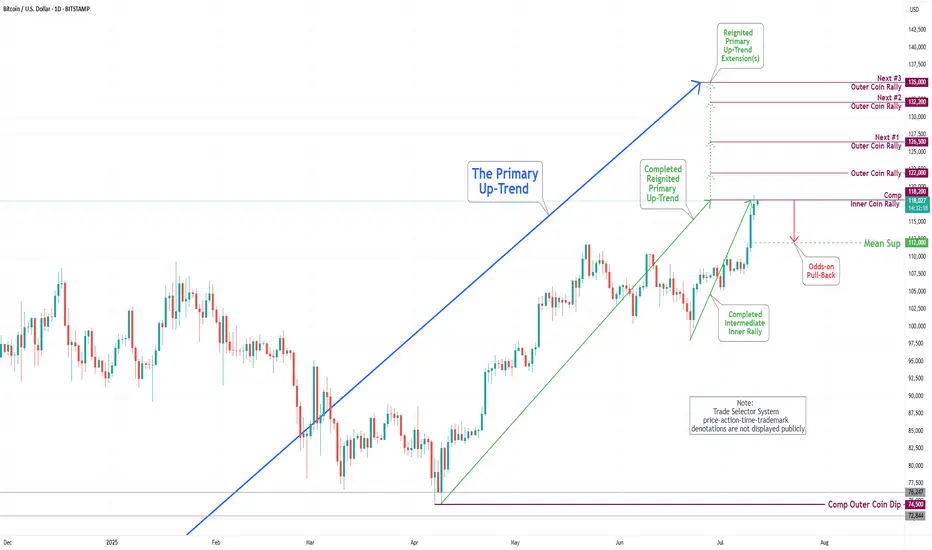
Bitcoin(BTC/USD) Daily Chart Analysis For Week of July 11, 2025Technical Analysis and Outlook:
In the last week's trading session, Bitcoin has demonstrated a significant surge, achieving historical prices as anticipated by TSS for an extended period. The cryptocurrency has successfully completed both the Outer Coin Rally 114500 and the Inner Coin Rally 118200. Presently, Bitcoin is poised to celebrate this notable accomplishment with a victory lap, but it may face a potential downward trajectory, targeting the Mean Support level of 112000. This anticipated decline will necessitate the resilience to a retest of Inner Coin Rally 118200. The designated targets for the Outer Coin Rally at this juncture are 122000, 126500, 132200, and 135000.
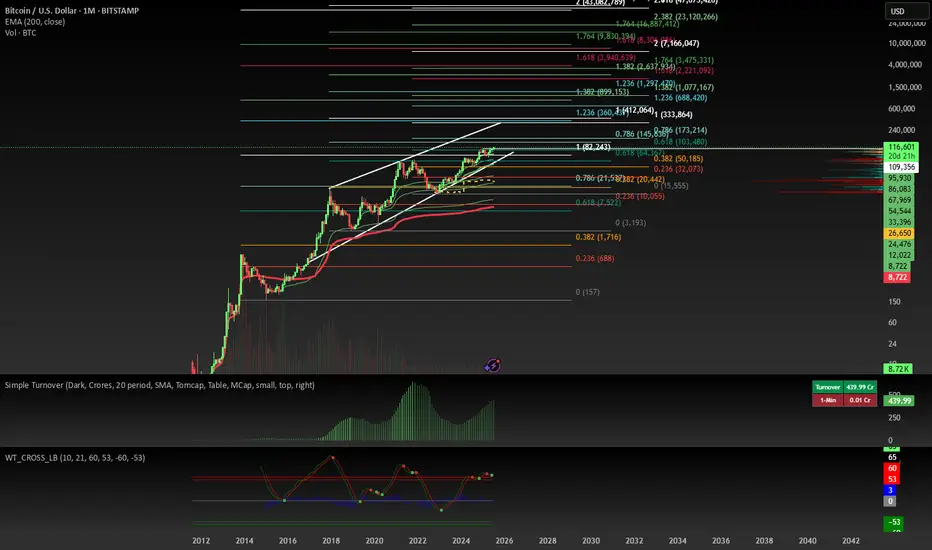
$BTC Will Hit Unimaginable Numbers :) Honestly not much to say the chart looks fantastic a lot of potential to the downside but from a Macro standpoint we could reach 150k in the coming months. Bitcoin will see extreme gains in the next 5 years. If you are not bullish I have news for you. you lost......
Short term I think we reach as far as 120k before a pull back. Only time will tell but these fib extensions do not lie. When you blow through the 1 fib ALWAYS AND I MEAN ALWAYS LOOK HIGHER. Obviously this is the monthly chart and will take year to play out. I do not expect much attention as I am a small trader but I will post occasional updates. In the mean time I will be buying large dips.
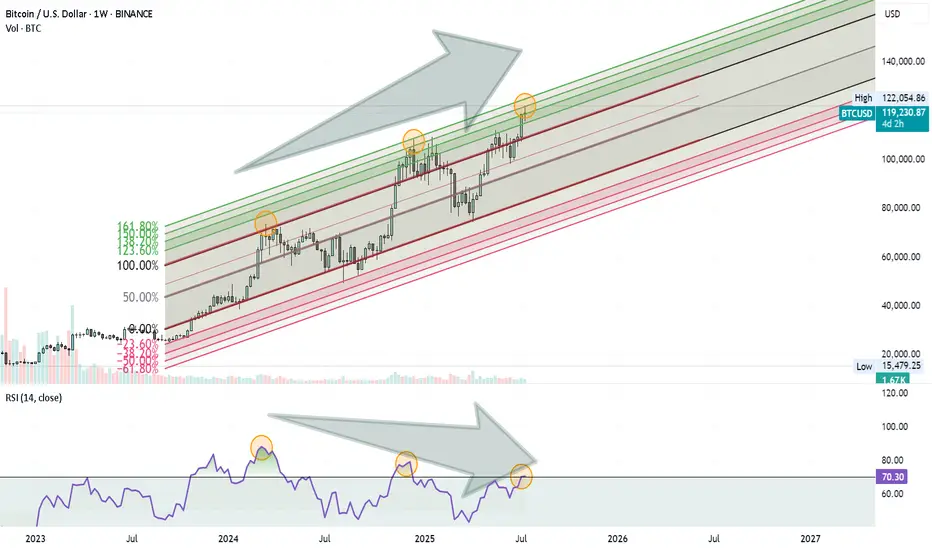
Bitcoin Rally Losing Steam?Bitcoin might be approaching a Turning Point . Here’s what I’m seeing on the weekly chart:
Price is moving inside an ascending Fibonacci channel.
It’s getting close to the 1.60 (160%) extension level, which has acted as a reversal zone before.
At the same time, the RSI is showing a clear negative divergence, suggesting that momentum is weakening.
These signs combined could mean we’re not far from a significant correction.
Nothing is confirmed yet, but it’s a setup worth keeping an eye on.
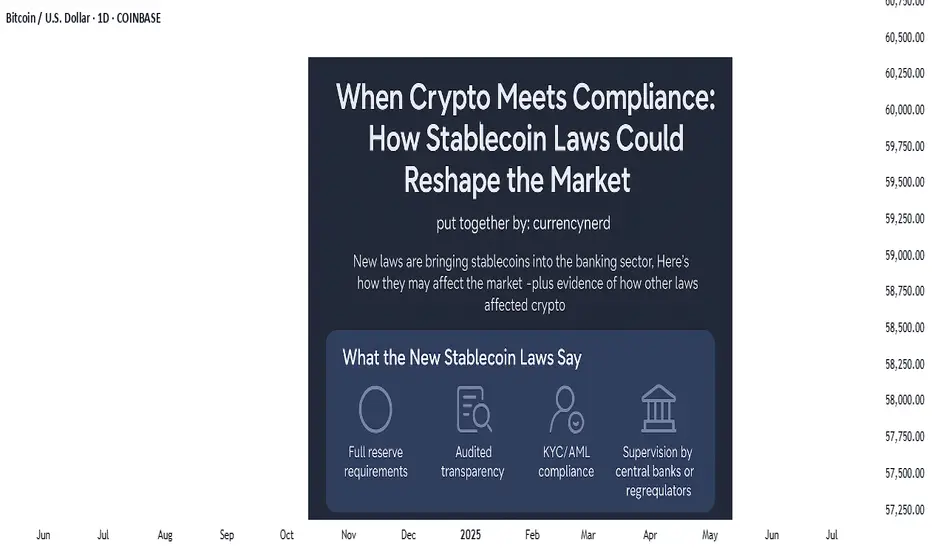
watch the laws, not just the charts.stablecoins were once the rebels of finance—anchored to fiat yet untethered from traditional banking laws, but the tides are turning. Across major economies, lawmakers are drawing up legal frameworks that place stablecoins inside the banking sector rather than outside of it. This shift could be the most pivotal regulatory development since Bitcoin was born.
But what does this really mean for traders, investors, and markets?
In this @TradingView blog we’ll unpack the new laws on stablecoins entering the banking realm, and what their ripple effect might look like, using past regulatory shifts as a lens to foresee market behavior.
🧾 Section 1: What the New Stablecoin Laws Say
Many regions—especially the EU, UK, Japan, and the US—are moving toward a model where stablecoin issuers must register as banks or hold full banking licenses, or at minimum, comply with banking-like oversight.
Key pillars of these laws include:
Full reserve requirements (1:1 backing in liquid assets)
Audited transparency on reserves and redemptions
KYC/AML compliance for users and issuers
Supervision by central banks or financial regulators
In the US, the House Financial Services Committee recently advanced a bill that would make the Fed the ultimate overseer of dollar-backed stablecoins.
In the EU, MiCA (Markets in Crypto-Assets) requires issuers of e-money tokens to be regulated financial institutions.
Japan now allows banks and trust companies to issue stablecoins under strict regulations.
💥 Section 2: Why This Is a Big Deal
Bringing stablecoins into the banking system could change how liquidity flows, how DeFi operates, and how capital moves across borders.
Potential market impacts:
Increased trust = more institutional money entering stablecoins and crypto markets.
DeFi restrictions = protocols may face scrutiny if they allow unverified stablecoin usage.
Flight from algorithmic or offshore stables to regulated, bank-issued stablecoins (e.g., USDC, PYUSD).
On-chain surveillance increases, potentially limiting pseudonymous finance.
Think of it as crypto’s "Too Big To Ignore" moment—where stablecoins become infrastructure, not outlaws.
📉 Section 3: Past Laws That Shaped Crypto Markets
Let’s examine how previous regulations have affected crypto markets—offering clues about what to expect.
🧱 1. China’s Crypto Ban (2017–2021)
Kicked off a massive market crash in 2018.
Pushed mining and trading activity overseas, especially to the US and Southeast Asia.
Resulted in more global decentralization, ironically strengthening Bitcoin’s resilience.
🪙 2. SEC Lawsuits Against XRP & ICO Projects
Ripple’s XRP lawsuit caused delistings and volatility.
Set a precedent for how tokens are treated under securities law.
Resulted in more structured token launches (via SAFEs, Reg D, etc.).
🧮 3. MiCA Regulation in Europe (2023 Onward)
Provided regulatory clarity, prompting institutions to engage more with regulated entities.
Boosted legitimacy of Euro-backed stablecoins like EURS and Circle’s Euro Coin.
Sparked a race among exchanges to gain EU registration (e.g., Binance France, Coinbase Ireland).
Each of these regulatory waves caused temporary volatility, followed by long-term growth—as clarity invited capital.
📊 Section 4: The Possible Scenarios for the Market
Here’s how things might play out as stablecoin laws become mainstream:
Golden Path-Regulated stablecoins coexist with DeFi; innovation meets compliance - Bullish for crypto adoption and capital inflows.
Walled Garden-Only bank-issued stablecoins are allowed; DeFi stifled -Neutral or bearish short-term, bullish long-term.
Backlash-Overregulation pushes stables offshore or into non-compliant zones - Bearish, liquidity fragmentation returns.
🔍 Nerdy Conclusion:
Stablecoins are no longer just tools for traders—they’re becoming the backbone of digital finance. Their formal entrance into banking law marks a turning point that traders must understand.
While regulation has historically caused short-term fear, it often leads to long-term maturity in crypto markets. The stablecoin laws now in motion could unlock the next chapter of institutional adoption, cross-border finance, and perhaps, the integration of crypto into the real-world economy at scale.
💡 Nerdy Thought:
When a technology becomes systemically important, it stops being ignored—it gets integrated. Stablecoins have reached that level.
put together by : @currencynerd as Pako Phutietsile
BTCUSD 7/16/2025Come Tap into the mind of SnipeGoat, as he gives you a Full Top-Down Analysis with a Deep Dive Down into the 30min Timeframe. This is One you don't want to miss.
_SnipeGoat_
_TheeCandleReadingGURU_
#PriceAction #MarketStructure #TechnicalAnalysis #Bearish #Bullish #Bitcoin #Crypto #BTCUSD #Forex #NakedChartReader #ZEROindicators #PreciseLevels #ProperTiming #PerfectDirection #ScalpingTrader #IntradayTrader #DayTrader #SwingTrader #PositionalTrader #HighLevelTrader #MambaMentality #GodMode #UltraInstinct #TheeBibleStrategy

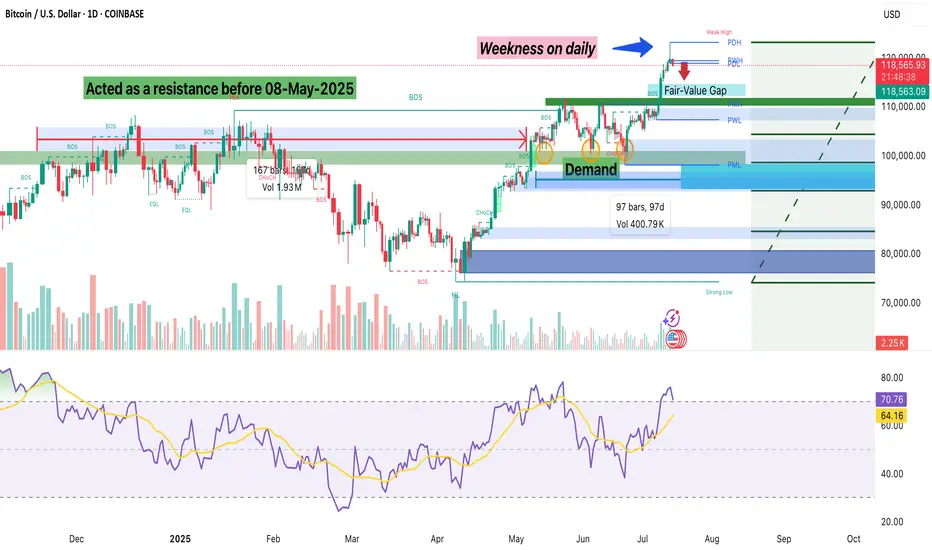
Signs of Weekness: Is Bitcoin Losing Momentum?Last week, Bitcoin made a new all-time high and gave bulls some serious profits. Price action has been looking solid and strong ever since it broke above the psychological and technical level of $110,000. But now, we’re starting to see signs that the market might need a healthy retracement.
On the daily chart, there’s a clear long wick at the top, which is a sign that buyers may be losing momentum up here. There’s also a Fair Value Gap (FVG) between roughly $115,200 and $112,200. In most cases, price tends to revisit these imbalances, so I wouldn’t be surprised if we dip back into that zone. I’m watching the midpoint around $113,700 because that could be a key level for a bounce if the bulls want to keep control.
If that zone fails to hold or we see a clean breakdown without much of a reaction, there’s a chance we revisit the $110,000 breakout level. From a Fibonacci standpoint, the 0.382 retracement of the recent move from around $98K to $120K also lands near $111.6K, which adds some confluence to that area.
Overall, I still think the trend is strong, but after this daily candle, I think that a 5–7% pullback wouldn’t be unusual or unhealthy. What are your thoughts? Are we just cooling off before another breakout, or is a deeper retracement on the table? Comments and suggestions?
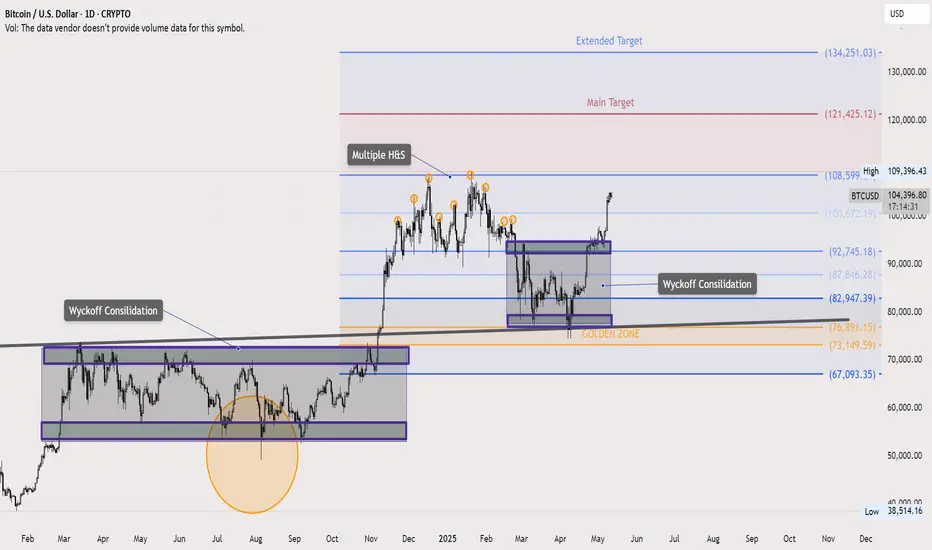
Bitcoin Update – Textbook Patterns Playing OutIn last week’s Bitcoin idea, I highlighted a key technical setup: price retested the neckline of a massive inverted Head & Shoulders pattern and launched a strong move upward. Let’s dive into what’s unfolding on the daily chart.
We’re seeing classic Wyckoff consolidation behavior—appearing right before the breakout and again after the neckline retest. Multiple smaller Head & Shoulders patterns have also formed and hit their targets cleanly.
The Volunacci pattern came alive after a precise bounce from the Golden Zone, adding more fuel to the bullish narrative.
Next major level in focus: $120K. Will Bitcoin reach it? Let the market decide.