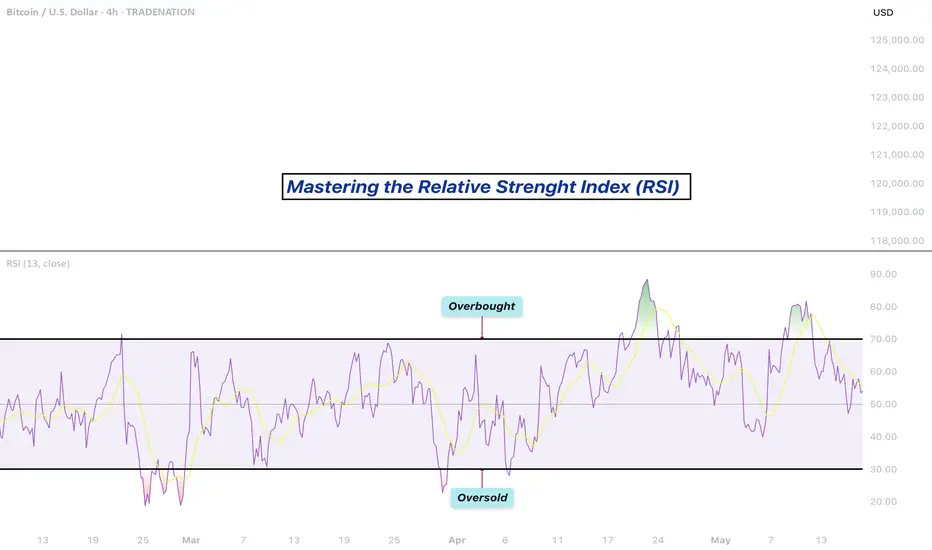
Mastering the RSI - How to use it in trading?What will be discussed?
- What is the RSI?
- RSI overbought
- RSI oversold
- RSI divergences
- How to use the RSI
- How to trade with the RSI
What is the RSI?
The Relative Strength Index (RSI) is a popular momentum oscillator used in technical analysis to measure the speed and change of price movements. Developed by J. Welles Wilder Jr., it ranges from 0 to 100 and helps traders evaluate whether a security is overbought or oversold. The RSI typically uses a 14-period timeframe and is calculated based on the average gains and losses over that period. A rising RSI suggests increasing buying momentum, while a falling RSI indicates growing selling pressure.
RSI overbought
When the RSI rises above 70, the asset is generally considered overbought. This condition indicates that the price may have risen too quickly and could be due for a correction or pullback. However, being overbought doesn't automatically mean a reversal will occur, it signals that bullish momentum is strong, and traders should be cautious of potential trend exhaustion.
RSI oversold
Conversely, an RSI reading below 30 is typically seen as a sign that the asset is oversold. This condition suggests the price may have fallen too sharply and could be primed for a rebound. Just like with the overbought condition, an oversold RSI doesn’t guarantee an immediate reversal but serves as a warning that bearish momentum may be overextended.
RSI divergences
Divergences occur when the RSI and the price of the asset move in opposite directions. A bullish divergence happens when the price makes a lower low, but the RSI forms a higher low, potentially signaling a reversal to the upside. A bearish divergence occurs when the price makes a higher high, but the RSI creates a lower high, possibly indicating a downward reversal. Divergences are often used to spot early signs of trend changes.
How to use the RSI?
To use the RSI effectively, traders typically look for overbought and oversold conditions to time entries and exits, combine it with other technical indicators for confirmation, and watch for divergences as a sign of potential reversals. RSI can also be adapted for different timeframes or strategies, depending on whether the trader is looking for short-term swings or long-term trend analysis. While it’s a powerful tool, RSI should not be used in isolation, it works best as part of a broader trading plan that considers market context and risk management.
How to trade with the RSI?
The RSI can be a powerful tool for identifying potential trade setups. When the price approaches a key support zone while the RSI remains in overbought territory, this may signal an early warning of a possible market reversal. However, rather than acting immediately, it's wise to wait for confirmation. A clear candlestick reversal pattern, such as a bullish engulfing candle or a pin bar, a provide stronger evidence that momentum is shifting. By combining RSI readings with price action and support levels, traders can improve the accuracy and timing of their entries.
Disclosure: I am part of Trade Nation's Influencer program and receive a monthly fee for using their TradingView charts in my analysis.
Thanks for your support.
- Make sure to follow me so you don't miss out on the next analysis!
- Drop a like and leave a comment!
BTCUSD trade ideas
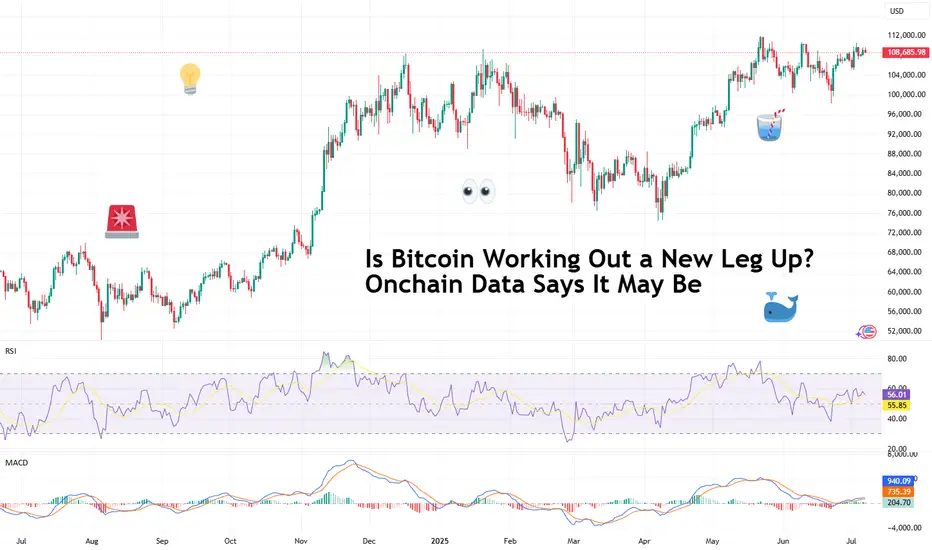
Is Bitcoin Working Out a New Leg Up? Onchain Data Says It May BeDiamond hands are waving goodbye and institutions are loading up — it’s why Bitcoin may be struggling to break out of its current consolidation range. How long can this accumulation phase continue?
And yes — we look at the trades of the decade — two transactions where each one moved a cool billie from a $7.8K investment in 2011.
Some people cling to their Bitcoin BITSTAMP:BTCUSD stash like it’s their last protein bar before a marathon. Others, apparently, wake up one day and decide to dump their coins and browse the market for islands.
Welcome to the silent shift that’s redefining the big players in the Bitcoin market, worth about $2.2 trillion as per data from our Crypto Coins Heatmap .
Old-school whales — the very early adopters and miners holding the OG wallets — are quietly selling, while institutional heavyweights sweep in to buy every dip (part of the reason why lately every breakout never breaks out).
Over the past year, these OG whales have shed about half a million Bitcoin — worth north of $50 billion — according to data from 10x Research. And guess who’s gobbling it all up? ETFs, corporate treasuries, and family offices that didn’t want anything to do with crypto five years ago.
Is it bullish? Is it bearish? Is it just Bitcoin being Bitcoin? Let’s pull up the charts, squint at the data, and see what the world’s most famous digital coin might be plotting next.
📈 A Record High — And Now What?
So here’s the setup. Bitcoin has been strutting under its record high of $111,000 for months now. You’d think the hype machine — from Trump’s pro-crypto administration, to corporate balance sheets going full Michael Saylor (looking at you, GameStop NYSE:GME ) — would send BTC blasting past the Moon and landing on Mars.
Instead? It’s just... chilling. Volatility’s drying up like the last drop of liquidity in a summer Friday session. And the reason is surprisingly simple: the massive handover happening between big, anonymous early adopters and the suit-and-tie institutional crowd.
😌 From Wild Ride to Easy Cruising?
You could argue this is exactly what Bitcoin needs: maturity, respectability, less drama. But don’t tell that to the day traders who want 20% swings before breakfast. As these whales get out and institutions get in, analysts say the upside could be capped at a chill 10% to 20% a year.
Good news for your retirement portfolio, maybe not so great for that “Lambo by Labor Day” dream.
Institutions now hold about 25% of all Bitcoin in circulation — and once these get in, they tend to sit tight for years.
🚀 The $1.1 Billion Time Capsule
Speaking of whales: ever wonder what happens when a Bitcoin wallet goes dark for 14 years? It pops back online to make your mind melt.
On April 3, 2011, a wallet labeled “1HqXB...gDwcK” moved 23,377 BTC to three addresses. At the time, Bitcoin was worth a mere 78 cents. Fast forward: two of those receiving wallets, each with 10,000 BTC, sat dormant for over a decade.
This month, both wallets moved their treasure troves — worth over $1.1 billion each — within 30 minutes of each other. Talk about a coordinated exit. What’s behind the move? Tax planning? A lost key finally found?
A savvy crypto thief who figured how to crack the earliest key generation method? We may never know. Also, OG guy, if you’re reading this — props for the all-at-once move without even a test transaction.
⛓️ What Onchain Data Says
Onchain data is like reading tea leaves for nerds with Bloomberg terminals. It says the supply is tightening — not because there’s less Bitcoin, but because fewer coins are actually available to trade.
When long-term holders move coins, that typically signals big-picture changes. Here’s the twist: the net effect has been… stability. Institutional demand, like Bitcoin exchange-traded funds , soaks up supply just as fast as whales drip it back in.
That’s why Bitcoin’s been stuck in this $100K–$110K limbo, ping-ponging while the accumulation phase is still going strong.
👀 So, Is a New Leg Up Coming?
This is where the optimists and realists start to bicker over the charts. On the one hand, the structural handover to institutions makes Bitcoin more credible, more regulated, and more boring.
But less volatility can mean steadier gains — especially if you believe that the world will always want an inflation hedge that no central bank can print into oblivion.
On the other hand, a sideways market can test your patience more than a typical drawdown. Some of the whales are gone, the suits have arrived, and the easy moonshots might not be so easy anymore.
🌱 The Trade-Offs of Growing Up
Bitcoin was born in the wild west of finance — an anonymous, volatile, meme-fueled phenomenon. Now, it’s drifting deep into the mainstream. That might limit the fireworks, but it also locks in its place as an asset class that’s not going away.
🌊 Closing Thoughts: The Next Billion-Dollar Move
Will we see another $7,800 investment turn into a cool $1 billion? Maybe not exactly like that. But the game isn’t over — it’s just evolving.
Keep your eyes on the whales, the ETFs, the Fed’s next move , and those onchain breadcrumbs.
Over to you , chart-watchers: does this calm consolidation make you bullish, bearish, or just plain bored? Share your thoughts in the comments!
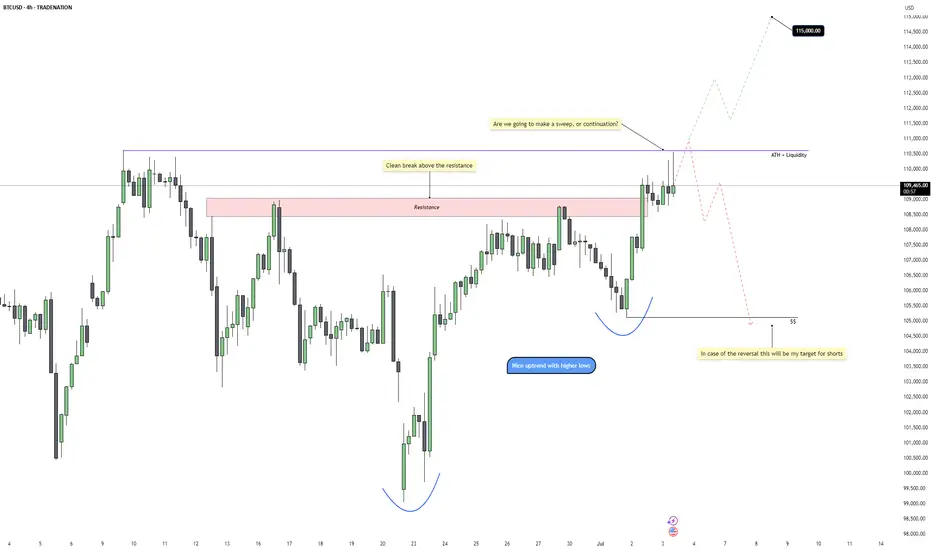
Bitcoin – ATH Sweep or Breakout?Bitcoin is pushing into a critical decision point as it challenges the previous all-time high near 110k. After a strong push out of a rounded bottom formation with clean higher lows, price has now broken above the last visible resistance area and is hovering just under the ATH liquidity. This rally has been aggressive, but the reaction here will determine whether this move becomes an extended breakout or a classic trap.
Liquidity and Key Resistance
The ATH zone around 110k carries a large pool of liquidity, and price is now testing it for the first time since the breakout. We’ve already had a clean break above the prior resistance zone, but we haven’t yet seen a confirmed close above ATH with convincing volume. If price manages to close strongly above this level on the 4H or daily chart, that would be a sign that bulls are in full control. Until then, the possibility of a sweep and rejection remains firmly on the table.
Sweep Scenario and Downside Levels
If we fail to close convincingly above the ATH and instead see a wick through followed by a strong reversal, that would confirm the sweep. In that case, I’d expect short setups to activate quickly, with downside targets sitting around 105k. This level marks the structure support below the most recent breakout, and would be a logical point for price to rebalance before continuing any broader uptrend. A rejection from current levels would also trap late longs and provide fuel for a quick retracement.
Bullish Breakout Scenario
If we do get that proper breakout above 110k, backed by strong volume and continuation candles, the upside opens fast. There’s very little structure above the ATH, so price could move cleanly up into the next round psychological target around 115k. This move would confirm continuation of the higher timeframe trend and offer short-term breakout retests for potential long re-entries.
Volume and Candle Confirmation Are Crucial
At this stage, the setup is binary and all about confirmation. A clean 4H or daily close above ATH with follow-through volume will flip the bias fully bullish. But if we get signs of exhaustion and a failed breakout attempt, the sweep setup becomes highly probable. Waiting for confirmation here is key, rather than trying to front-run the move.
Conclusion
Bitcoin is sitting right at a high-stakes level. We either continue into price discovery toward 115k if momentum follows through, or we see a classic liquidity sweep and rejection back into 105k. The clean structure and recent higher lows support both sides of the argument, but execution will depend on how price reacts around the ATH. Either way, this zone is the key pivot for the next major swing.
Disclosure: I am part of Trade Nation's Influencer program and receive a monthly fee for using their TradingView charts in my analysis.
___________________________________
Thanks for your support!
If you found this idea helpful or learned something new, drop a like 👍 and leave a comment, I’d love to hear your thoughts! 🚀
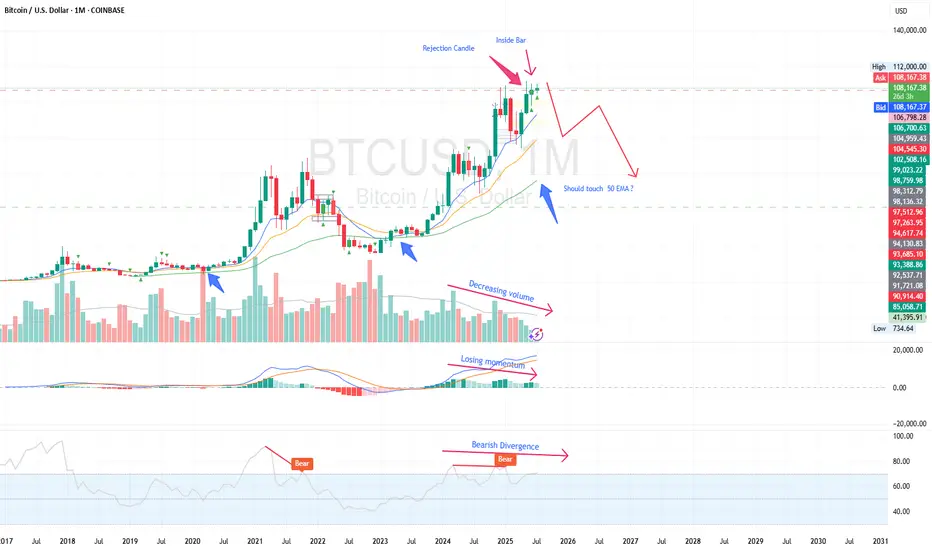
BTC monthly yelling at us for something interesting ?We read daily news about ETF, accumulation by institutes and scarcity in the exchanges, but I recognize something different in the chart based on multiple indicators. Historically, BTC boomed after touching 50 EMA and whenever it is extended it traces back to 50 EMA on monthly chart. As per current data, BTC is extended far from it. Also RSI and MACD indicating that it is losing momentum with -ve divergence. Volume as well descreasing since last leg, though price moved up. So, I expect price to retrace to 50 EMA which coincides with previous high at 60K. Let us see how it unfolds.
80k BTC On The Move - WHAT It Means 80,000 BTC Wallet Movement (2011 Miner)
• Source: 8 wallets containing 10,000 BTC each — mined in 2011, dormant for 14 years
• Total Value: Over $8.6 billion USD
• Timing: Moved on July 4, 2025 — largest dormant BTC transfer in history
• New Addresses: Funds moved to modern SegWit wallets
• Probable Owner: Likely a single early miner with 200k+ BTC history
Possible Reasons for the Move
• Key Rotation: Upgrading to modern wallets for better security
• Recovered Access: Private keys may have been recently recovered
• Market Strategy: Positioning for profit-taking or major sell-off
• Yield Farming: Preparing COINBASE:BTCUSD for use in DeFi/lending platforms
• Collateral Use: Possibly for loans, stablecoin leverage, or RWAs
• Estate Planning: Legal restructuring or generational wealth setup
• OTC Transfer: Could be prepping for off-exchange institutional sale
• Psychological Warfare: Could be intended to spook or manipulate the market
• Regulatory Response: Aligning with new compliance or tax jurisdiction
Market Reaction
• COINBASE:BTCUSD Price Dip: Price briefly fell below $108,000 post-move
• ETF Context: Movement occurred despite record ETF inflows
Key Note: These wallets had not been touched since COINBASE:BTCUSD was worth ~$0.78. Their reactivation adds uncertainty and opportunity in a fragile macro environment.
• What to do????: Watch the orderbook to find these large bitcoin moves in case of exchange selling
Near term support & resistance
$106000 support
$109500 first resistance
👍 If this breakdown helped your trading, smash that Like and drop a comment below—let me know what you think will happen with the 80k COINBASE:BTCUSD . 👍
Best Reguards
MartyBoots, 17-year market trader

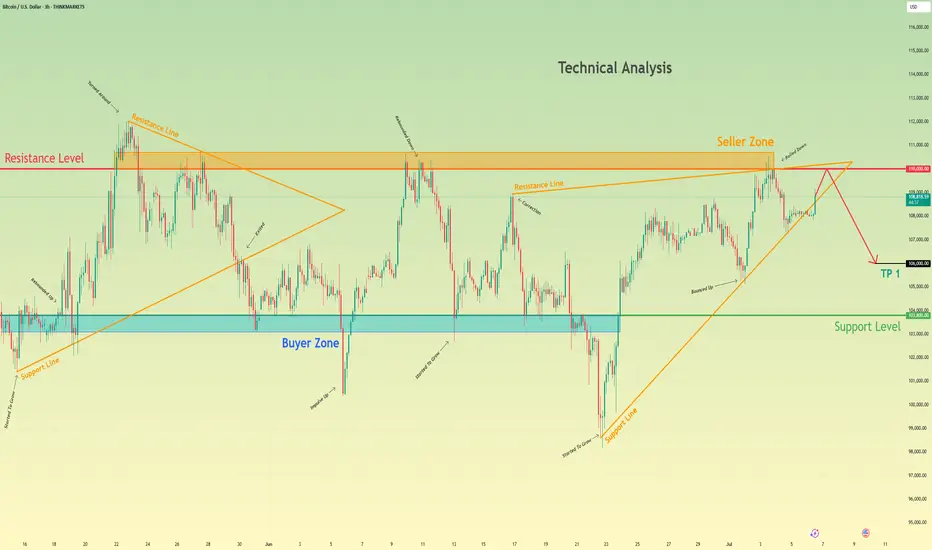
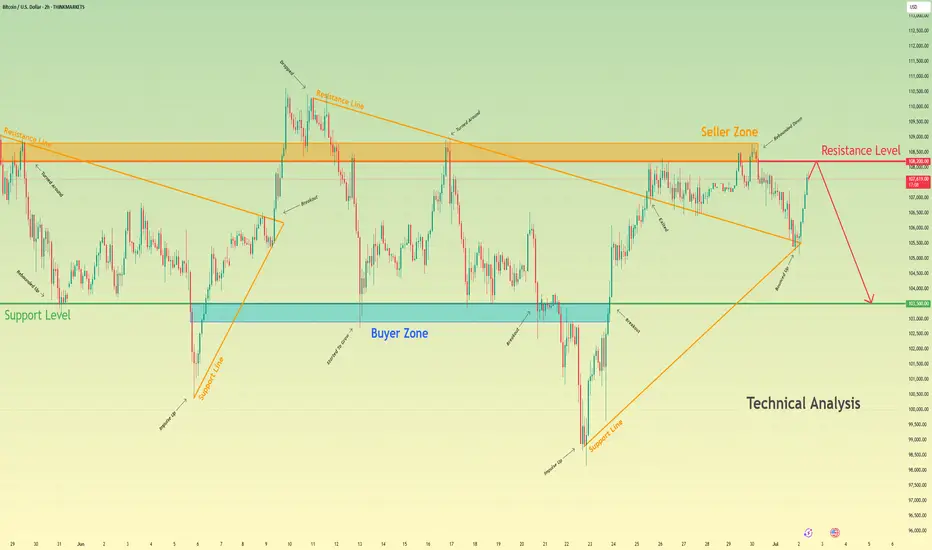
Bitcoin can rebound from resistance level and start to declineHello traders, I want share with you my opinion about Bitcoin. Recently, the price broke above a local resistance and quickly approached the key resistance level at 110000, which also aligns with the upper boundary of the seller zone (110000 - 110700 points). This area has already proven its strength multiple times, causing sharp rejections in the past. Moreover, the price has tested it again recently and failed to break through. In addition, we can see a triangle structure, which fits the logic of a pennant pattern after a bullish wave. However, the latest move upward has already lost momentum near the apex, and the price is now trading just under the upper edge of this formation. That makes this zone technically overloaded and vulnerable to a downside reversal. Based on this, I expect Bitcoin to test the resistance level one more time and then roll back down toward TP 1 at 106000 points, a zone near previous liquidity accumulation and a local consolidation range. If selling pressure increases, the price might aim for the buyer zone (103800 - 103100). Given the current rejection at resistance, the structure of the triangle, and the reaction inside the seller zone, I remain bearish and expect further decline toward the support. Please share this idea with your friends and click Boost 🚀
Disclaimer: As part of ThinkMarkets’ Influencer Program, I am sponsored to share and publish their charts in my analysis.
Bitcoin - Trust the higher timeframe!⚔️Bitcoin ( CRYPTO:BTCUSD ) is still 100% bullish:
🔎Analysis summary:
For the past couple of months we have been seeing an overall consolidation on Bitcoin. But looking at the higher timeframe, Bitcoin remains in an underlying strong bullrun. Consolidations are always expected and no reason to freak out since everything is still bullish.
📝Levels to watch:
$100.000
🙏🏻#LONGTERMVISION
Philip - Swing Trader

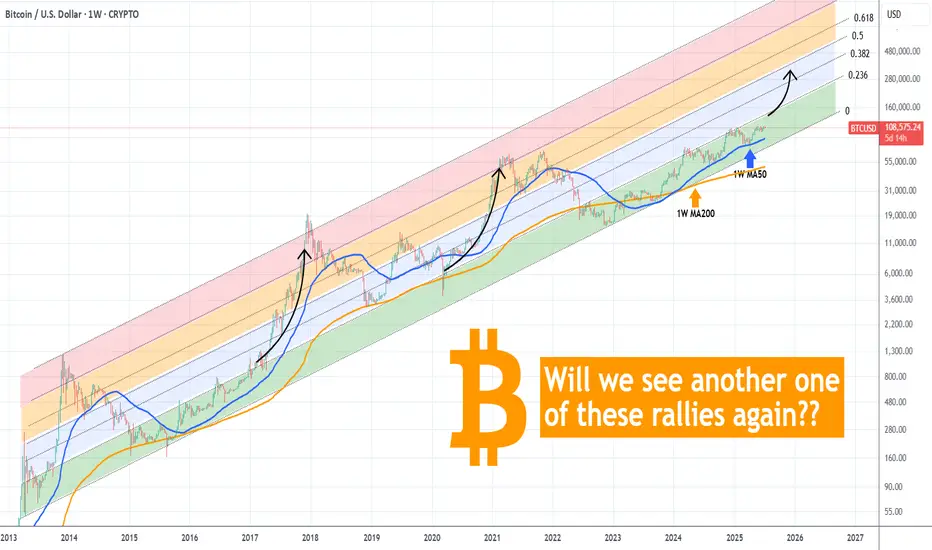
BITCOIN Is there enough time for another parabolic rally?Bitcoin (BTCUSD) is practically consolidating on the short-term, having just recently been rejected off its new All Time High (ATH). Despite the short-term volatility, the long-term outlook is still a very strong, structured uptrend, a Channel Up pattern that is now technically aiming for its next Higher High.
Incredibly enough, this Channel Up since the November 2022 market bottom, has been almost entirely within the Buy Zone (green) of the Fibonacci Channel Up going back all the way to April 2013!
As you can see during the previous two Cycles, every time BTC got above that Buy Zone, it started a parabolic rally. So far, we haven't got such rally on the current Cycle and with time running out (assuming the 4-year Cycle model continues to hold), do you think we will get one this time around?
Feel free to let us know in the comments section below!
-------------------------------------------------------------------------------
** Please LIKE 👍, FOLLOW ✅, SHARE 🙌 and COMMENT ✍ if you enjoy this idea! Also share your ideas and charts in the comments section below! This is best way to keep it relevant, support us, keep the content here free and allow the idea to reach as many people as possible. **
-------------------------------------------------------------------------------
💸💸💸💸💸💸
👇 👇 👇 👇 👇 👇
BTCUSD| Bitcoin’s Historic Parabolic Pattern🔥 Parabolic Pattern | Institutional COINBASE:BTCUSD Demand Mirrors Gold ETF Era 🔥
COINBASE:BTCUSD vs SP:SPX vs TVC:GOLD
The market is whispering something big — and it's not retail noise this time. For the third straight quarter, listed corporations have outpaced ETFs in Bitcoin purchases, a seismic shift that echoes one key moment in history: the launch of the Gold ETF. Companies like NASDAQ:MSTR contiune to buy and others are following. Will NASDAQ:AAPL NASDAQ:META and NASDAQ:GOOG be next ? Let me know in the comments who you think will be next to buy?
Back then, companies rushed to gold as a hedge against inflation and a store of value as fiat cracks widened. Fast forward to now — we're seeing the same institutional footprints in Bitcoin. The buy-the-dip narrative isn't just alive — it's being driven by corporate balance sheets.
Rumors are circulating that the U.S. government plans to buy 1 million BTC — a move that would shake the global financial system to its core. If true, this isn’t just bullish — it’s historic. The last time governments got this aggressive with a hard asset was during the Gold Reserve buildup. Bitcoin isn’t just digital gold anymore — it’s becoming sovereign-level collateral. 📈💥
💬 Drop your thoughts below. Is this the beginning of the next parabolic era?
In this episode, we break down the parabolic pattern forming on the chart, why it may signal the next explosive leg up, and how history is repeating with BTC playing the role of digital gold.
📊 Technical breakdown. On-chain behavior. Smart money moves.
Don’t blink. Parabolas end in fireworks.
I've been trading for 17 years
👍 If you found this useful, drop a like.
💬 Got questions or thoughts? Leave a comment below — I always respond and happy to help.
👍
Best Regards
MartyBoots

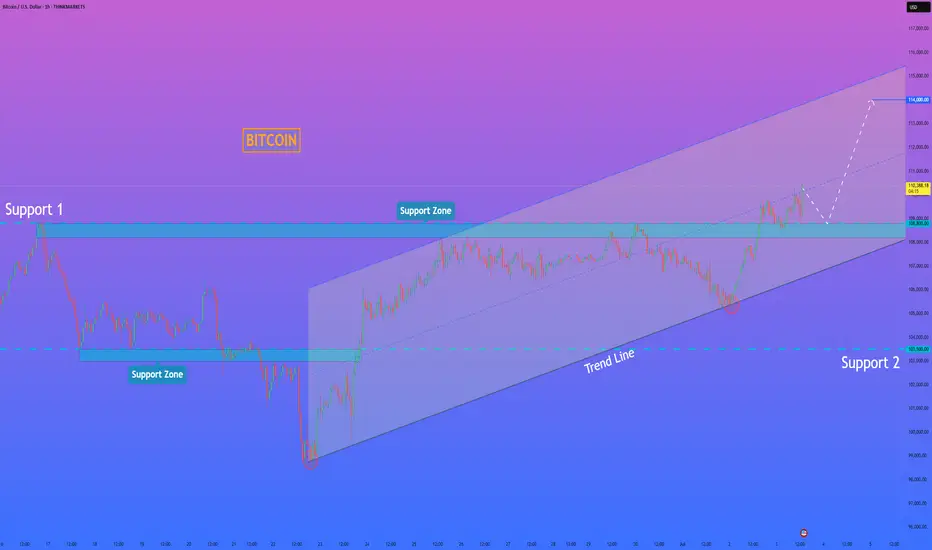
HelenP. I Bitcoin may correct to support level and continue growHi folks today I'm prepared for you Bitcoin analytics. If we look at the chart, the price has formed a clean upward channel after bouncing from the strong support zone at 103500 - 103000 points. This movement marked the beginning of a new bullish phase. Price continued to rise step by step, confirming the structure with higher highs and higher lows. After reaching above 110000 points, it made a minor pullback but still trades above Support 1 - 108800 points. This zone, 108800 - 108200 points, aligns well with the midline of the channel and may serve as a strong area for buyers to re-enter. The price is currently trading around 110382 points and is still respecting the channel structure. As long as BTCUSD stays above the support zone and inside the ascending channel, I expect a potential continuation toward the upper boundary. My current goal is 114000 points - near the resistance line of this bullish channel. Given the strong trendline support, clean reaction at each correction, and buyer activity on lows, I remain bullish and anticipate further growth. If you like my analytics you may support me with your like/comment ❤️
Disclaimer: As part of ThinkMarkets’ Influencer Program, I am sponsored to share and publish their charts in my analysis.
BTC POTENTIAL BULLS TRAP IN DEVELOPMENTI am inspecting the 4 hour candle in comparison to the daily chart on BTC and it seem we have all the characteristics of a bulls trap on the chart. If the next 4 hours candle does not close bullish, it will confirm a bulls trap and price will likely pullback into the triangle. So be cautious trading at this resistance level.
Bull Trap Chart Characteristics
Look for:
A strong bullish candle that breaks above recent highs or resistance.
Volume spike on the breakout — signs that traders are buying.
Followed by a sharp bearish candle (like a shooting star, bearish engulfing, or long wick).
Price falls back below resistance, turning the breakout into a fakeout.
Cheers !!

Bitcoin will drop from resistance level and fall to 103500 levelHello traders, I want share with you my opinion about Bitcoin. Some days ago, price entered the pennant, where it turned around from the seller zone, which coincided with the resistance level, and dropped to the 103500 support level. Then it bounced and tried to grow, but soon failed and dropped below the 103500 support level, which coincided with the buyer zone and reached the support line of the pennant. Following this movement, BTC experienced an upward impulse, breaking the 103,500 support level and subsequently exiting the pennant pattern, before rising to the resistance level. Price broke this level and then started to decline inside another pennant pattern. In this pattern, the price dropped top 103500 support level again and then tried to bounce back, but failed and continued to decline. In a short time, it fell to the support level, broke it, and then fell to the support line of the pennant. Next, BTC turned around and repeated an impulse up to the resistance line of the pennant and exited from this pattern. Then it rose to the seller zone, where it rebounded from it and fell, but recently it rebounded and started to grow. Now, I expect that price will reach the resistance level and then drop to the 103500 support level. For this case, this level is my TP. Please share this idea with your friends and click Boost 🚀
Disclaimer: As part of ThinkMarkets’ Influencer Program, I am sponsored to share and publish their charts in my analysis.
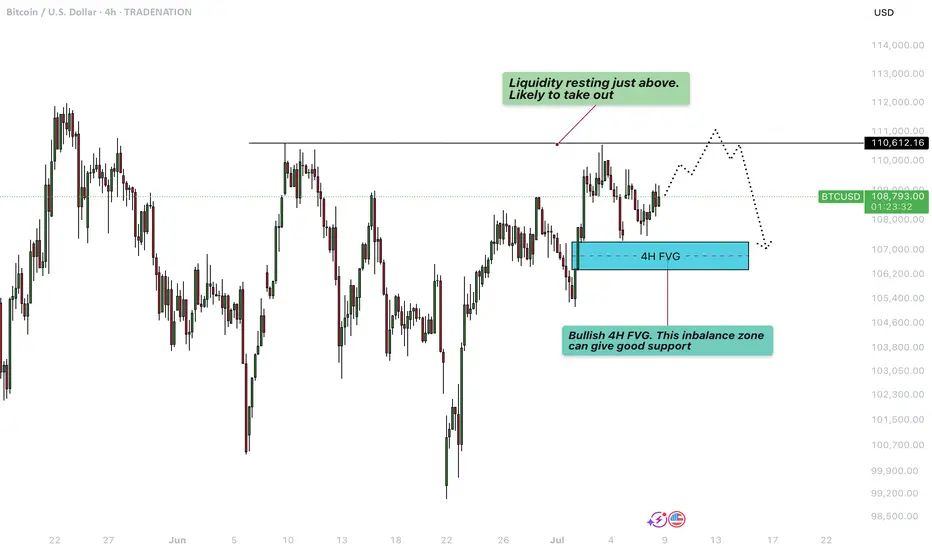
Bitcoin - Liquidity grab at $111.000?This 4-hour BTCUSD chart illustrates a potential short-term bullish continuation scenario followed by a deeper retracement, highlighting key liquidity levels and an important Fair Value Gap (FVG) support zone.
Liquidity sweep
At the top of the current price action, just above the $110,612.16 level, there is a clear area of resting liquidity. This zone has likely accumulated a significant number of stop-loss orders from traders who are shorting the market or who went long earlier and are protecting profits below previous highs. The market tends to seek liquidity to fill institutional orders, making this zone a high-probability target for a sweep. As a result, price is likely to take out these resting stop orders in a quick upward move, often referred to as a "liquidity grab" or "stop hunt", before potentially reversing or consolidating.
Bullish 4H FVG
Following this liquidity sweep, the chart suggests a retracement into a bullish 4-hour Fair Value Gap (FVG) located around the $106,600 to $107,400 region. This imbalance zone was formed during an impulsive move up, leaving behind a gap between the wicks of consecutive candles. Such gaps represent areas where demand previously overwhelmed supply, and they often act as strong support on a retest. If price revisits this zone, it is expected to offer support and could serve as a base for another upward push, assuming bullish momentum remains intact.
Downside risk
However, if the bullish FVG fails to hold as support and price breaks down through this imbalance zone, it would signal a weakening of bullish structure. In that case, the breakdown would likely lead to a deeper correction or even a trend reversal, with price seeking lower levels of support further down the chart. This would invalidate the short-term bullish scenario and suggest that sellers are gaining control, possibly triggering further liquidations and more aggressive selling pressure.
Conclusion
Overall, the chart is currently leaning bullish, anticipating a liquidity sweep to the upside followed by a potential pullback into the FVG. The reaction at the FVG will be critical in determining whether the market can continue higher or if it shifts into a deeper bearish correction.
Disclosure: I am part of Trade Nation's Influencer program and receive a monthly fee for using their TradingView charts in my analysis.
Thanks for your support.
- Make sure to follow me so you don't miss out on the next analysis!
- Drop a like and leave a comment!
BITCOIN - Price can drop from resistance area to $103000Hi guys, this is my overview for BTCUSD, feel free to check it and write your feedback in comments👊
Some days ago, price entered a pennant pattern, where it at once made an upward impulse from support line.
Then the price reached $98700 level and soon broke it, after a small correction, and then continued to move up.
Later BTC rose to the resistance line of the pennant, but soon turned around and started to decline, breaking $110000 level.
Price little corrected and then tried to bounce back and failed, after which it fell to $98700 level and then started to grow.
In a short time, BTC rose to a $110000 resistance level and tried to break it again, but recently turned around and started to fall.
Now, I expect that BTC can grow to the resistance area and then drop to $103000 support line of the pennant.
If this post is useful to you, you can support me with like/boost and advice in comments❤️
Disclaimer: As part of ThinkMarkets’ Influencer Program, I am sponsored to share and publish their charts in my analysis.
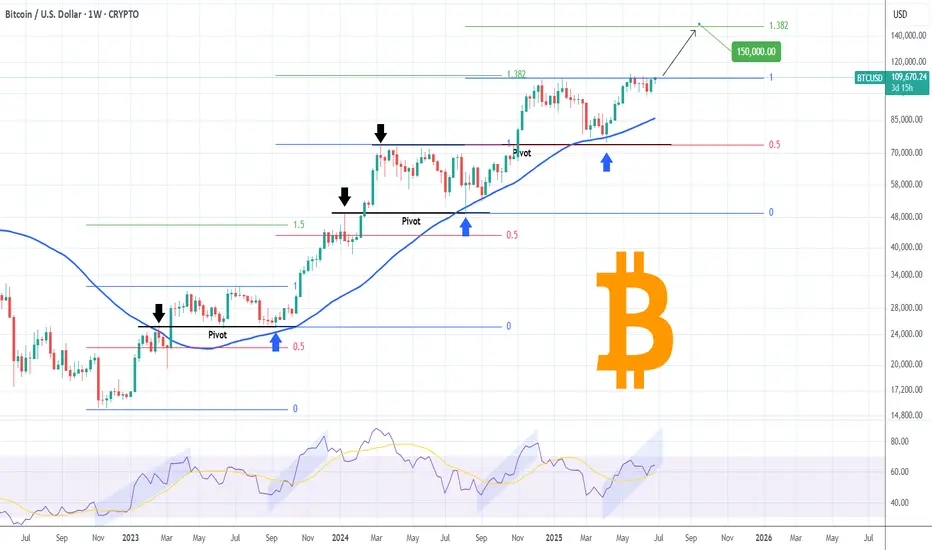
BITCOIN now starts ascent to $150k.Bitcoin (BTCUSD) closed last week with a strong green 1W candle, recovering all loses and has started the current one with a stable rise. As stable as the whole Bull Cycle has been so far since the November 2022 market bottom.
The current uptrend is the technical Bullish Leg that has always emerged the Triple Support Combo of the 1W MA50 (blue trend-line), 0.5 Fibonacci retracement level and former Resistance, turned Support (Pivot).
As you can see, this has happened 2 times already and this is the 3rd. The previous one peaked a little above the 1.382 Fibonacci extension, which gives us an immediate Target on a 2-month horizon at $150000. This confirms a number of previous studies we conducted, all leading towards this price or around it.
So do you think all roads lead to $150k? Feel free to let us know in the comments section below!
-------------------------------------------------------------------------------
** Please LIKE 👍, FOLLOW ✅, SHARE 🙌 and COMMENT ✍ if you enjoy this idea! Also share your ideas and charts in the comments section below! This is best way to keep it relevant, support us, keep the content here free and allow the idea to reach as many people as possible. **
-------------------------------------------------------------------------------
💸💸💸💸💸💸
👇 👇 👇 👇 👇 👇
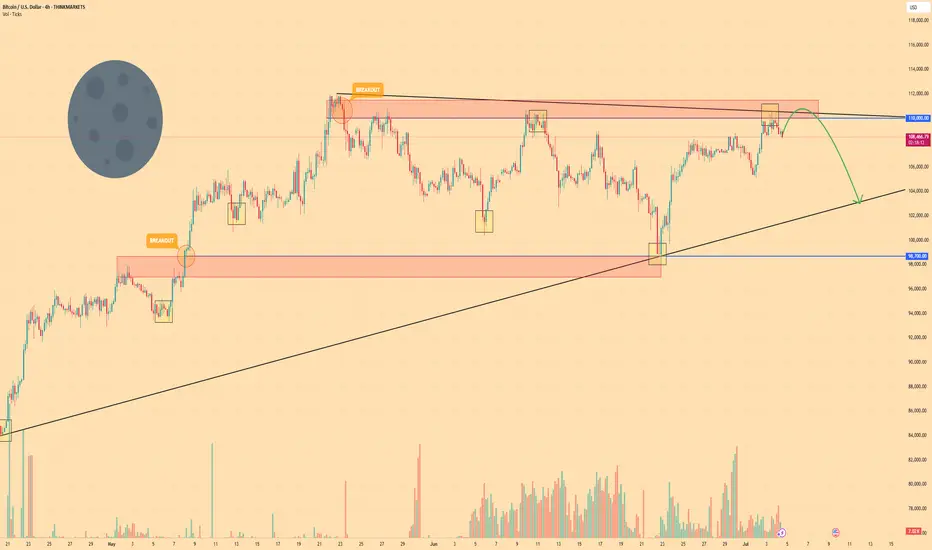
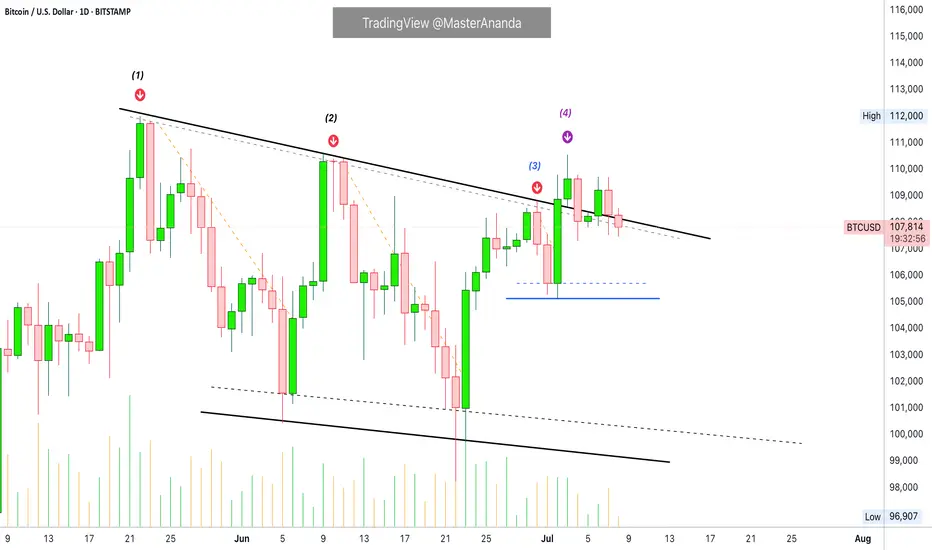
Evolving Price & Candle Patterns: BitcoinLook what is happening here with the candle patterns and price action. In the most recent challenge of resistance something changed. Change is good. It can mean the end of this sideways period.
At (1) Bitcoin finds resistance and immediately starts a decent. The same happens at (2). When we reach (3) everything changes. (1) & (2) produced a low and lower low. The down-move was extended. (3) produced only two red candles, a strong higher low and the third day was a full green candle moving above the descending trendline resistance. The price pattern is now erratic, completely different to previous moves.
Now, consider (4). If the strong green candle was intended as a bull-trap, then we would expect a down-move to follow right after the peak, just as it happened with (1) and (2). But nothing, after (4), Bitcoin has been sideways within the bullish zone.
This change is good, bullish.
A drop can develop anytime but the market already had two changes to produce a down-wave, (3) and (4). The fact that a down-move didn't materialize means that the market has something different in store for us, change. This change is good because when resistance is challenged, prices tend to drop when the market is moving within a range. No drop can signal the end of the range trading which in turn can translate into the start of the next bullish wave.
If this idea turns out to be true, Bitcoin will start growing within days. Growth should be strong because consolidation has been happening for months.
Namaste.
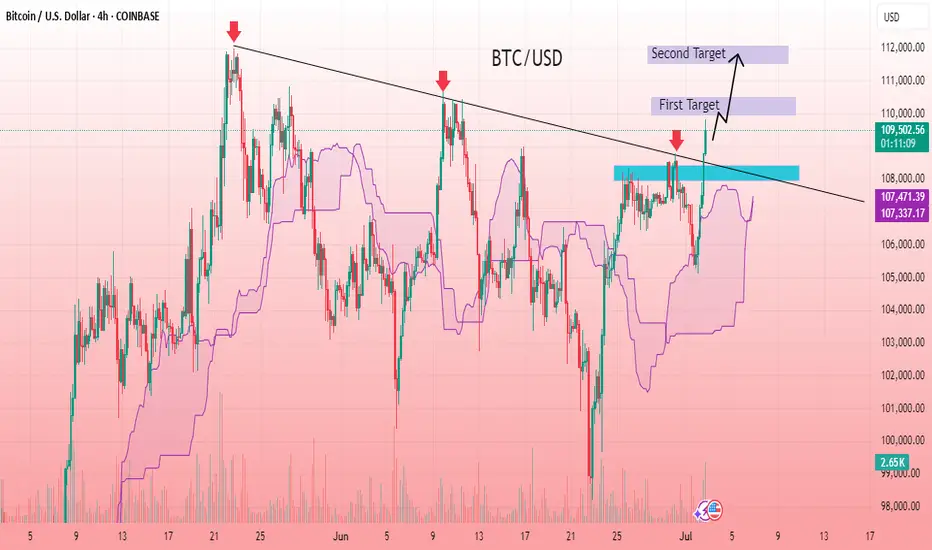
BTC Breakout Alert: Ready for the Next Bullish Wave The BTC/USD 4-hour chart shows a clear breakout above a descending trendline that has acted as resistance since mid-May. After multiple rejections, the price has now broken above the structure, signaling bullish momentum. The Ichimoku cloud confirms support underneath, providing confluence for a potential rally. The bullish breakout is also accompanied by increasing volume and a bullish engulfing pattern near the breakout zone, which adds confirmation. Price is currently consolidating just above the breakout area, suggesting a retest may be forming before further upside continuation. If momentum sustains, higher levels could soon be tested in the coming sessions.
Entry: 109,400
1st Target: 110,000
2nd Target: 111,870
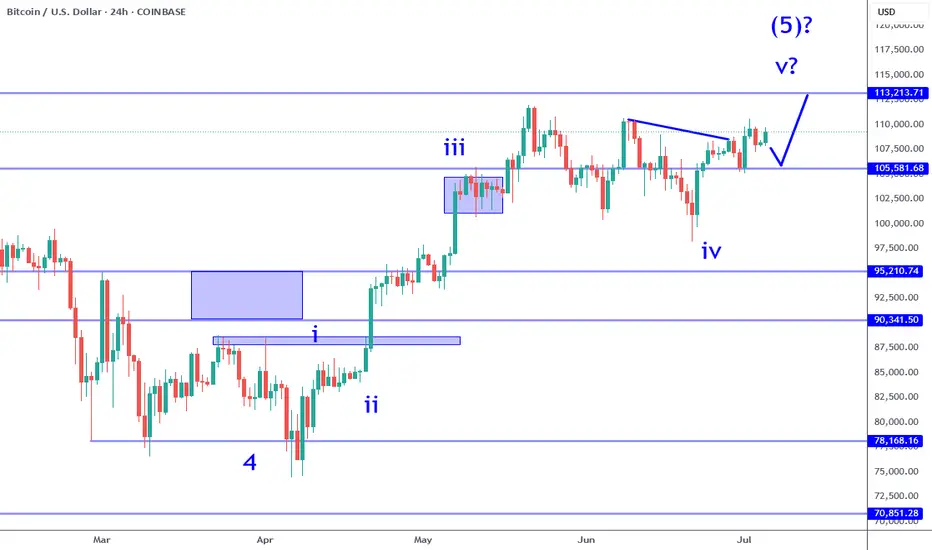
Bitcoin: Breakout To 113K Refuses To Pull Back.Bitcoin is poised to test the 113K resistance over the coming week. It has broken the upper trend line resistance and simply refuses to retrace in any meaningful way. With a continuously weakening dollar and other economic inflationary pressures, it will take a surprise negative catalyst to turn this around at least to the point of testing a high probability trend support on this time frame. Here is the way to play this environment:
Buying this breakout for time horizons longer than a swing trade requires a big risk tolerance. While this leg is likely to be the Wave 5 of 5 that I have been writing for some time and can see Bitcoin test some major new highs, investing here still puts you at the mercy of the market. The nearest support is around the 103 to 105K area at minimum and just not worth the risk in my opinion at current levels for INVESTING.
Swing trades are a great way to participate in the breakout continuation. Risk can best be defined by the current candle low or previous candle low. Profit objective now is 113K or 120K area. The Trade Scanner Pro actually called a long and offered numerous opportunities to enter over a week and a half ago. I have been reviewing this regularly on my live stream forecast every Monday at 3 PM ET. It helps immensely to have levels and risk defined for these type of situations in advance so that you know how to adjust your size.
Otherwise the optimal way to go about this is trade the smaller time frames. I will always suggest this near highs and breakouts on larger time frames. The reason is simple: risk can be tightly controlled. This requires some kind of rules or guidelines to judge the market, along with a way to confirm. Using the Trade Scanner Pro for example, the analysis component is easy: trend is bullish on all small time frames. This means you wait for a trade suggestion on the time frame that you regularly trade (1 min or 5 min f or example).
No matter what type of trend following system or rules you use, by aligning with the bigger picture and confirming a setup in some way is what puts the probabilities on your side. The smaller the time frame you operate, the more precise your risk management can be.
Thank you for considering my analysis and perspective.
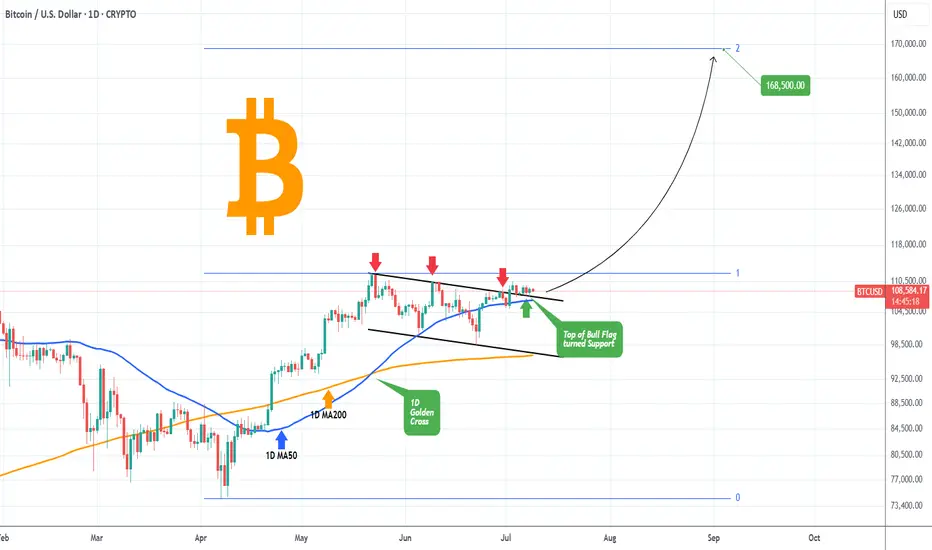
BITCOIN turning the Bull Flag into Support??Bitcoin (BTCUSD) has been trading sideways, almost flat, since the July 03 High, supported by the 1D MA50 (blue trend-line).
Perhaps the strongest development of the week though is the fact that this consolidation has been taking place at the top (Lower Highs) of what we previously identified as a Bull Flag pattern.
Together with the 1D MA50, this Lower Highs trend-line forms a formidable Support, which as long as it holds, can technically fulfil the technical expectations out of this pattern and target the 2.0 Fibonacci extension at $168500.
Is this one step closer to our 'fair valued' $150k Target for this Cycle? Feel free to let us know in the comments section below!
-------------------------------------------------------------------------------
** Please LIKE 👍, FOLLOW ✅, SHARE 🙌 and COMMENT ✍ if you enjoy this idea! Also share your ideas and charts in the comments section below! This is best way to keep it relevant, support us, keep the content here free and allow the idea to reach as many people as possible. **
-------------------------------------------------------------------------------
💸💸💸💸💸💸
👇 👇 👇 👇 👇 👇
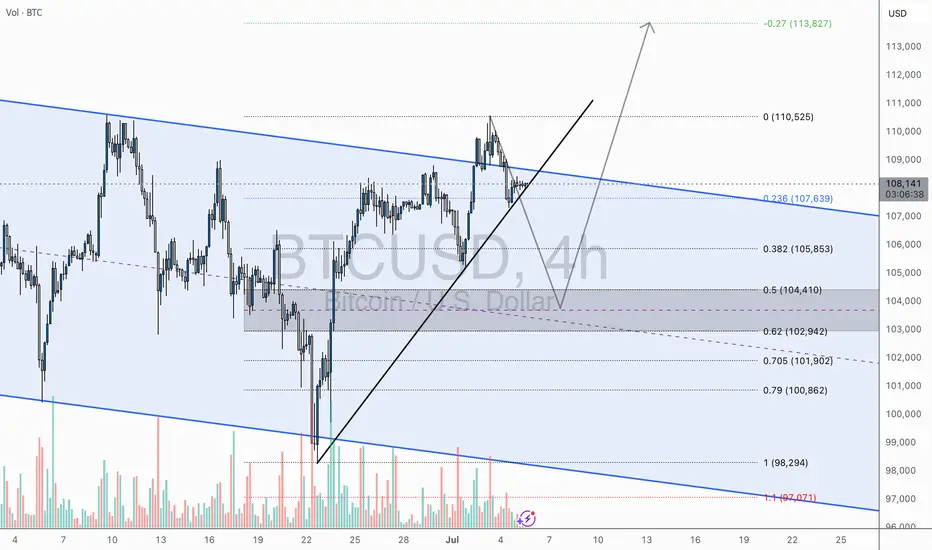
BTC/USD – Pullback Before Moonshot?4H Outlook by WrightWayInvestments
Bitcoin just delivered a textbook breakout from the descending channel and is currently consolidating above the breakout trendline. This is a critical zone where market participants are deciding between continuation or a retest.
🧠 Technical Breakdown:
🔹 Breakout Confirmation – Clean bullish breakout above channel resistance
🔹 Ascending Trendline Support – Currently being tested
🔹 Fibonacci Reload Zone – Between 0.382–0.618 (🟦 $105,853–$102,942)
🔹 Bullish Scenario – Potential higher low before aiming for major fib extension
🔹 Target Zones:
• TP1: $110,525
• TP2: $113,827
🧭 Game Plan:
A retracement into the fib support zone ($104K–$102.9K) offers the highest RR for long entries, ideally on bullish candlestick confirmation + volume spike. A break and close above $108.5K could negate pullback expectations and signal direct continuation.
🔔 Final Note:
Volume expansion on breakout + controlled retrace = power setup.
Let the market come to you — high-probability zones don’t chase.
Quantum Computing - Why BTC isn't the biggest worryYou’ve probably heard that quantum computing could break Bitcoin’s encryption—and that’s true. But here’s the thing: Bitcoin might not even be the biggest target.
The real risks? Financial systems, national security, healthcare, and even the internet itself. These areas rely on the same encryption methods that quantum computers could crack, and the fallout could be far worse than a Bitcoin hack.
Let’s break it down.
1️⃣ Financial Systems: A Global Crisis Waiting to Happen
Imagine if hackers could:
Drain bank accounts at will.
Manipulate stock markets.
Fake trillion-dollar transactions.
This isn’t just about stolen crypto—it’s about economic chaos. Banks, stock exchanges, and payment systems all depend on encryption. If quantum computers break it, we’re looking at a meltdown way bigger than Bitcoin’s $3 trillion market.
2️⃣ National Security & Internet Privacy: A Hacker’s Dream
Governments and militaries use encryption to:
Protect classified intelligence.
Secure communications between leaders.
Guard critical infrastructure (power grids, water supplies).
If quantum computers crack these codes, entire nations could be exposed to cyberwarfare. Your private data? At risk too—email, messaging, even your online banking could be decrypted years later.
3️⃣ Healthcare, Supply Chains & IoT: The Hidden Vulnerabilities
Medical records could be leaked, exposing sensitive health data.
Smart devices (like home security systems) could be hacked.
Supply chains might collapse if logistics networks are breached.
These systems weren’t built with quantum threats in mind—and upgrading them won’t be easy.
🔴 The Bigger Picture: A "Civilizational Upgrade"
Switching to quantum-resistant encryption is like rebuilding the internet’s foundation. It’s necessary, but messy. Some experts compare it to the Y2K bug—but way harder.
🔷 So, Is Bitcoin Safe?
Not entirely—about 25% of all Bitcoin could be stolen if quantum computers advance fast enough. But compared to the risks facing banks, governments, and hospitals? Bitcoin might be the least of our worries.
🔷 What’s Next?
Governments & companies are already working on fixes (like NIST’s post-quantum cryptography standards).
The transition will take years—and hackers might exploit weak spots along the way.
Staying informed is key. If you’re in tech, finance, or security, this affects you.
ℹ️ Want to Dive Deeper?
Deloitte’s take on quantum computing & Bitcoin
Forbes on quantum risks beyond crypto
🤷♂️ Bottom line?
Quantum computing is coming—and while Bitcoin has risks, the real danger lies in the systems we all depend on every day.
❔What do you think? Will we be ready in time? Let me know in the comments! 🚀

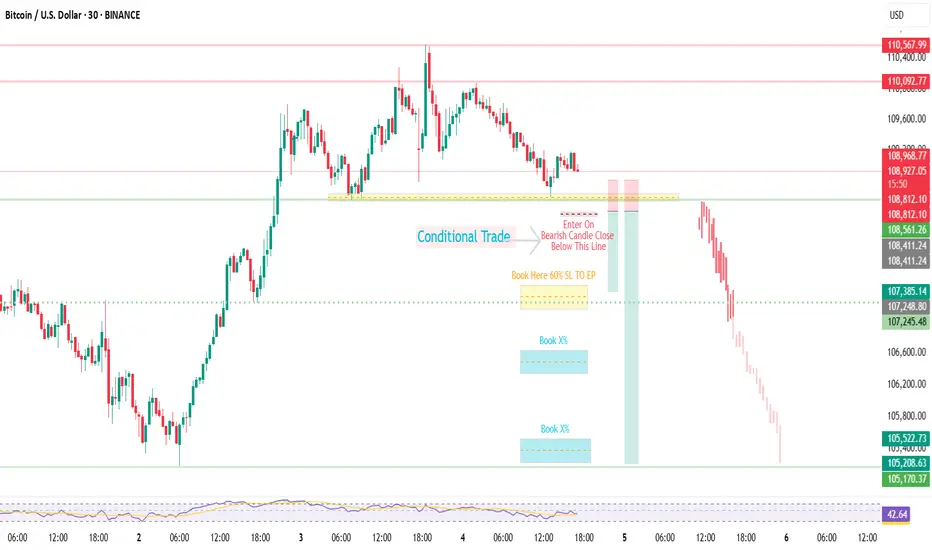
BTCUSDBTCUSD | Quiet Market Play – Conditional | Trade Based On Bearish Candle Closure
After a sharp upward move, price is now losing momentum and consolidating.
Currently entering a short position after breaking the resistance
Trade includes full risk management, marked on chart. 🔴📉
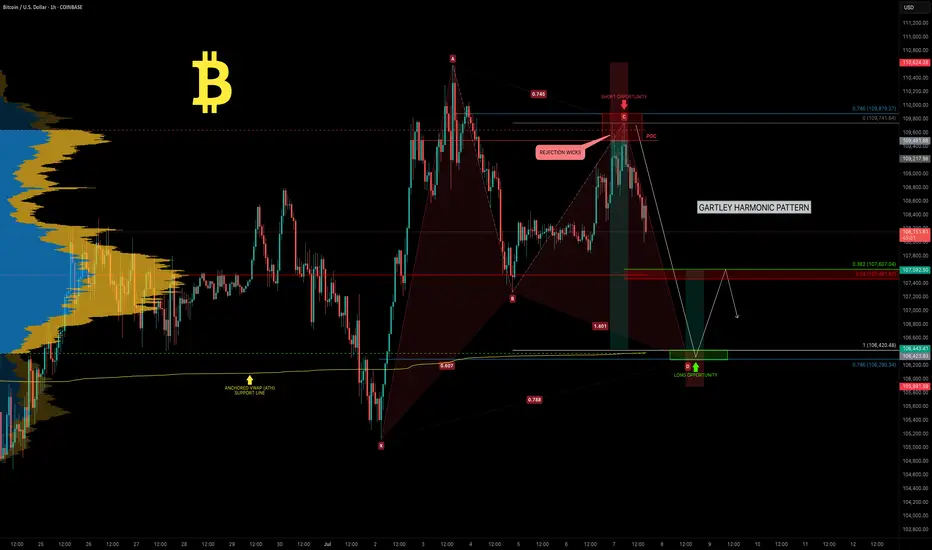
BTC — Weekend Pump Fades.. All Eyes on the Gartley Reversal ZoneBitcoin has been consolidating in a tight range between $110K and $105K over the past two weeks. This weekend’s attempted breakout stalled out quickly! BTC was rejected at the Point of Control (POC) of the previous range and came close to the 0.786 retracement of the recent drop.
🧠 Reminder: Weekend pumps are notorious for being unreliable, especially without strong volume.
Now, the charts point toward something much more structured — a potential Gartley harmonic pattern forming, with multiple levels of confluence suggesting the next key decision zone is just around the corner.
🧩 Gartley Completion Zone: $106,290–$106,400
This price zone is loaded with confluence:
✅ 0.786 Fib retracement of the XA leg sits at $106,290
✅ 1.0 trend-based Fib extension of the BC leg is at $106,370
✅ Anchored VWAP from all-time high aligns precisely at $106,370
✅ VAL (Value Area Low) sits at the same level
✅ Imbalance (Fair Value Gap) from earlier price inefficiency lies in this exact region
All of this stacks up into a high-probability reaction zone.
🎓 Educational Insight: How to Trade a Gartley Harmonic
The Gartley pattern is one of the most powerful harmonic setups — a structured form of retracement and extension that captures exhaustion before reversals. Here's how it works:
🔹 XA: Impulse leg
🔹 AB: Retracement of 61.8% of XA
🔹 BC: Retraces 38.2%–88.6% of AB
🔹 CD: Extends to 78.6% retracement of XA and aligns with a 1.0–1.272 Fib extension of BC
🟢 Point D is the entry zone — your reversal opportunity.
📉 Stop-loss sits just below invalidation (Point X).
💰 Targets usually lie at 0.382 and 0.618 of the CD leg.
🔎 Why It Works: It traps late traders and captures price exhaustion at natural Fibonacci ratios. Combined with other tools — like VWAP, liquidity zones, and order flow — it becomes a high-conviction strategy. These patterns are most effective on higher timeframes like 4H or daily.
_________________________________
💬 If you found this helpful, drop a like and comment!
Want breakdowns of other charts? Leave your requests below.