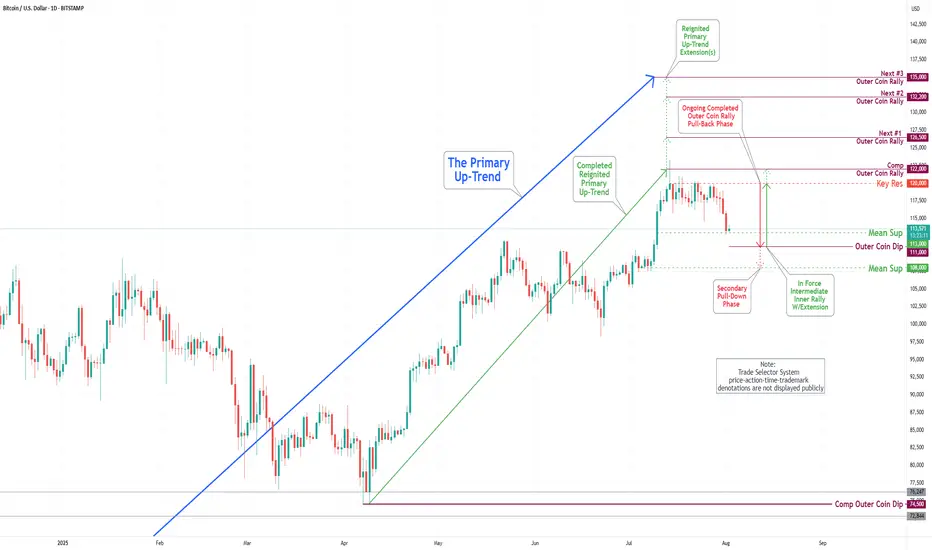
Bitcoin(BTC/USD) Daily Chart Analysis For Week of August 1, 2025Technical Analysis and Outlook:
In this week's trading session, the Bitcoin market experienced a notable pullback. The primary reason for this movement was the Key Resistance level, which led to a decline that reached our Mean Support level of 113000. This anticipated pullback is prompting the completion of the Outer Coin Dip target of 111000, with a strong likelihood of moving towards the Mean Support level of 108000.
BTCUSD trade ideas
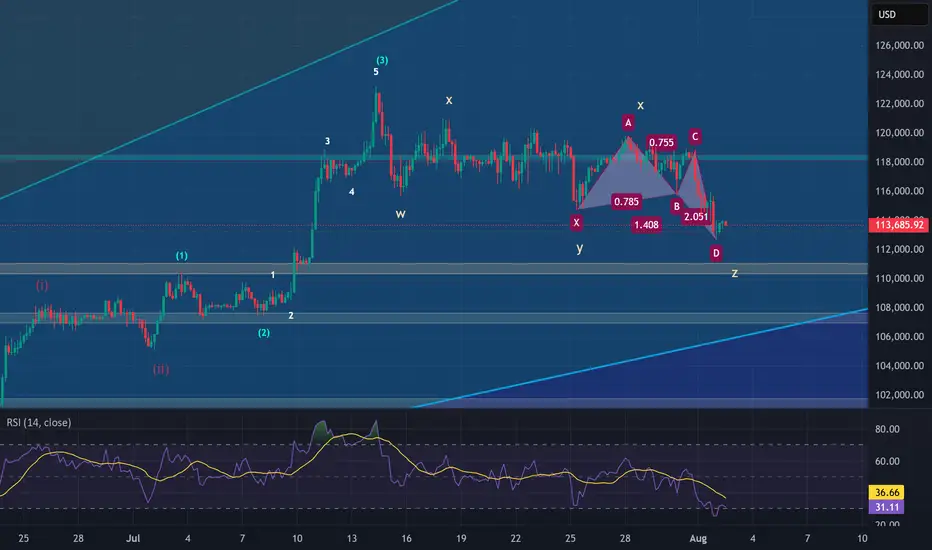
The End of BTC correction? BTC analysis 2/8/2025In my point of view, BTC has completed its correction and is now ready for a strong upward move, potentially targeting the $137,000–$139,000 range, based on the following factors:
1. Confirmation of the Butterfly Harmonic Pattern
The recent reversal occurred within the expected range of the Butterfly harmonic pattern. Typically, the XD leg in a Butterfly harmonic extends to 1.27, but in practice, this can stretch up to 1.414, which is commonly used as a flexible stop-loss zone. After testing the 1.27–1.414 range, a clear 5-wave impulse followed—testing a key trendline and making an attempt to break above the recent high. This sequence, followed by a corrective move, suggests that the broader correction may be complete.
2. Complex WXYXZ Correction Structure
In my previous analysis, I underestimated the duration and depth of the correction. The wave (4) (blue), which is part of the wave (iii), has taken considerable time—likely to allow wave (5) to extend sufficiently to break above the $130,000 level. This would support the assumption that wave (5) (purple) is the extended wave. The overall corrective structure appears highly complex, and can be counted as a W–X–Y–X–Z pattern, supported by the presence of multiple internal corrections within the wave components.
3. 0.618 Fibonacci Retracement of Wave (3)
Wave (4) has now reached the 0.618 Fibonacci retracement level of wave (3), which is significant. Historically, BTC’s corrections rarely retrace beyond the 0.87 level. This deep retracement suggests wave (4) is likely complete—unless price were to fall below that threshold, which would invalidate this assumption.
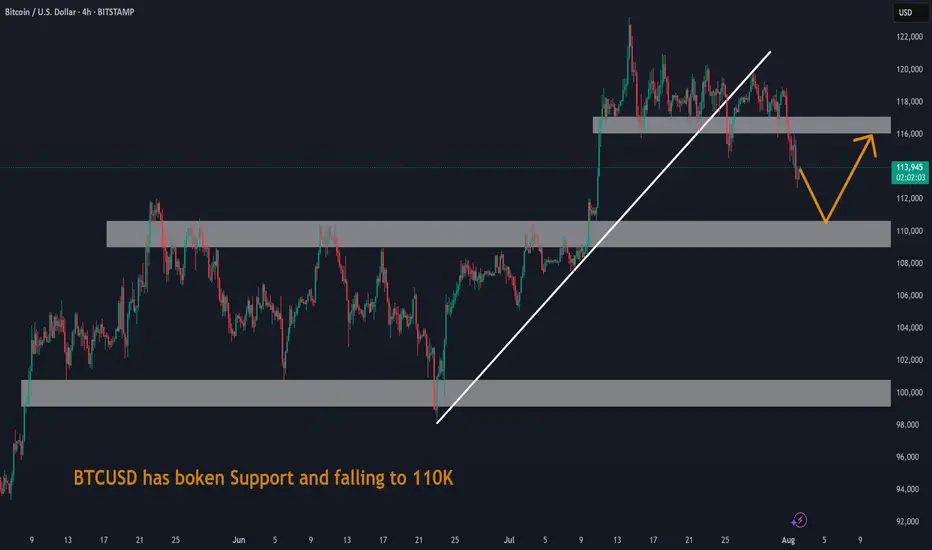
BTCUSD has boken Support and falling to 110KBTCUSD has boken Support and falling to 110K. This decline is due to General fall in equity market due to Tariff war.
Bitcoin – Time to Book Profits?📉 Bitcoin – Time to Book Profits? 📈
Bitcoin (BTCUSD) has had a phenomenal run! On Nov 22, 2022, it bottomed out at around $15,500 — and then, on July 14, 2025, it smashed records by hitting an all-time high of $123,000! 💥
That’s a jaw-dropping gain of approximately 693% in just under 3 years! 🤑📊
🚨 But all that glitters isn't gold...
📉 Technical outlook based on Elliott Wave Theory suggests we might be in either:
An extended Wave 4 correction, or
A fizzling Wave 5 move that’s losing steam.
🔍 Adding to this concern:
Volume is below average – a classic warning sign 🚨
Price action shows weakening momentum
No strong buying confirmation near the highs
👉 The pattern now resembles a potential distribution phase, not a fresh breakout. That means: The smart money might already be booking profits.
💡 What should investors do?
If you’ve ridden the wave up — consider taking some money off the table. This could be a good time to lock in gains and wait for a better re-entry opportunity. Remember, discipline beats excitement in trading.
📛 Caution is advised — especially for late entrants who might get caught in a correction or a prolonged sideways phase.

BTC Breaks Support – What's Next for Bitcoin?🧠 Bitcoin Technical Analysis – August 1st, 2025
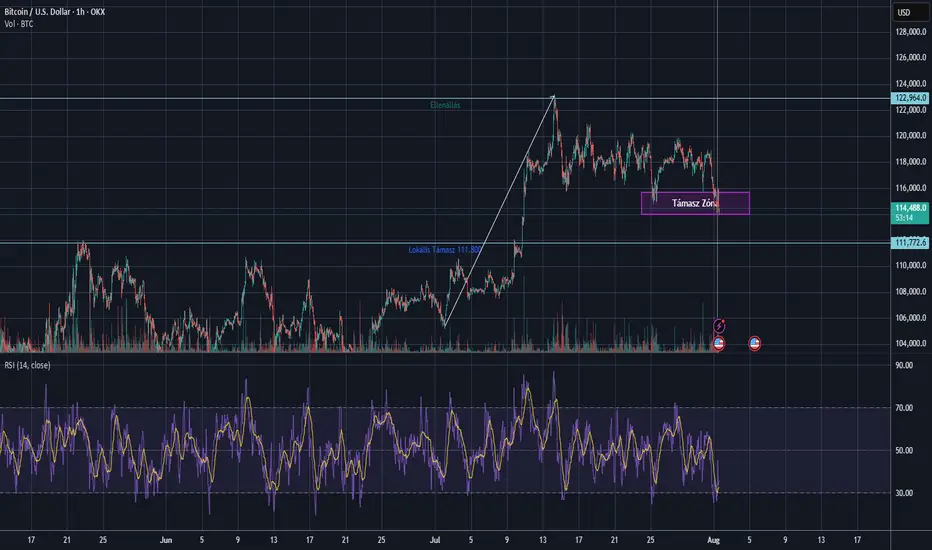
📉 BTC/USD is under pressure, currently trading near $114,200, after dropping from the recent range highs. The chart shows a clear breakdown from a key consolidation zone between $114,000–\$115,500, marked as a crucial support zone.
🔍 Key Observations:
Major resistance remains at $123,000, where BTC topped mid-July.
A bullish trendline from early July has been broken — confirming momentum shift.
Local support sits at $111,800, a potential next landing zone if this breakdown continues.
The RSI (14) is now in oversold territory, below 30, signaling potential bounce or short-term relief — however, no bullish divergence is visible yet
---
🔎 Volume Spike & Momentum:
A noticeable volume spike has appeared alongside the breakdown, confirming strong selling pressure .
Short-term moving averages (e.g., 10 EMA) are now above price, adding to the b earish short-term bias.
🧭 Conclusion :
This region is critical for bulls — if BTC can reclaim the purple support box, it could invalidate the breakdown and trap aggressive shorts. Otherwise, \ $111,800 is the next area to watch for a reaction.
Let me know your thoughts below — Will this support hold or is \$110k next?
Correction coming in....This channel is not providing individualized trading or investment advice, nor is it a banking service, brokerage service, trading service, investment service or money management service

BTCUSD CONSOLIDATES BELOW RESISTANCE OF 120,000.00BTCUSD CONSOLIDATES BELOW RESISTANCE OF 120,000.00
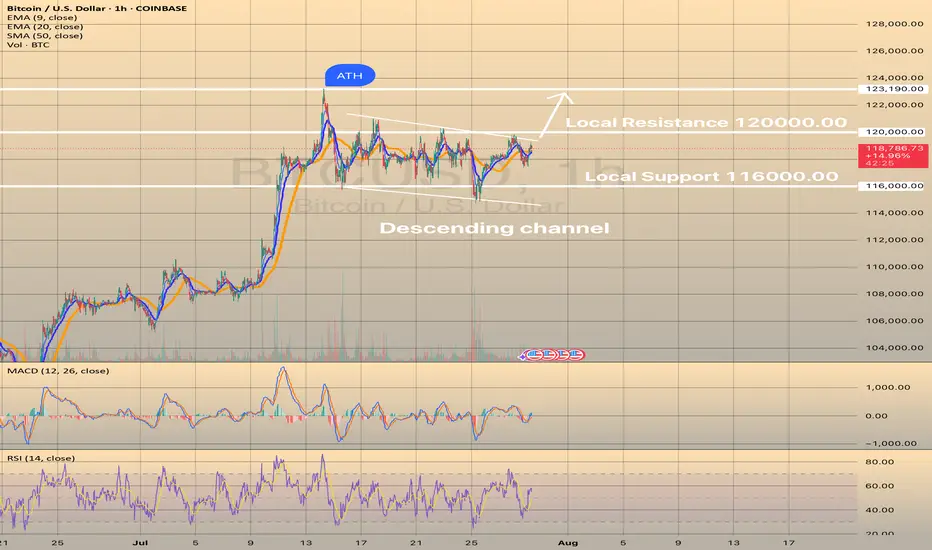
Today the price rebounded from the SMA50 on 4-h chart and continues to consolidate below the resistance level of 120,000.00. Yesterday there was a minor pullback from this level, still the price is pretty much at the same levels as yesterday. The recommendation is still the same: would be safer for long trade to wait for a breakout of the resistance (120,000.00) with first target of 123,190.30 (ATH). However, the asset shows nice bullish set up: RSI started to show some strength with price consolidation below resistance.
BTC: moment of TRUTHSeveral MA's are converging on the 4 hour chart.
Bitcoin is nearing the hour of Truth:
Are we going up from here?
or will we drop below these MA's and visit 114 to 113K ?
What do you think?

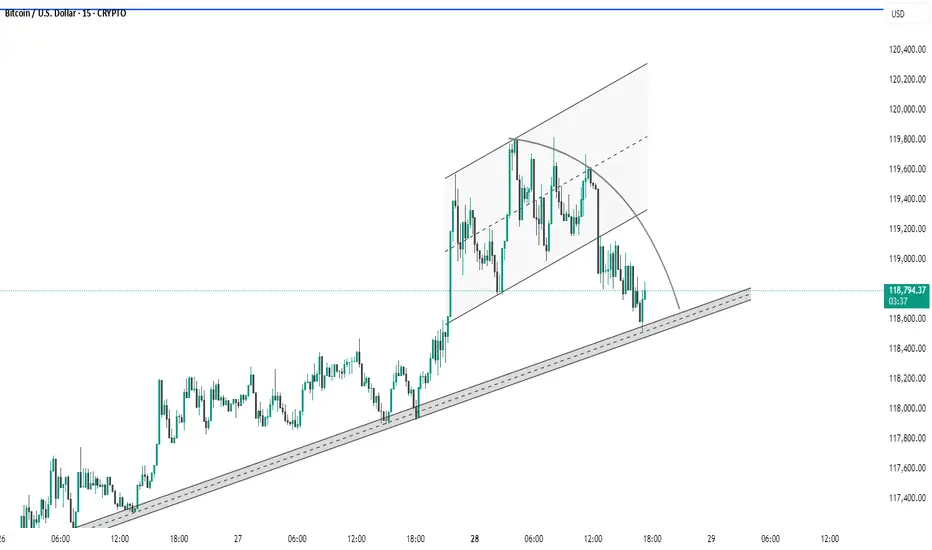
BTC #This 15-minute BTC/USD chart This 15-minute BTC/USD chart shows a rising channel formation that has recently been broken to the downside, indicating potential bearish momentum. The price is currently testing a long-term ascending trendline, acting as a critical support zone around $118,600–$118,800. A breakdown below this trendline could lead to further downside, while a bounce could suggest bullish continuation. The curved arc drawn also hints at a rounding top pattern, reinforcing possible short-term weakness.
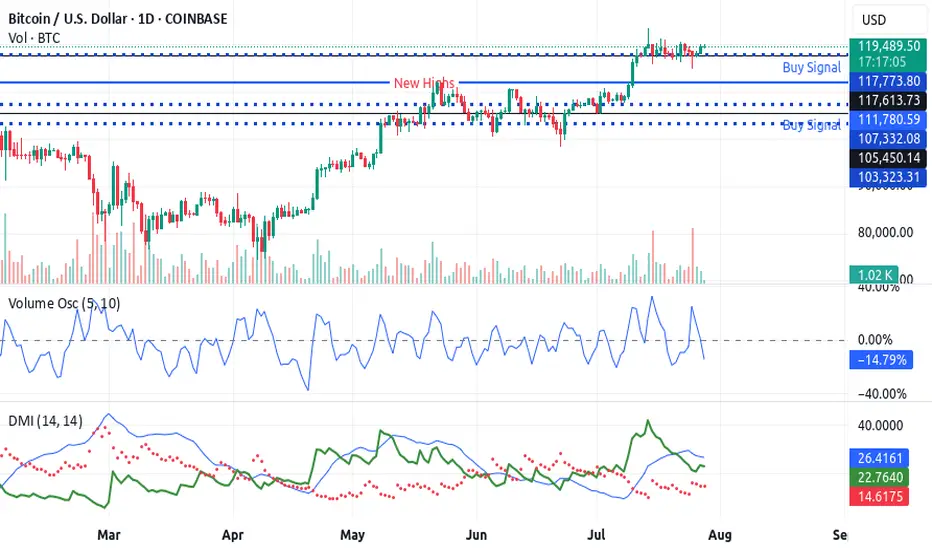
Bitcoin Set to Explode: 3 Powerful Buy Signals Active NowBitco🚀 Bitcoin is Flashing a Buy Signal — Rocket Booster Strategy in Play!
Bitcoin is currently in a strong buy zone, and the Rocket Booster Strategy confirms it’s go-time for traders and investors who know how to ride the wave.
✅ Top 3 Confirmations (Rocket Booster Strategy)
MACD Crossover – Bullish momentum is building. The MACD has crossed above the signal line, indicating a trend reversal.
Oscillator Rating: BUY – Leading oscillators such as the RSI and Stochastic show a bullish signal.
Candlestick Pattern: Rising Window / Bullish Engulfing – Clear bullish confirmation from price action.
This combination of technical signals is what we call the Rocket Booster Setup — a strategy that looks for lift-off moments just before a major upward thrust.
📈 Timeframe:
Daily timeframe only – This is a long-term investment setup, not a short-term scalp. Perfect for swing traders and HODLers.
⚠️ Disclaimer:
This is not financial advice. Always use a simulation/demo account before trading real money. Risk management is key.
BTCUSD Key Supply Zone Rejection – Bearish Target Mapped BTCUSD Key Supply Zone Rejection – Bearish Target Mapped (Educational Breakdown)
⸻
🧠 Technical Analysis (1H Chart):
• Range Structure: BTCUSD is currently trading within a well-defined consolidation range between the Resistance Zone ($119,850–$120,591) and the Support Zone ($116,937).
• Volume Profile (VRVP): Volume is noticeably thick near the mid-range, suggesting accumulation/distribution behavior. Price is struggling to break above the value area high near $120K.
• Resistance Rejection: After testing the upper supply zone, price failed to sustain bullish momentum and is showing signs of exhaustion – a possible sign of institutional selling.
• Target Zone: If price rejects this resistance again, a strong move toward the target level of $117,260 is expected. This aligns with:
• Mid-range liquidity sweep
• Low-volume node (LVN) below current price
• Fair Value Gap fill near $117,200–$116,900
⸻
🧩 Key Concepts Highlighted:
• Support & Resistance Mapping
• Volume Profile Readings
• Institutional Order Flow Bias
• Target Projection using Smart Money Concepts
⸻
⚠ Educational Insight:
This setup is a perfect example of how to combine Volume Profile + Price Action to identify liquidity traps and smart entries. Always wait for confirmation near key zones — not every level breaks!
⸻
✅ Trade Plan (Not Financial Advice):
• Watch for bearish engulfing/rejection wick at resistance
• Short entry below $119,000 with SL above $120,600
• Target: $117,260 / Final TP: $116,937 zone

BTC #Bitcoin (BTC/USD) on the 1-hour timeframe.The chart shows a bearish breakdown from a rounded top formation, indicating a shift from an uptrend to a downtrend in Bitcoin (BTC/USD) on the 1-hour timeframe. Price broke below a key support zone ($116,000), confirmed by a sharp red candle. The shaded area below ($112,500) suggests the next potential support or target zone. This pattern reflects weakening bullish momentum and possible further downside.

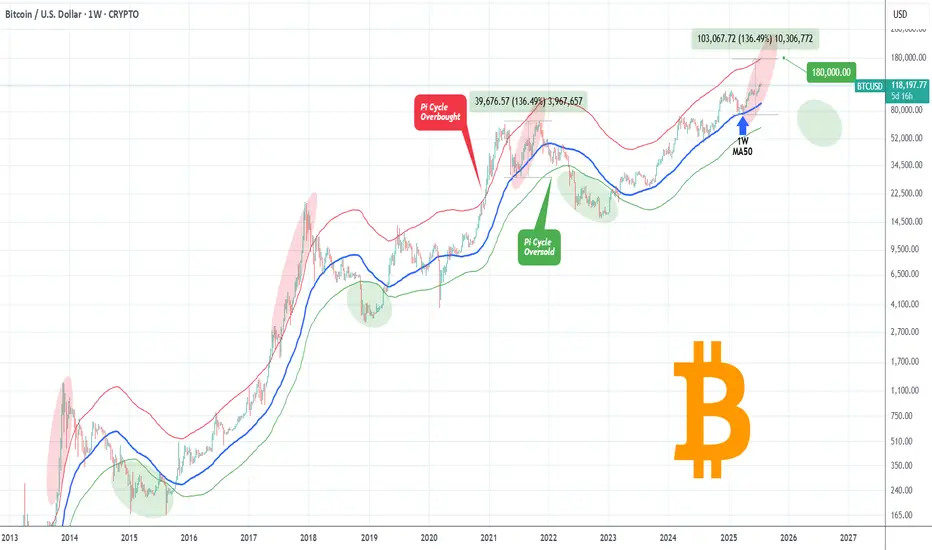
BITCOIN Isn't even overbought yet!Bitcoin (BTCUSD) has been rising strongly within a structured Channel Up pattern but even this consistent and steady uptrend since the April 07 2025 rebound on the 1W MA50 (blue trend-line) hasn't been enough to touch the Pi Cycle's overbought trend-line (red).
Throughout BTC's historic Cycles, all Tops have been priced after the overbought level was breached, which currently sits around $180000 (and rising). Given that the 4-year Cycle Theory won't change, even a repeat of the 'weaker' +136.49% last rally of the previous Cycle (Jun-Nov 2021), would take us to $180k exactly but still will be below the overbought trend-line. This just shows the immense upside potential of the market even at the current stages.
So do you think we will get that kind of rally? Feel free to let us know in the comments section below!
-------------------------------------------------------------------------------
** Please LIKE 👍, FOLLOW ✅, SHARE 🙌 and COMMENT ✍ if you enjoy this idea! Also share your ideas and charts in the comments section below! This is best way to keep it relevant, support us, keep the content here free and allow the idea to reach as many people as possible. **
-------------------------------------------------------------------------------
💸💸💸💸💸💸
👇 👇 👇 👇 👇 👇
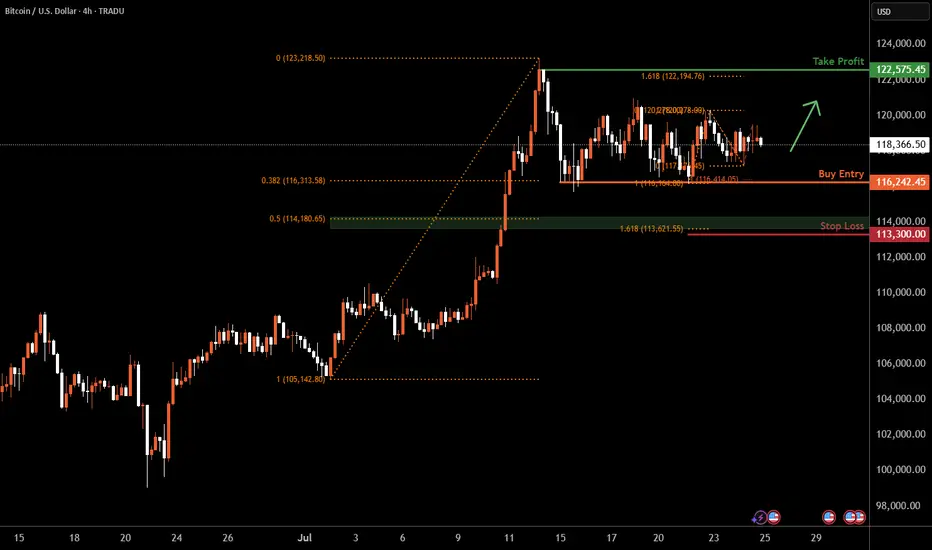
Bitcoin H4 | Falling toward a multi-swing-low supportBitcoin (BTC/USD) is falling towards a multi-swing-low support and could potentially bounce off this level to climb higher.
Buy entry is at 116,242.45 which is a multi-swing-low support that aligns with a confluence of Fibonacci levels i.e. the 38.2% retracement and the 100% projection.
Stop loss is at 113,300.00 which is a level that lies underneath a support zone that is identified by a confluence of Fibonacci levels i.e. the 50% retracement and the 161.8% extension.
Take profit is at 122,575.45 which is a swing-high resistance that aligns close to the all-time-high.
High Risk Investment Warning
Trading Forex/CFDs on margin carries a high level of risk and may not be suitable for all investors. Leverage can work against you.
Stratos Markets Limited (tradu.com ):
CFDs are complex instruments and come with a high risk of losing money rapidly due to leverage. 66% of retail investor accounts lose money when trading CFDs with this provider. You should consider whether you understand how CFDs work and whether you can afford to take the high risk of losing your money.
Stratos Europe Ltd (tradu.com ):
CFDs are complex instruments and come with a high risk of losing money rapidly due to leverage. 66% of retail investor accounts lose money when trading CFDs with this provider. You should consider whether you understand how CFDs work and whether you can afford to take the high risk of losing your money.
Stratos Global LLC (tradu.com ):
Losses can exceed deposits.
Please be advised that the information presented on TradingView is provided to Tradu (‘Company’, ‘we’) by a third-party provider (‘TFA Global Pte Ltd’). Please be reminded that you are solely responsible for the trading decisions on your account. There is a very high degree of risk involved in trading. Any information and/or content is intended entirely for research, educational and informational purposes only and does not constitute investment or consultation advice or investment strategy. The information is not tailored to the investment needs of any specific person and therefore does not involve a consideration of any of the investment objectives, financial situation or needs of any viewer that may receive it. Kindly also note that past performance is not a reliable indicator of future results. Actual results may differ materially from those anticipated in forward-looking or past performance statements. We assume no liability as to the accuracy or completeness of any of the information and/or content provided herein and the Company cannot be held responsible for any omission, mistake nor for any loss or damage including without limitation to any loss of profit which may arise from reliance on any information supplied by TFA Global Pte Ltd.
The speaker(s) is neither an employee, agent nor representative of Tradu and is therefore acting independently. The opinions given are their own, constitute general market commentary, and do not constitute the opinion or advice of Tradu or any form of personal or investment advice. Tradu neither endorses nor guarantees offerings of third-party speakers, nor is Tradu responsible for the content, veracity or opinions of third-party speakers, presenters or participants.

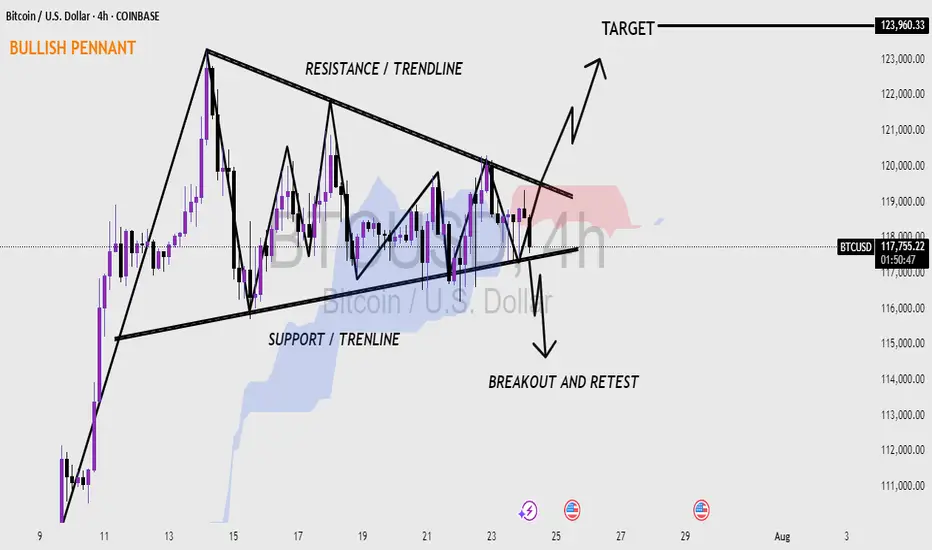
Bitcoin (BTC/USD) 4H CHART - BULLISH PENNANT PATTERN 📊 Bitcoin (BTC/USD) 4-Hour Chart – Bullish Pennant Formation
Bitcoin (BTC) forming a bullish pennant pattern on the 4-hour timeframe.
A bullish pennant often appears after a strong upward move, followed by a period of consolidation, and usually signals a continuation to the upside.
🔍 Key Highlights:
Pattern: Bullish Pennant – a continuation pattern that forms after a strong rally (flagpole), followed by a tightening price range.
Resistance Trendline: The upper black line showing lower highs — where price has repeatedly faced selling pressure.
Support Trendline: The lower black line showing higher lows — where buyers have been stepping in.
Breakout Zone: Price is nearing the apex of the pennant. A breakout above the resistance line would likely confirm the bullish move.
Target Projection: If the breakout is successful, the target is around $123,960, based on the height of the flagpole.
Breakout and Retest: The chart also shows a possible retest of the trendline after breakout, which is common and can offer a second entry point for traders.
Volume Watch: A valid breakout usually comes with increased volume. Monitoring this can help confirm the move.
📉 Downside Possibility:
If the price fails to break out and falls below the support trendline, it could invalidate the pattern and lead to a bearish move — possibly retesting the $110,000 area.
---
The market is at a decision point. If BTC breaks above the resistance and retests successfully, it could push toward $123K. However, traders should watch for both breakout confirmation and false moves.
Btcusd techinical analysis.Btusd techinical analysis next move posibale at h1 time frame not finchinal advice.

Protect Capital First, Trade SecondIn the world of trading, mastering technical analysis or finding winning strategies is only part of the equation. One of the most overlooked but essential skills is money management. Even the best trading strategy can fail without a solid risk management plan.
Here’s a simple but powerful money management framework that helps you stay disciplined, protect your capital, and survive long enough to grow.
✅1. Risk Only 2% Per Trade
The 2% rule means you risk no more than 2% of your total capital on a single trade.
-Example: If your trading account has $10,000, your maximum loss per trade should not exceed $200.
-This protects you from large losses and gives you enough room to survive a losing streak without major damage.
A disciplined approach to risk keeps your emotions under control and prevents you from blowing your account.
✅2. Limit to 5 Trades at a Time
Keeping your number of open trades under control is essential to avoid overexposure and panic management.
-A maximum of 5 open trades allows you to monitor each position carefully.
-It also keeps your total account risk within acceptable limits (2% × 5 trades = 10% total exposure).
-This rule encourages you to be selective, focusing only on the highest quality setups.
Less is more. Focus on better trades, not more trades.
✅3. Use Minimum 1:2 or 1:3 Risk-Reward Ratio
Every trade must be worth the risk. The Risk-Reward Ratio (RRR) defines how much you stand to gain compared to how much you’re willing to lose.
-Minimum RRR: 1:2 or 1:3
Risk $100 to make $200 or $300
-This allows you to be profitable even with a win rate below 50%.
Example:
If you take 10 trades risking $100 per trade:
4 wins at $300 = $1,200
6 losses at $100 = $600
→ Net profit = $600, even with only 40% accuracy.
A poor RRR forces you to win frequently just to break even. A strong RRR gives you room for error and long-term consistency.
✅4. Stop and Review After 30% Drawdown
Drawdowns are a part of trading, but a 30% drawdown from your account's peak is a red alert.
When you hit this level:
-Stop trading immediately.
-Conduct a full review of your past trades:
-Were your losses due to poor strategy or poor execution?
-Did you follow your stop-loss and risk rules?
-Were there changes in the market that invalidated your setups?
You must identify the problem before you continue trading. Without review, you risk repeating the same mistakes and losing more.
This is not failure; it’s a checkpoint to reset and rebuild your edge.
Final Thoughts: Survive First, Thrive Later
In trading, capital protection is the first priority. Profits come after you've mastered control over risk. No trader wins all the time, but the ones who respect risk management survive the longest.
Here’s your survival framework:
📉 Risk max 2% per trade
🧠 Limit to 5 trades
⚖️ Maintain minimum 1:2 or 1:3 RRR
🛑 Pause and review after 30% drawdown
🧘 Avoid revenge trading and burnout
Follow these principles and you won't just trade, you'll trade with discipline, confidence, and longevity.
Cheers
Hexa

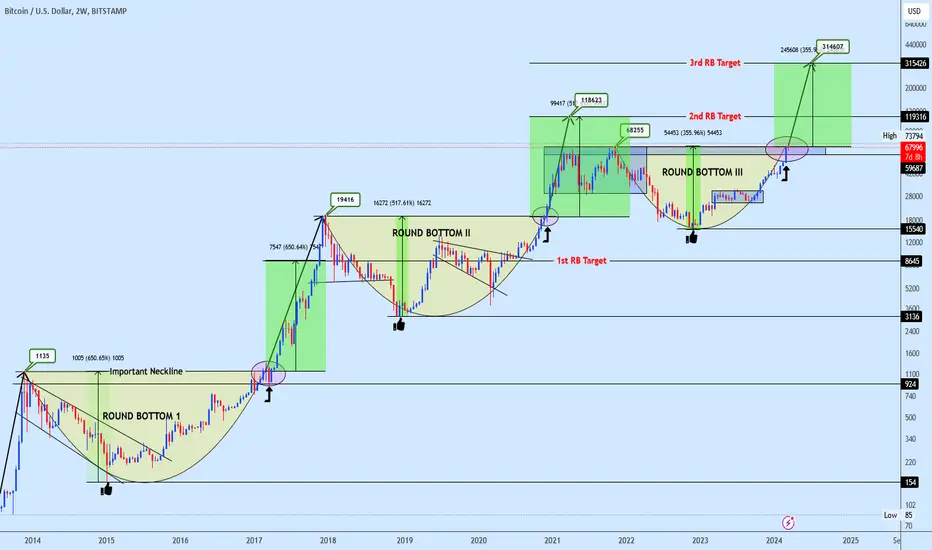
Bitcoin massive bullrun incoming!!!If historical patterns serve as a guide, we consistently observe the formation of a rounding bottom pattern on BTC preceding each bull run.
Presently, it appears we are on the brink of significant BTC movements this year. Notably, a critical support level indicated on the chart stands at 59k, extrapolated from historical data.
The target for the rounding bottom formation is distinctly delineated on the chart. This post will be continuously updated in a timely manner.
Do share your insights regarding this pattern.
Will cryptos lose their appeal, as more regulation comes in?In this new world, where governments and financial institutions are getting more and more interested in cryptos, will those start losing their appeal?
Let's take a look at CRYPTO:BTCUSD
MARKETSCOM:BITCOIN
CRYPTO:ETHUSD
MARKETSCOM:RIPPLE
Let us know what you think in the comments below.
Thank you.
75.2% of retail investor accounts lose money when trading CFDs with this provider. You should consider whether you understand how CFDs work and whether you can afford to take the high risk of losing your money. Past performance is not necessarily indicative of future results. The value of investments may fall as well as rise and the investor may not get back the amount initially invested. This content is not intended for nor applicable to residents of the UK. Cryptocurrency CFDs and spread bets are restricted in the UK for all retail clients.

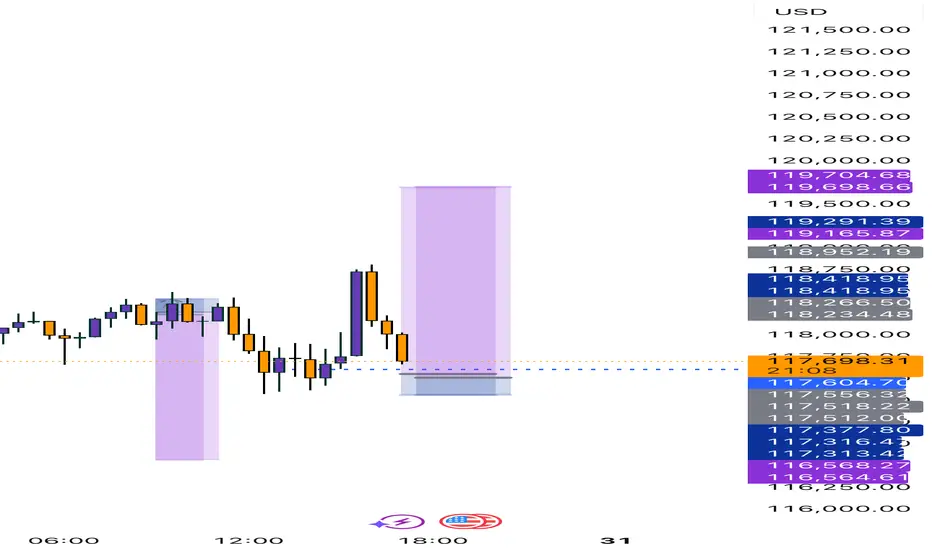
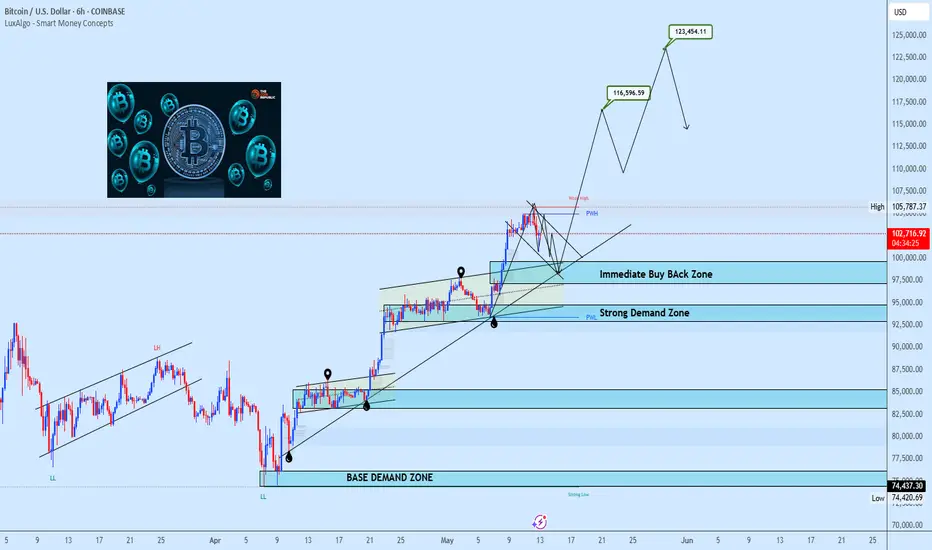
BTC Bulls Defend Key Zone Eyes on $123K Breakout ExtensionBitcoin has successfully completed a breakout above the prior weekly high structure, followed by a healthy pullback which is currently unfolding into a bullish pennant formation. The key highlight is how price is retesting the neckline zone with precision, which now doubles as a strong immediate buyback zone.
The reaction from this level is already showing strong bullish momentum, with price gearing up to challenge the previous ATH. A breakout above that resistance should unlock the path toward the projected $116.5k and $123.4k targets as shown on the chart. Failure to hold the Immediate Buyback Zone opens the door toward the Strong Demand Zone, which remains a valid re-accumulation point within this bullish cycle.
Stay sharp. The structure remains intact unless the neckline fails decisively.
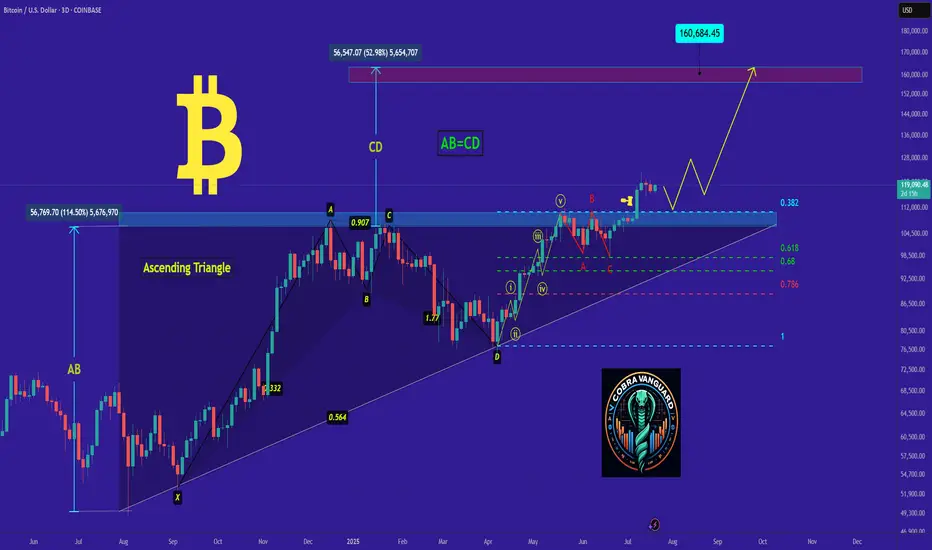
𝐛𝐢𝐭𝐜𝐨𝐢𝐧's Situation, A Comprehensive Analysis !!!As I said, Bitcoin broke the triangle, and now with a slight price correction, it could surge to $160,000, and you still think I'm joking!!
Previous analysis