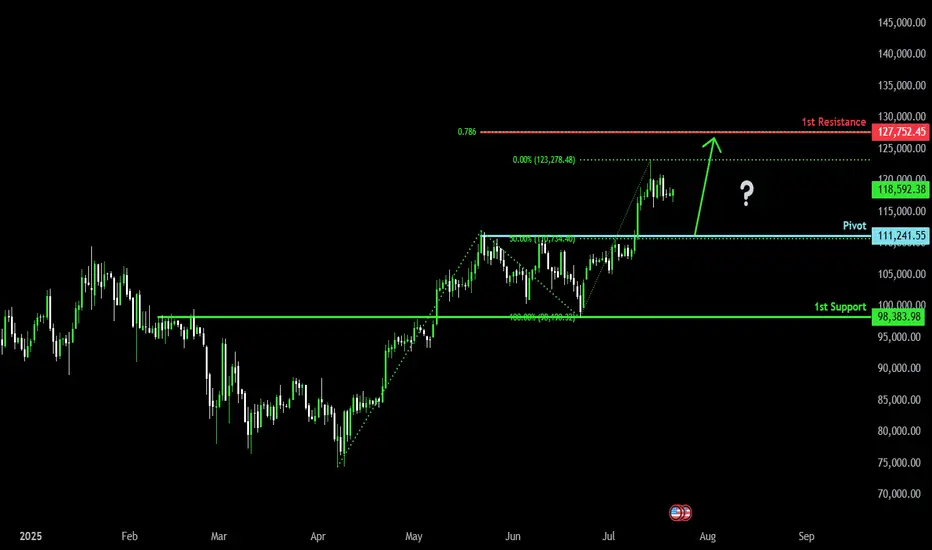
Bullish bounce?The Bitcoin (BTC/USD) is falling toward the pivot and could bounce to the 1st resistance.
Pivot: 111,241.55
1st Support: 98,383.98
1st Resistance: 127,752.45
Risk Warning:
Trading Forex and CFDs carries a high level of risk to your capital and you should only trade with money you can afford to lose. Trading Forex and CFDs may not be suitable for all investors, so please ensure that you fully understand the risks involved and seek independent advice if necessary.
Disclaimer:
The above opinions given constitute general market commentary, and do not constitute the opinion or advice of IC Markets or any form of personal or investment advice.
Any opinions, news, research, analyses, prices, other information, or links to third-party sites contained on this website are provided on an "as-is" basis, are intended only to be informative, is not an advice nor a recommendation, nor research, or a record of our trading prices, or an offer of, or solicitation for a transaction in any financial instrument and thus should not be treated as such. The information provided does not involve any specific investment objectives, financial situation and needs of any specific person who may receive it. Please be aware, that past performance is not a reliable indicator of future performance and/or results. Past Performance or Forward-looking scenarios based upon the reasonable beliefs of the third-party provider are not a guarantee of future performance. Actual results may differ materially from those anticipated in forward-looking or past performance statements. IC Markets makes no representation or warranty and assumes no liability as to the accuracy or completeness of the information provided, nor any loss arising from any investment based on a recommendation, forecast or any information supplied by any third-party.
BTCUSD trade ideas
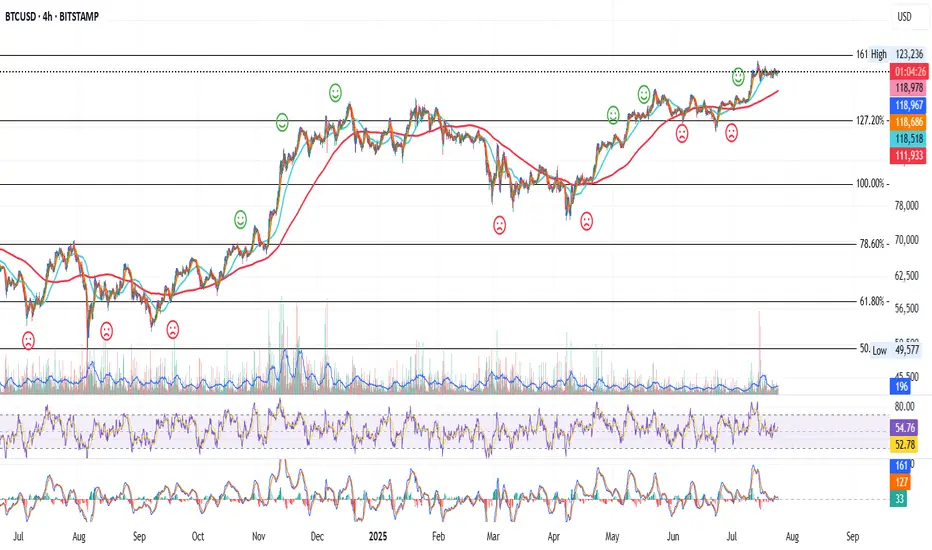
BTC 4H – Dance with the 200MA
Bitcoin continues its strong relationship with the 200MA.
Each time price dips below it, fear spikes — but bounces off key Fib levels have followed, with price then riding higher alongside the 200MA.
Right now, price is caught between the 200MA and a nearby Fib level.
Here’s what could happen next:
– Price flips the Fib into support, ideally with help from a rising 200MA.
– Price waits for the 200MA to catch up, and they break the Fib together.
– Or, we get another panic dip, and the bounce comes after another test from below.
Whichever path it takes, we’ll be here watching it unfold.
Always take profits and manage risk.
Interaction is welcome.
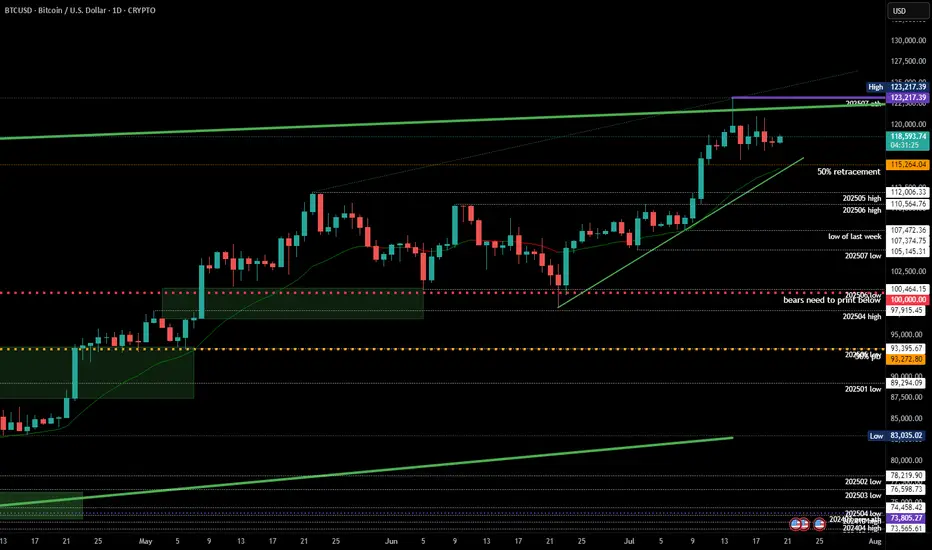
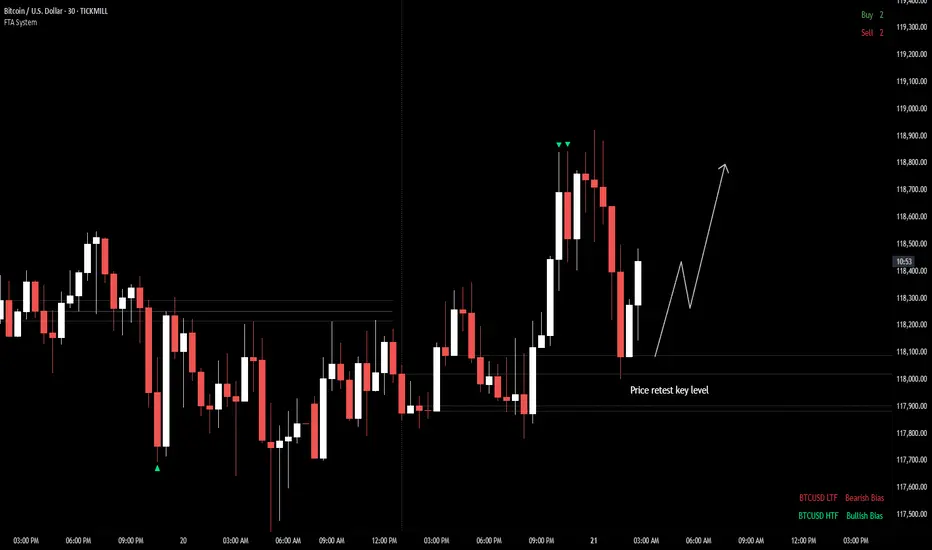
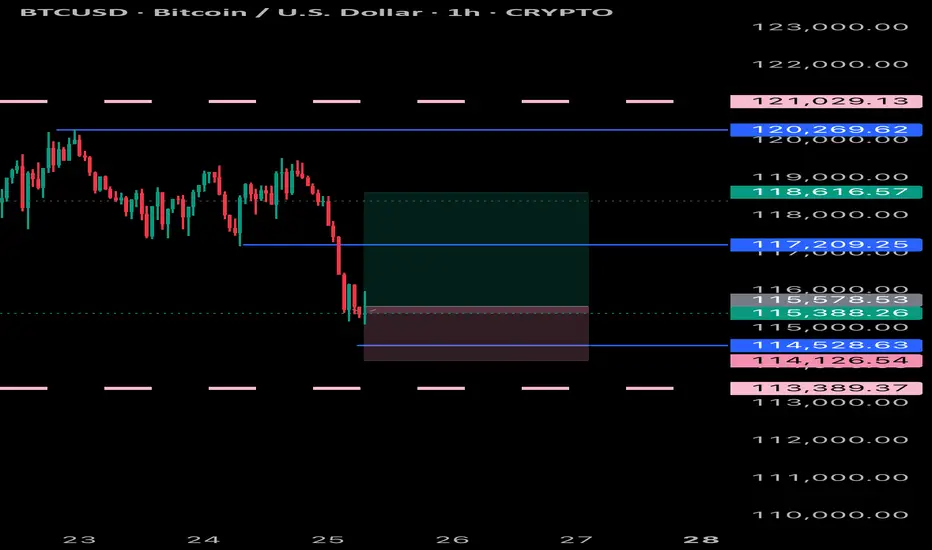
BTCUSD DROPPED BELOW LOCAL SUPPORTBTCUSD DROPPED BELOW LOCAL SUPPORT📉
Today bitcoin dropped below the level of 116,000.00 on high volume. However, the price didn't go somewhere far downwards and consolidates slightly below this level. Presumably, descending channel may be formed.
What is a descending channel?
A descending channel is a bearish chart pattern formed by two downward-sloping parallel trendlines connecting lower highs and lower lows in a pair’s price, indicating a consistent downtrend. It shows sellers are in control, with prices declining within a defined range.
Here I presume the price to rebound from lower border of the descending channel with possible movement towards upper border slightly below the 120,000.00 level.

#202529 - priceactiontds - weekly update - daxGood Day and I hope you are well.
comment: Prior weeks close was 24332 and this was it was 24386. Bulls need to continue with higher lows and bears need to break below 24000 for lower prices. Not more magic to.
current market cycle: bull wedge
key levels for next week: 24000 - 25000
bull case: Bulls are still in control until we print lower lows again. We have 2 potential bull trend lines close to the daily ema and that’s around 24200 and will be my line in the sand for bulls next week. Below, chances of 24000 go up big time. If we stay above 24300, there is no reason we can not test back up to 24500 and above that we will likely try 24700+ again.
Invalidation is below 24000
bear case: Bears need a lower low below 24000. That’s really all there is to it. As of now the selling on Friday was decent but it’s not enough to expect follow-through selling. Below 24000 I think we can test the 50% retracement at 23900 but I’d be surprised if we go lower. Only an event could trigger that. Lower targets would be as marked on the chart.
Invalidation is above 24749
short term: Neutral. I want follow-through selling but will likely won’t get it. It’s still a bull wedge until we have a daily close below 24000.
medium-long term from 2025-06-29: Bull surprise last week but my targets for the second half of 2025 remain the same. I still expect at least 21000 to get hit again this year. As of now, bulls are favored until we drop below 23000.
BTC/USD — Potential Bullish BreakoutBitcoin is currently retesting a key intraday level after pulling back from recent highs. If price continues to hold above this level, potential for break above previous highs.
As long as the structure holds and continue bullish momentum. However, if price slips back below the level with momentum, this scenario may be invalidated.
📌 Bias: Neutral to Bullish
📌 Timeframe: Intraday / Short-term
📌 Key Level to Watch: 118K
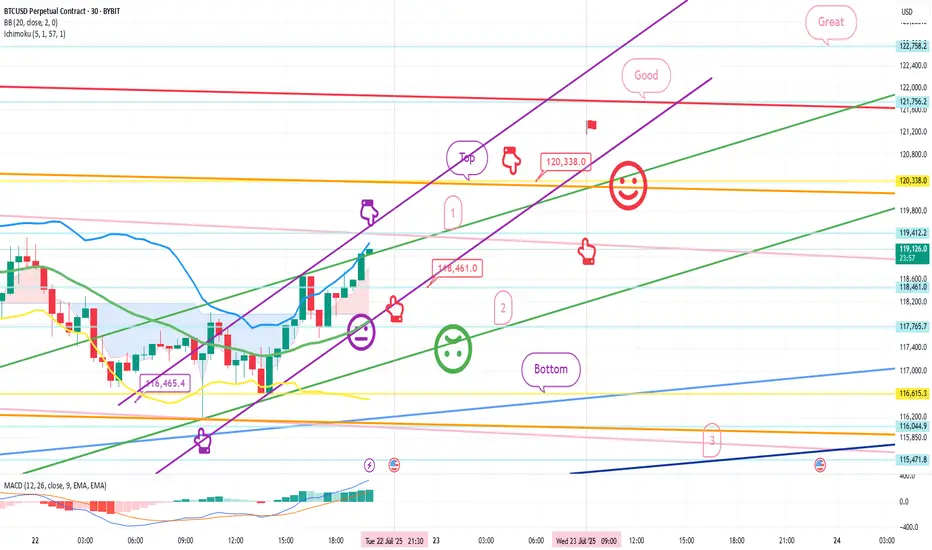
July 22 Bitcoin Bybit chart analysisHello
It's a Bitcoin Guide.
If you "follow"
You can receive real-time movement paths and comment notifications on major sections.
If my analysis was helpful,
Please click the booster button at the bottom.
This is Bitcoin's 30-minute chart.
Nasdaq indicators will be released at 9:30 in a little while.
Although Bitcoin's mid-term pattern is broken,
it looks like a strong upward trend based on signals and candlestick positions.
In the case of Nasdaq, the 6-hour and 12-hour charts MACD dead cross is in progress,
and even if there is no plunge and only a sideways movement,
it seems likely that today's strategy will be successful.
In the bottom left, from the analysis article on the 18th,
the final long position entry point of $116,465.4 Bottom
is connected as is.
*Red finger movement path
One-way long position strategy
1. $118,461.9 long position entry section / green support line breakout, stop loss price
2. $120,338 long position 1st target -> Good, Great in order of target price
See the 1st section at the top as a touch section for an upward wave rather than a short position entry,
and if this section breaks through right away, an upward trend can be connected.
If the purple parallel line support line is maintained without breaking away,
there is a possibility of a vertical rise.
If the top section is touched,
after the first liquidation,
it would be good to use the 1st section to re-enter a long position.
The 2nd section at the bottom is important,
and if it is pushed to this section according to the movement of Nasdaq today,
it can fall strongly.
Please check the real-time support line shape.
From the breakout, Bottom -> 3 sections are open.
If you touch the 3rd section after tomorrow, the mid-term pattern will be restored.
This is the 12+ day section.
Up to this point, I ask that you simply use my analysis for reference and use only.
I hope that you will operate safely with the principle of trading and stop loss.
Thank you.

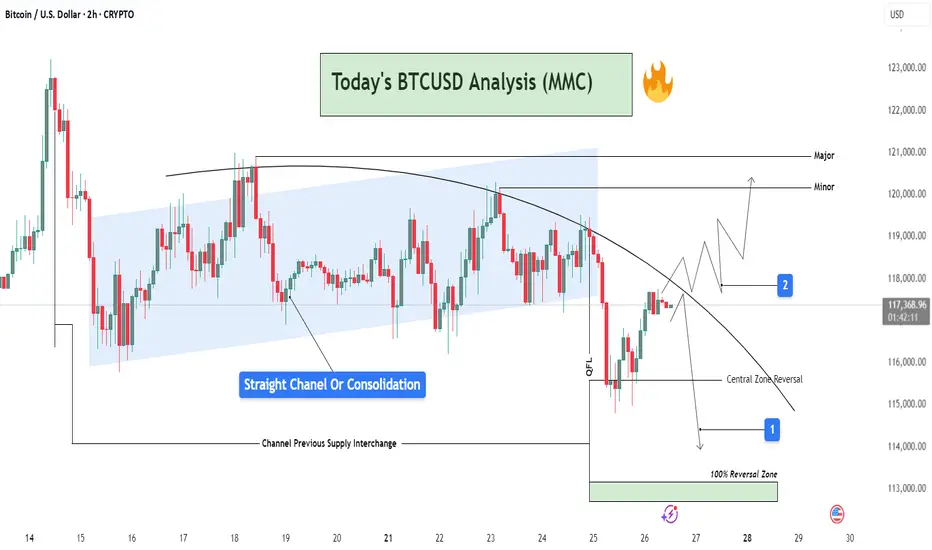
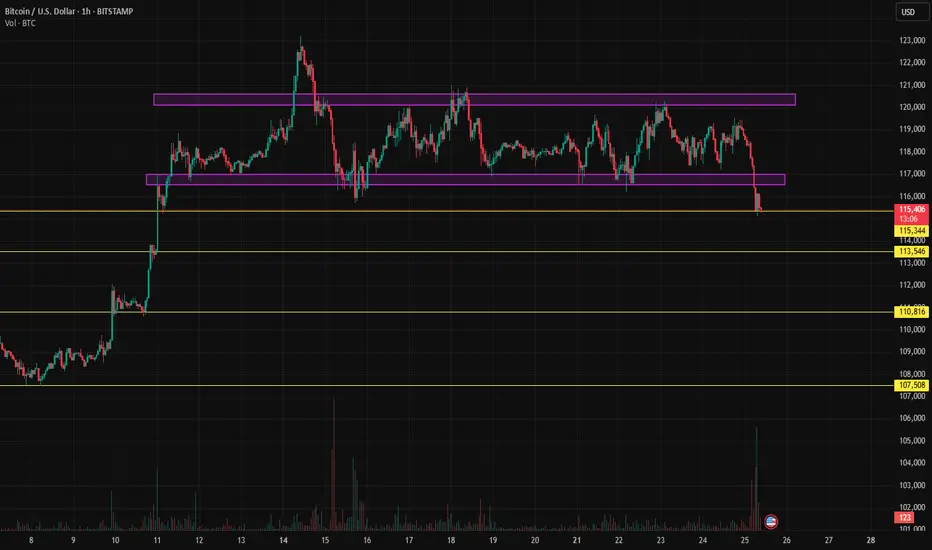
BTCUSD Analysis : Channel Break + QFL Setup | Structure Analysis📊 Chart Overview
This 2H BTCUSD chart reveals a comprehensive view of market behavior transitioning from a phase of consolidation into a potential breakout or further rejection. The price action is analyzed inside a parallel channel, transitioning into a curved resistance path, which is currently governing the market structure.
🔵 Phase 1: Consolidation Inside a Straight Channel
Price has respected a clear ascending channel (highlighted in blue) from July 16 to July 24.
This phase shows a range-bound movement with defined supply and demand zones.
Labelled as “Straight Channel or Consolidation”, this represents a potential accumulation/distribution zone.
The Channel Previous Supply Interchange marks an important S/R flip zone, now serving as a key reference for future reactions.
🔻 Phase 2: Break of Structure & Curved Resistance
Price broke down below the channel support and is now respecting a downward curved trendline.
This indicates a shift in momentum from neutral to bearish, forming lower highs.
A sharp drop occurred post-channel exit, marking a QFL (Quasimodo Failure Level) area—hinting at smart money involvement or liquidation hunt.
🔁 Reversal Scenarios & Key Levels
There are two possible future paths visualized:
🟥 Scenario 1: Bearish Continuation
Price respects the curved trendline, failing to break resistance.
A rejection near the current region (~117.5k) could lead price back toward:
Central Zone Reversal near 115,000 USD
Further into the 100% Reversal Zone (green zone) near 113,500–114,000 USD
Ideal for short entries after clear rejection confirmations.
🟩 Scenario 2: Bullish Breakout
Price breaks and sustains above the curved resistance.
Temporary resistance seen at Minor level (~120,000 USD), followed by Major resistance near 121,000 USD.
This scenario requires bullish volume and reclaim of structure, invalidating the short bias.
🧠 Strategic Viewpoint & Trade Mindset
Market is at a decision point—either confirming a bearish rejection from dynamic resistance or invalidating it for a bullish reversal.
Patience is key; wait for either:
A failed breakout attempt (short opportunity), or
A confirmed breakout and retest (long opportunity).
Use lower timeframes (15m–1h) for execution once direction is confirmed.
Healthy BTC Retrace in Trend Next Breakout Target 112K Then 122KBitcoin continues to respect the bullish market highlighted in our previous analysis, where the AB=CD structure pointed toward significant upside potential. The market has since retraced into a well defined re-accumulation zone, aligning precisely with prior expectations.
Price has held firmly above the round figure support ($100k), with the current structure confirming a healthy correction within trend.
As long as the re-accumulation zone between 104k–107k holds, momentum remains skewed to the upside. The projected 2.618 extension sits near the 122k mark, where the current setup aims to complete.
The broader structure still respects higher timeframe demand and ascending channel boundaries, keeping bullish continuation valid unless 100k decisively breaks. Watch for confirmation breakout above 112k to activate the next leg of the move.
If you found this analysis insightful, drop a like to support the work and leave a comment with your perspective whether you agree, disagree, or have an alternate scenario in mind. Let's grow together through collective insights.

$BTCUSD bullish short term before Intermediary Wave 1 pullbackSupercycle (years): Wave (III)
Cycle (months): Wave III
Primary (weeks): Wave ((3))
Intermediate (days): Wave (1)
Minor (4H): Wave 5
Looks bullish in the short term.
Let's Go!

$BTCUSDT: Fictitious Fractal 136KSo. I see we are having a relatively difficult time.
My expectations are in this range for the next appx. 125 days - 365 days.
Downside: 68.6k-69.9k
Topside: 100k to 136k (round to 150k)
I drew this fractal by hand and I want to watch it closely.
I expect in the next few weeks we hit 100k and then do a nice rug to 69k range.
This is probably wrong.
I pretty much extrapolated the red brush circle into a weeks long fractal.
I am longing all the dips to 68k.
Enjoy.
Mr. Storm.
Btcusd techinical analysis.Btcusd techinical analysis next move posibale at h1 time.not finchinal advice.

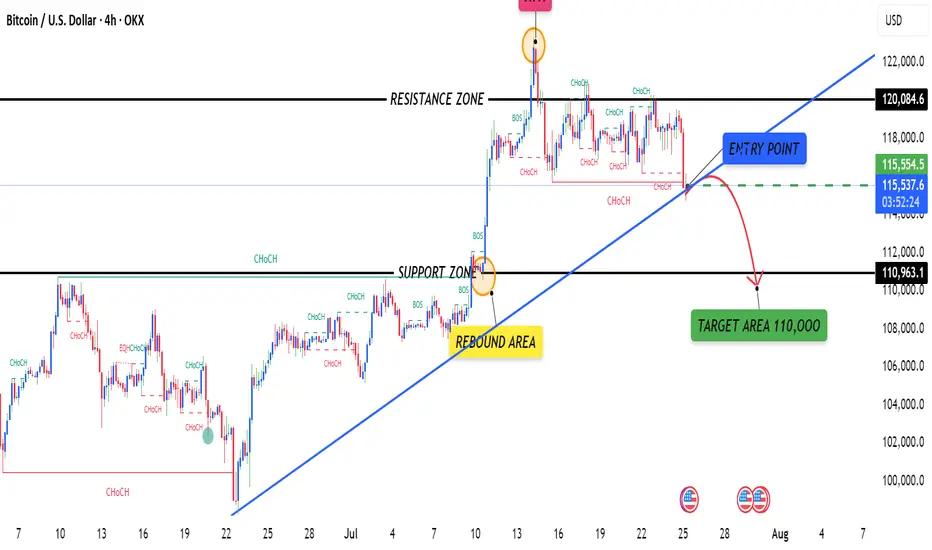
Reversal Zone: BTC Eyes $124.5K After Potential Liquidity SweepTechnical Analysis (4H Chart)
🔷 Pattern Overview:
Rising Channel: BTC is still respecting a long-term upward channel (black parallel trendlines).
Falling Wedge (Short-Term): Inside the channel, a falling wedge is forming—typically a bullish continuation signal.
The wedge is nearing completion, with a possible fakeout below support to the $110,500–$110,600 zone before a sharp rally.
✅ Price Expectation:
Bear Trap Likely: Price may dip to $110.5K support, triggering stop-losses.
Bullish Breakout Setup: If price rebounds strongly from $110K area, the wedge + channel pattern supports a move toward $124.5K–$125K.
Invalidation: Clean break below the channel and $110K could invalidate the bullish scenario.

BTCUSD has boken up Trendline and SupportBTCUSD has boken up Trendline and Support, It may retrace futhur before regaining bullishness.
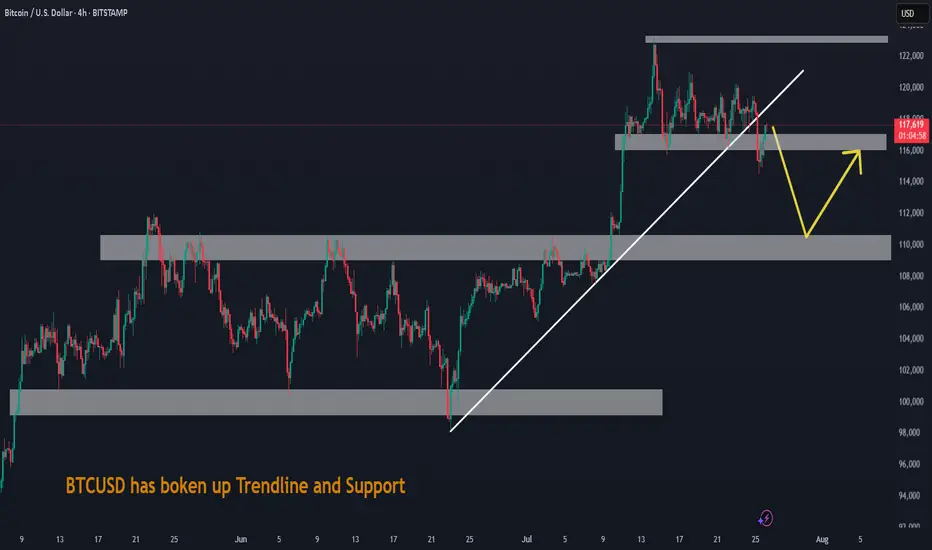
going lower or bouncing on resistance? market is respecting key support/resistance or channel boundaries. These points often become decision zones where big moves occur.
Signs this could be a fakeout:
BTC wicks above a resistance or below a support with little follow-through
Volume spikes only on the wick, then dies quickly
Price reverses back into the range soon after breaking it
If BTC recently broke a trendline with low volume, it smells like a trap move — a liquidity grab.
If it’s testing support again after failing to rally, and volume is increasing on red candles, a leg down is possible.
However, macro trend is still up unless we lose a major higher low (say, sub-$60k or sub-$56k depending on your chart).
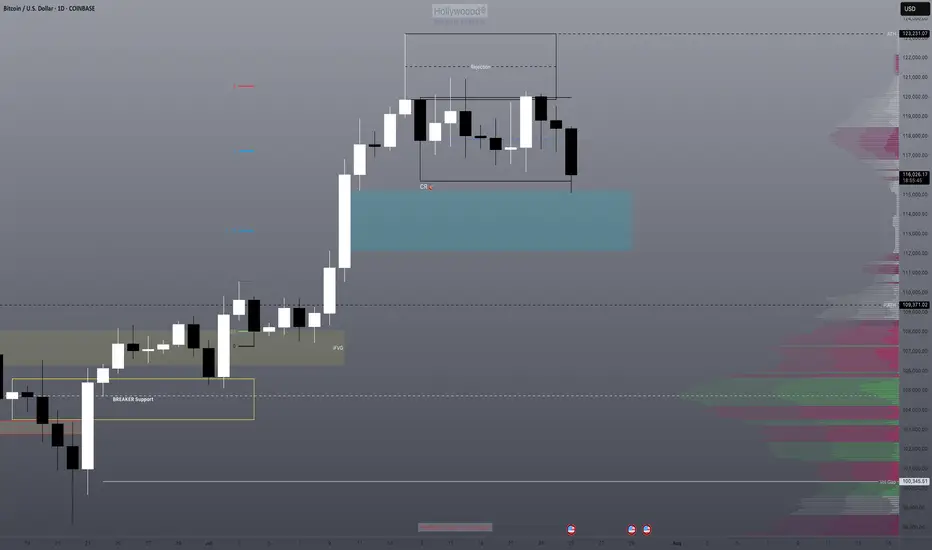
Bitcoin (BTC): Accumulation Before New All-Time-High?After the recently formed ATH near the $123K zone, we have had a decent accumulation following after that, which stabilized the Bollinger Bands and RSI, giving us a new potential for another ATH to form from here.
Now our target was $120K, which we filled quickly; now it is the $140K zone mainly so we are keeping our attention there. We are keeping the bullish game plan as long as we are above the middle line of the Bollinger Bands (which currently is in a bullish trend). (That green line is the middle line, btw).
Swallow Academy

bitcoin chart analysisbitcoin chart analysis on daily time frame
here a buy zone that indicated by box and line.
and on chart bitcoin bullish but lower time frame btc is berrish.
Bitcoin: The Key Buying Level Near $112K Liquidity ZoneFenzoFx—Bitcoin consolidation extended into the bullish FVG, trading near $115,470.0. The 4-hour chart shows an indecisive candle, while the 200-day MA points upward, signaling bullish control.
The bullish outlook remains intact if price holds above the critical $112,000.0 support. However, current bearish momentum may drag price toward this level, potentially filling nearby FVGs.
Traders should monitor $112,000.0 for bullish setups, including break of structure and long-wick bullish candles.

BTCUSD 4HOUR TIME FRAME ANALYSISCurrently bearish on the 4-hour chart with lower highs and lower lows forming consistently.
Price Action: BTCUSD recently broke below a key support zone around 116,000, turning it into a fresh resistance. The market shows bearish momentum as price fails to reclaim above that zone.
Candlestick Patterns: Multiple bearish engulfing candles confirm selling pressure near the 115,500–116,000 area.
BTCUSD BUYING can expect a bullish move from bitcoin as it has dropped a fair amount and can extract a reversal to the up side due to being oversold
How far will Bitcoin drop? 115? 113? 110? Or even lower?Bitcoin has finally managed to break out of the range after nearly two weeks. Now we need to see whether this breakout gets confirmed or not, and if it does, what volume of selling it will face.
Will the low of this BTC zone be used as a buy point?We have an imbalance high being tested. We know that this also represents the consolidation range low where both TPs and long entries will be triggered.
Will this be enough to send us back bullish or will be need further correction of the imbalance? I think there's a high probability of this with DXY also running into it's daily bearish imbalance range.
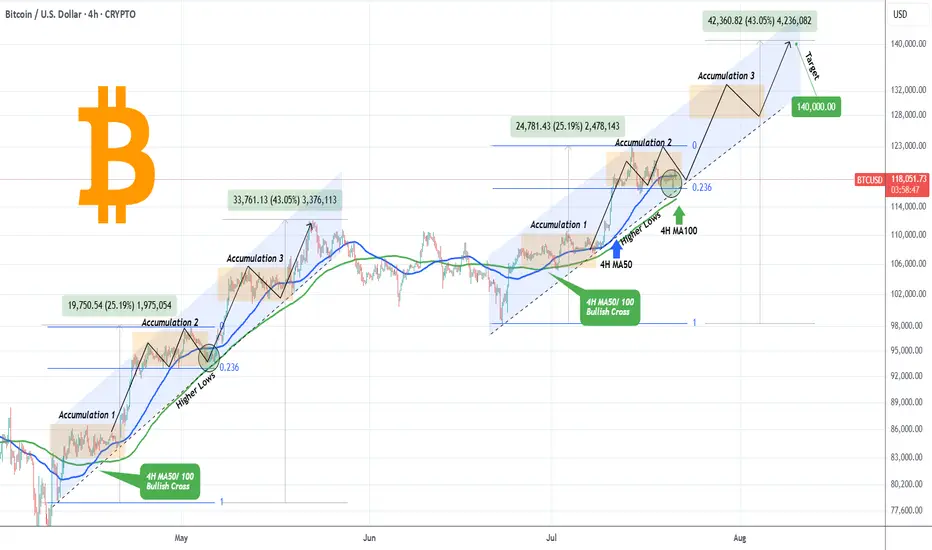
BITCOIN Accumulation Phase almost completed. Higher from here?Bitcoin (BTCUSD) is making a strong rebound on the bottom of its 1-month Channel Up and this analysis is in direct response to the one we published last week (July 15, see chart below), where we called this one-week consolidation:
We won't be going into too much detail then, as you can see the price made the Accumulation 2 Phase, after an identical +25.9% Bullish Leg, same as April's and by breaking below the 4H MA50 (blue trend-line), it hit the 0.236 Fibonacci retracement level.
As per the May 05 fractal hit, as long as the 4H MA100 (green trend-line) supports this Channel Up, the market should start Bullish Leg 3 towards Accumulation Phase 3 and eventually peak at around +43% from its start at $140000.
Do you think the pattern will continue to be repeated in the exact same order? Feel free to let us know in the comments section below!
-------------------------------------------------------------------------------
** Please LIKE 👍, FOLLOW ✅, SHARE 🙌 and COMMENT ✍ if you enjoy this idea! Also share your ideas and charts in the comments section below! This is best way to keep it relevant, support us, keep the content here free and allow the idea to reach as many people as possible. **
-------------------------------------------------------------------------------
💸💸💸💸💸💸
👇 👇 👇 👇 👇 👇