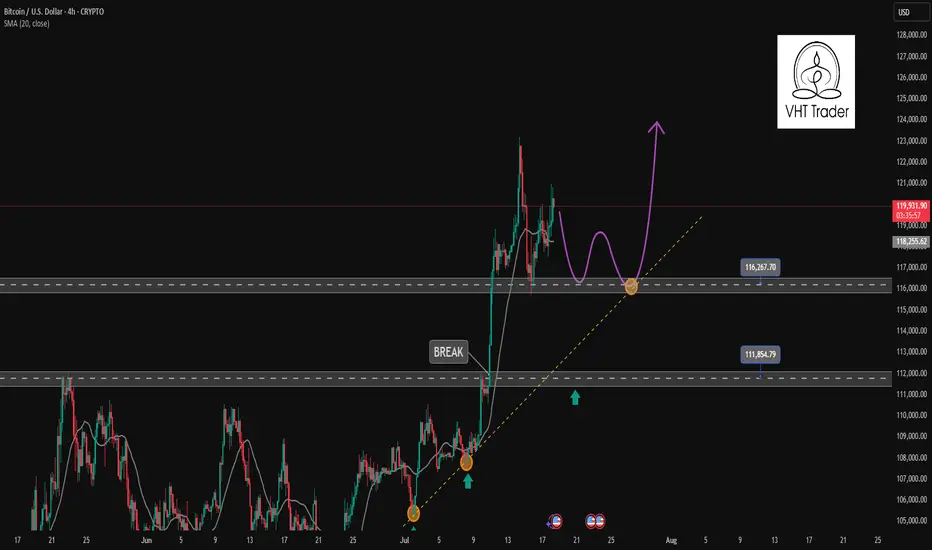
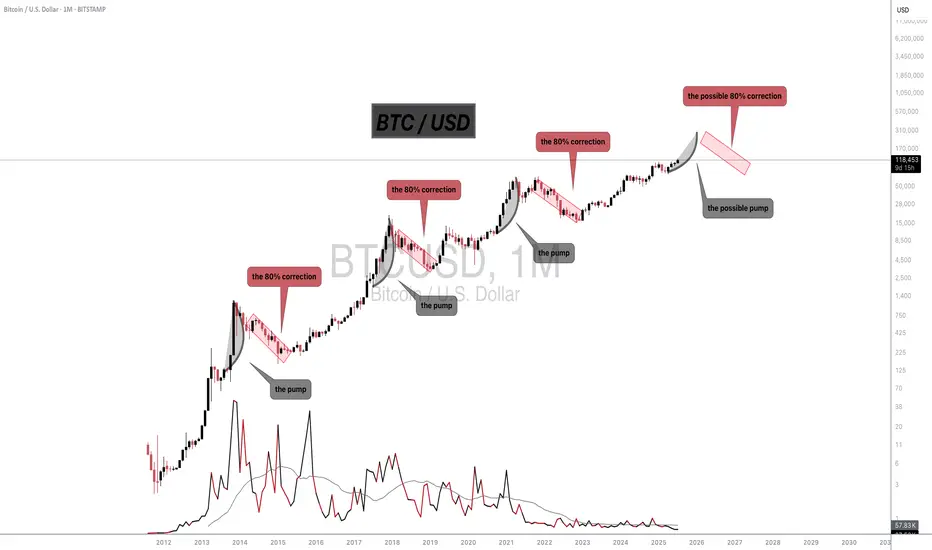
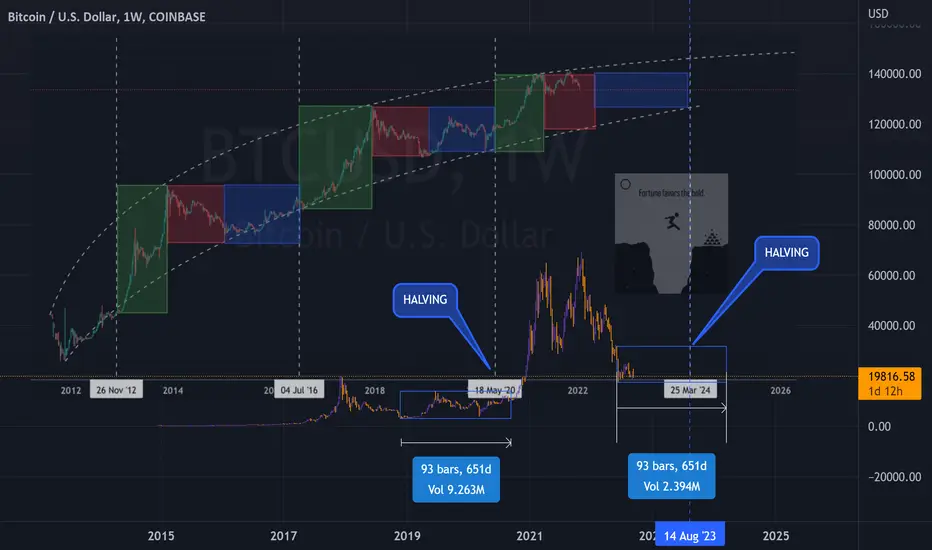
BITCOIN - Price can bounce up from support line to $125000Hi guys, this is my overview for BTCUSD, feel free to check it and write your feedback in comments👊
For a long time, the price was trading sideways inside a wide flat range between the $99000 support area and the $112000 resistance level.
After accumulating volume, bitcoin made a strong upward impulse and performed a breakout, pushing above the top of the flat.
Following this movement, the price action began to form a rising wedge pattern, moving between its clear support and resistance lines.
Recently, price tested the resistance line of the wedge and then started a predictable correction back down towards support.
Now, BTC is approaching the support line of the wedge, which aligns with the important horizontal support area around $112000-$113500.
I expect that the price can test this support line and then bounce up to the $125000 resistance line of the wedge.
If this post is useful to you, you can support me with like/boost and advice in comments❤️
Disclaimer: As part of ThinkMarkets’ Influencer Program, I am sponsored to share and publish their charts in my analysis.
BTCUSD trade ideas

BTCUSDBUY Call retest must
Quick trade setup 30min
Risk free your trade once reach point metioned
Looks bullish move

BTCStill range bound but the breakout is inevitable
Imho these are BTC last big moves.
And we get to do it all over again

Bitcoin profit booking at this Price level 119675 Bitcoin is making higher high and giving flag fathernow in a range bound zone due to profit booking and and Here we may take a short trade sell 119500, sl-121800, tgt 1108500, 99500🚩🚩

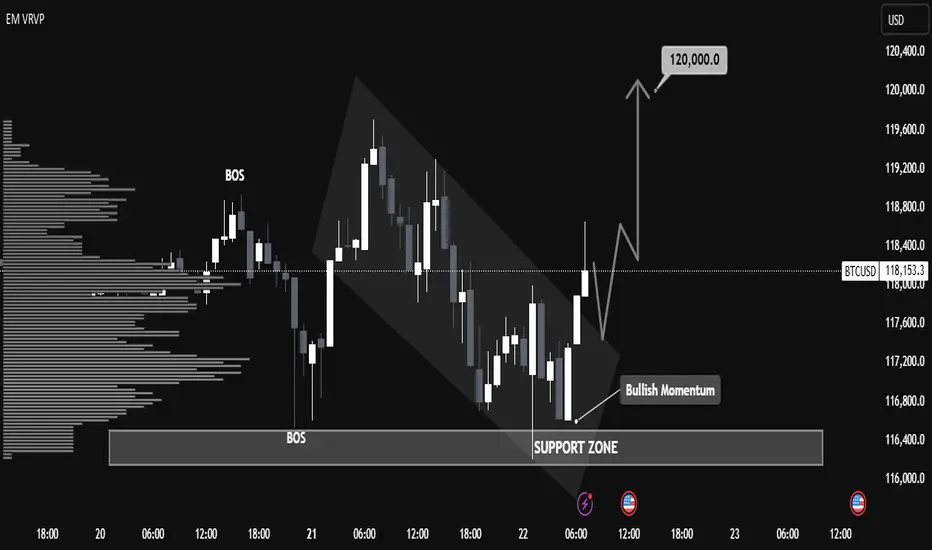
"BTC/USD Breakout Strategy: Identifying Bullish Momentum BTC/USD Technical Analysis – July 22, 2025
📈 Market Structure Overview:
The chart illustrates a recent Break of Structure (BOS) both to the upside and downside, indicating volatility and a shift in market sentiment. The price action formed a descending channel, followed by a breakout with strong bullish candles, suggesting a momentum reversal.
🧱 Support Zone (Demand Area):
Key Level: $116,400 – $116,900
This zone has acted as a strong demand level, with clear evidence of buying pressure pushing BTC higher after testing this area. The volume profile (VRVP) supports this, showing heightened trading activity at this price.
🔄 Bullish Breakout Confirmation:
A bullish breakout from the descending channel occurred just above the support zone, aligning with the label "Bullish Momentum".
The breakout candle has closed above minor resistance, which increases the probability of a trend reversal.
📍 Price Target:
The projection points toward $120,000, aligning with previous resistance and psychological round-number resistance.
This target is highlighted by an expected bullish leg after a possible retest of the breakout zone around $117,500 – $117,800.
🧭 Key Levels to Watch:
Support: $116,400 – $116,900
Retest Zone (Buy Opportunity): $117,500 – $117,800
Immediate Resistance: $118,400
Major Resistance / Target: $120,000
📊 Summary:
BTC/USD has shown a bullish reversal signal from a well-respected support zone after a descending correction phase. The current price structure, volume buildup, and breakout momentum suggest a high probability of continued upside movement toward the $120,000 mark. A successful retest of the breakout zone would provide a strategic entry for long positions with tight risk management.
Btcusd:Huge trading opportunities and ideasBTCUSD's rebound after touching the position near 116180 this time is fast. From the trend observation. BTCUSD is still in a high consolidation stage. It has not broken the oscillation range for the time being. It can maintain selling near 120k. Buying near 11600 for range trading. It is expected that there will not be many trading opportunities in the London market. It will take until the New York market opens to see better trading opportunities.
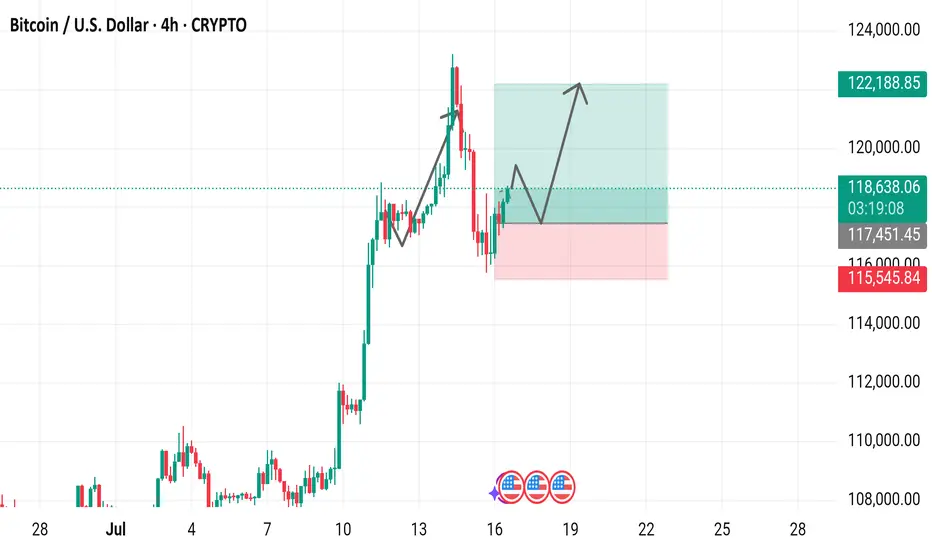
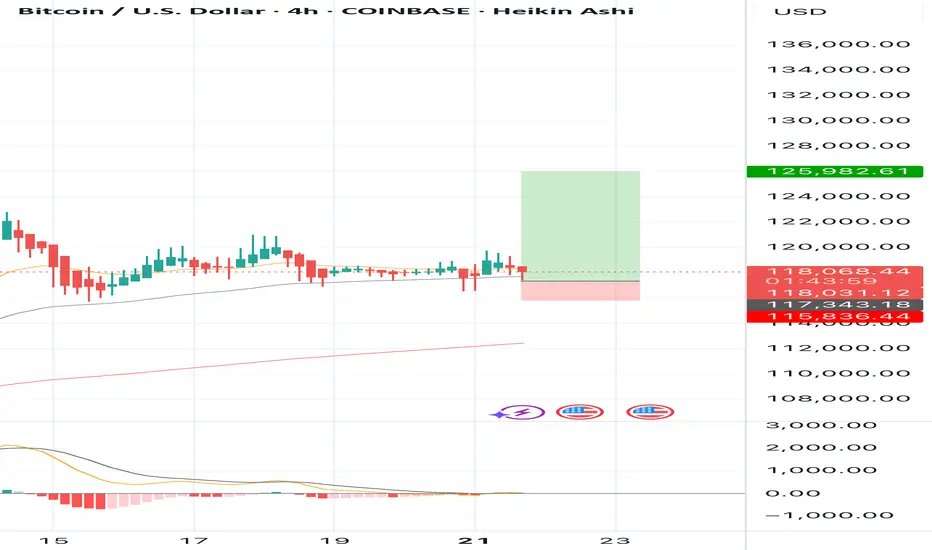
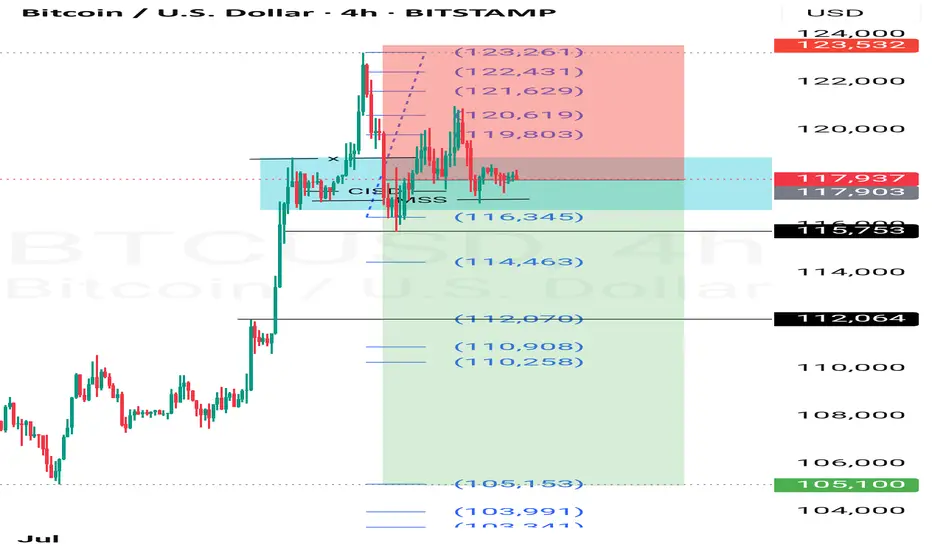
Bitcoin / U.S. Dollar 4-Hour Chart (July 2025)4-hour price movement of Bitcoin (BTC) against the U.S. Dollar (USD). The price has risen from 118,714.64 to 118,714.64 (+937.9 or +0.80%) over the period. Key levels include a support zone around 115,451.45 to 117,451.45 and a resistance zone near 120,000.00 to 122,188.85,

SellRejection Level
Daily Volume
Market Structure Shift
London Session
Trend Line Break
Untapped Order Point

Bitcoin ConsolidatesBitcoin continues to flex its strength, grinding higher and holding firm just below resistance at $123,231. After breaking out above $112,000 earlier this month with a burst of volume and momentum, price has cooled off slightly, consolidating in a tight range between $117K and $123K. This isn’t weakness – it’s digestion. A bullish pause. Traders are clearly eyeing the next move, and so far, the chart looks like it’s winding up for another push.
Support at $112,000 has held cleanly, and the 50-day moving average is trending steadily upward, now comfortably below price – a textbook sign of bullish structure. If $123K breaks, it could set off a new leg higher, potentially triggering another wave of FOMO. But even a drop back to $112K would keep the uptrend intact, with secondary support around $105K offering a strong safety net.
Volume tells the story too. It surged during the breakout and has since tapered off, which is exactly what you’d expect during a calm consolidation. In short: BTC looks healthy, poised, and still in charge. The next big move could be just around the corner – and right now, the bulls have the edge.

Total to 5T & BTC to...?Morning fellas,
No way BTC is stopping here. People are gonna get reckt shorting, and are not gonna believe where this price action is gonna stop.
TOTAL must reach anywhere between 4.5T & 5T, this spread across all Alts.
It has been a long time coming, and the party hasnt even started yet.
Hold your horses and trade thirsty, my friends!
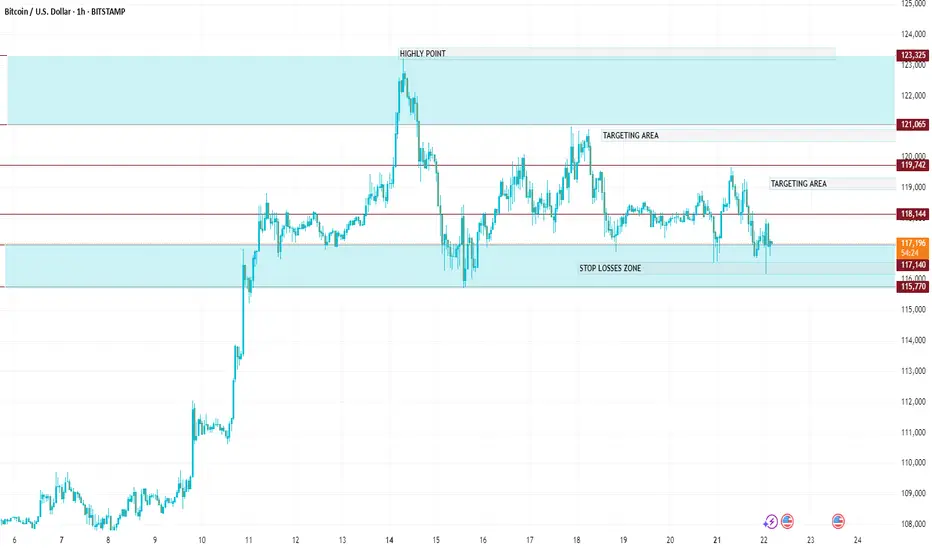
BTCUSDTarget Levels (Upside Potential)
📍 Entry Zone:
Enter near stop losses zone (approx. 117,000 – 117,200 range).
Ideal after bullish confirmation (hammer, engulfing, or breakout from small range).
🎯 Take Profit Targets:
TP1: 117,800 – 117,900 → First "TARGETING AREA"
TP2: 118,300 – 118,500 → Second "TARGETING AREA"
TP3: 119,000+ → Final move towards the "HIGHLY POINT
These levels are based on previous structure highs and visually marked zones.
🔻 Stop Loss (SL):
Below 116,700 – 116,800
This level is below the lower boundary of the “STOP LOSSES ZONE,” offering protection from false breakouts.
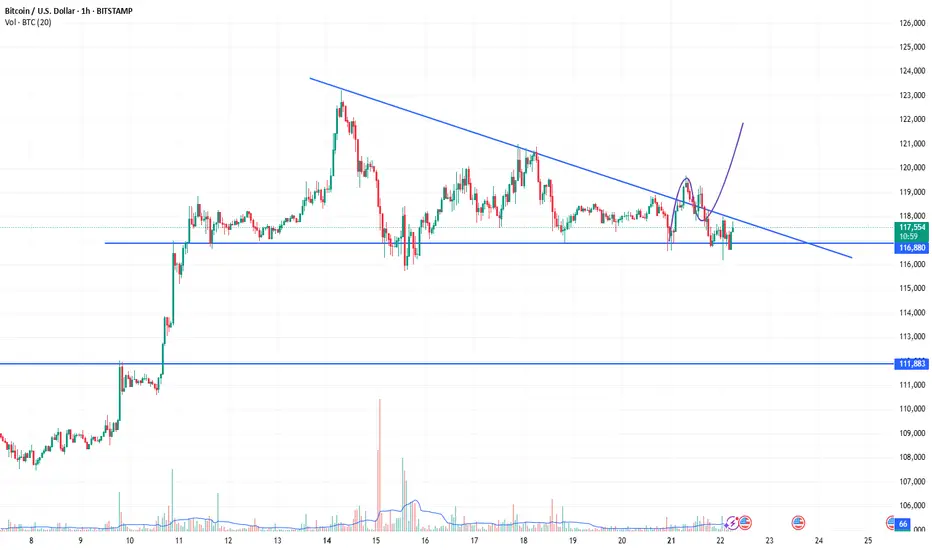
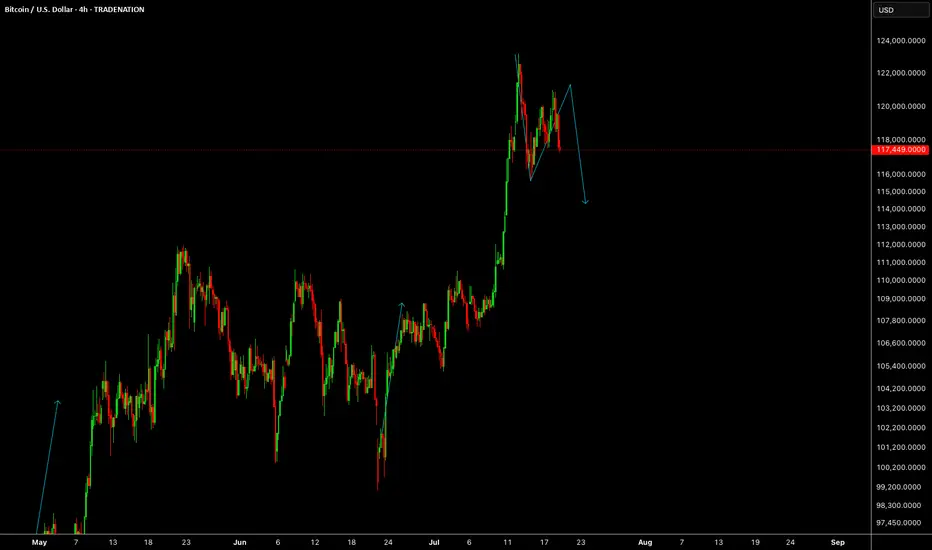
Bitcoin: Setup Builds for a Run Back Towards the HighsBitcoin is coiling within what resembles a bull pennant pattern, hinting at another bout of consolidation before the rally resumes. Trading near the lower end of the recent range, Monday’s pullback offers an appealing entry point, allowing longs to be established around current levels with a stop beneath the July 15 low for protection.
The downtrend from the record highs looms as the first hurdle, sitting around $119,700 today. A break above that level could prompt an accelerated move towards the current record high just above $123,000—an appropriate target for the trade.
Good luck!
DS

BTC Bottom Regression Channel RevisitFisher is head south and a breakdown to the bottom of the regression channel is likely.

BITCOIN BTC/USD PULLBACK STARTED BACK TO BUYZONE?Hey Traders so today looking at Bitcoin showing a strong Uptrend since April this year. Now showing more bullish momentum after a break above the narrow sideways channel at 112,000. Breakouts normally get retested. Also the best place to buy imo is right at the trend line.
The way I like to trade it is don't chase the market let it come to you. It takes patience but you will always get the best price for your trade if you are willing to wait. However some might disagree with this strategy and say you may miss the move because the market doesn't come back.
I say Who Cares if the market comes back or if it keeps rallying! 🤣
There is always another train at the station (anotherwords there are always other trading opportunities so if we miss one big deal we will another one. Most importantly we will find another one with the best price!
Anyway enough of my rant so if your bullish watch for that pullack to around 112,00-113,000 and put a stop loss below support at 107,500. It looks like a safe level not to get stopped out at.
However if Bearish wait for close below support at 107,500 before considering to sell a rally imo.
Good Luck & Always use Risk Management!
(Just in we are wrong in our analysis most experts recommend never to risk more than 2% of your account equity on any given trade.)
Hope This Helps Your Trading 😃
Clifford

BUY BTCUSD now for 4h time frame bullish trend continuation BUY BTCUSD now for 4h time frame bullish trend continuation ...............
STOP LOSS: 115,836
This buy trade setup is based on hidden bullish divergence trend continuation trading pattern ...
Always remember, the trend is your friend, so whenever you can get a signal that the trend will continue, then good for you to be part of it
TAKE PROFIT : take profit will be when the trend comes to an end, feel from to send me a direct DM if you have any question about take profit or anything...
Remember to risk only what you are comfortable with... trading with the trend, patient and good risk management is the key to success here
BTCUSDBTCUSD needs some more correction before we continue the same trend.
Disclosure: We are part of Trade Nation's Influencer program and receive a monthly fee for using their TradingView charts in our analysis.
BTCUSD - BEARISH DIVERGENCE DETECTEDCAPITALCOM:BTCUSD
BTCUSD has been in a bullish trend over the past few hours and is now approaching the resistance at 119,500.00.
On the hourly chart, a bearish hammer has formed alongside a stochastic divergence, signaling potential downside.
⚡ This signal is reinforced by a strong resistance level above, adding weight to a possible pullback scenario.
📉 If BTCUSD rebounds from this level, consider Sell setups with take profit at the nearest support.
📈 If it breaks out, look for Buy opportunities on confirmation.
⚡ We use Stoch (14) to spot potential reversals when it exits overbought or oversold zones — helping you catch clear, confident entries.

TheKing Cycles- Nothing can be perfect in Life or in Trading, but you can always brighten up your day.
- Remember "Cycles are Cycles"
- Everything is in graph
- You can follow bears, predicting 10 years of recession, but we are in a big recession and for a long time already.
- You can fall in the deep and predict the darkness.
- i like to see the sunshine in the morning and i will always radiate warmth.
- Follow Hope, and always believe in your own judgement.
- Be Bold and do the opposite of what commons peoples think.
Happy Tr4Ding !
Sell BTCUSDPrice had taken liquidity and broke cisd and mss. Trump also swears to make america great again...usd should grow stronger.
What say you?
BTC CONSOLIDATESBitcoin continues to consolidate just below resistance after a strong multi-week rally, currently trading around $118,813. Last week’s candle was notably toppy, with a long wick to the upside that hinted at some exhaustion near the highs. Despite that, this week’s price action has remained relatively firm, suggesting the bulls are still in control for now. The key overhead resistance remains at $123,231 – a level that marked the recent high – and BTC has yet to close above it. Support at $112,000, previously a ceiling during the consolidation in May and June, has now flipped to critical support and must hold to maintain the bullish structure.
Volume has declined modestly since the breakout in early July, a typical sign of consolidation rather than distribution. The 50-week moving average continues to rise and now sits well below price around the $89,000 zone, confirming strong momentum. Still, traders should remain cautious here – failure to break above resistance or a close below $112,000 could lead to a deeper pullback toward the mid-$90K range. Until then, this remains a textbook consolidation just beneath resistance in a larger uptrend, with the potential for a breakout continuation if strength returns.

Find a recovery point to continue buying BTC✏️ CRYPTO:BTCUSD is trading near the all-time high. The trading strategy is to wait for some investors to take profit so that the price can return to the nearest support zones and continue to buy to the new all-time high zones.
📉 Key Levels
BUY Trigger: confirms the recovery from the support trend line 116000
BUY zone 112000 (Strong support zone)
Target 129000
Leave your comments on the idea. I am happy to read your views.