Bitcoin: Genius is on the scene The U.S. House passed the Genius Act on July 17, following Senate approval in June. The bill sets comprehensive federal standards for stablecoins, clearing the way for banks and fintechs to issue them under clear reserve and audit rules. This represents a new milestone for the crypto market, and its leading coin - BTC. During the week, BTC managed to hold steady above the $118K. On Tuesday, there has been one attempt to push the price toward the $116, however, the price swiftly returned to the previous grounds. The highest weekly level reached was at $122,8K, reached on Monday, however, this level was also unsustainable. The majority of trades during the week were around $118,5K.
The RSI modestly moved from the overbought market side, ending the week at the level of 65. This could be an indication of a forthcoming price reversal, however, considering strong demand for BTC, such a move could be easily postponed. The MA50 started again to diverge from MA200, indicating that there will be no cross of two lines in the coming period.
BTC managed to hold levels above the $118K, which is an indication that investors are still not ready to sell in higher volumes, in order to take profits. The RSI is indicating potential for a short reversal, however, in the current circumstances, it might be postponed. A move toward the higher grounds is also quite possible, especially taking into account BTCs recent push toward the $122K. At this moment charts are pointing to equal probabilities for a move toward both sides. On one hand, the $116K support was indicated through price during the previous week, as well as the $122K. The start of the week ahead will determine which side will prevail in the week ahead.
BTCUSD trade ideas
Bullish Bitcoin!BINANCE:BTCUSD : Nothing Changed, Still Bullish
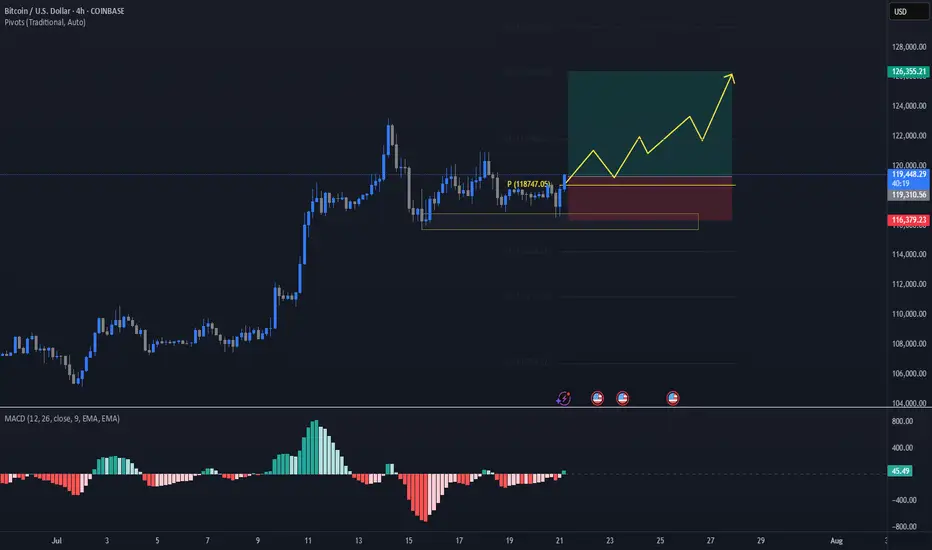
BTC still maintains a strong upward momentum. Immediate strong support was found again near 116K.
It seems that the market has set a new low for BTC around this area for now. We think that as long as BTC stays above this area, there is a good chance that the increasing volume and buyers will increase further pushing BTC further, as shown in the chart, to 120,600; 122,400; 125,000 and 127,000.
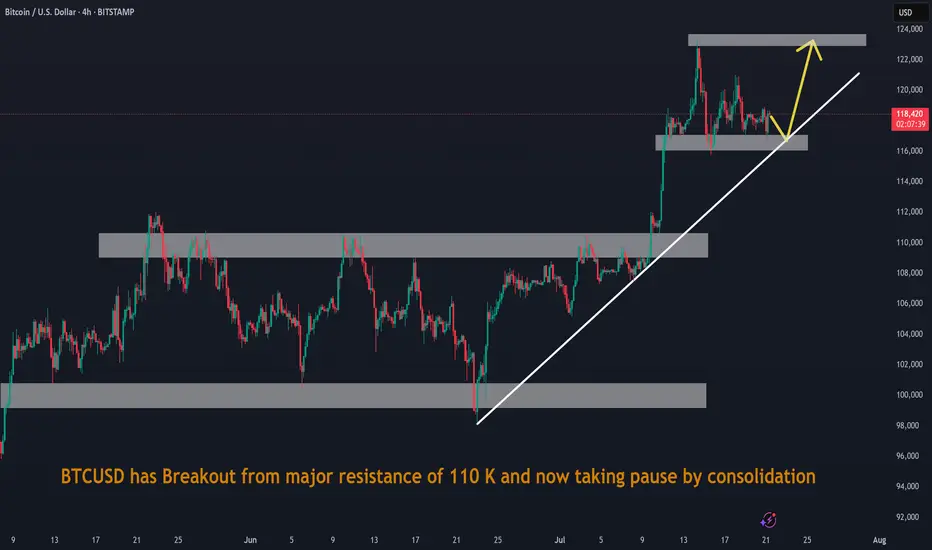
BTCUSD has Breakout from major resistance of 110 K and now takinBTCUSD has Breakout from major resistance of 110 K and now taking pause by consolidation
Bitcoin Suspended Beneath the Ichimoku Silence.⊢
⨀ BTC/USD - BINANCE - (CHART: 4H) - (July 20, 2025).
◇ Analysis Price: $117,919.29.
⊣
⨀ I. Temporal Axis - Strategic Interval - (4H):
▦ EMA9 - (Exponential Moving Average - 9 Close):
∴ Price is currently hovering just below the EMA9 at $118,035.43, showing weakening immediate momentum;
∴ EMA9 is now flat-to-downsloping, indicating short-term loss of control from intraday bulls;
∴ Recent candles have failed to reclaim closes above EMA9, reflecting micro-resistance and tactical fragility.
✴️ Conclusion: Logic sealed - EMA9 has lost command; tactical control has shifted to neutrality with bear undertones.
⊢
▦ EMA21 - (Exponential Moving Average - 21 Close):
∴ EMA21 currently sits at $118,164.50, acting as an overhead suppressor;
∴ The gap between EMA9 and EMA21 is compressing, signaling potential for either crossover or volatility breakout;
∴ Price action is now trapped between EMA9 and EMA50, with EMA21 forming the upper barrier of a tactical box.
✴️ Conclusion: Logic sealed - EMA21 serves as containment lid; rejection here confirms tactical indecision.
⊢
▦ EMA50 - (Exponential Moving Average - 50 Close):
∴ EMA50 rests at $117,262.74, offering foundational support within the current structure;
∴ Price has respected this level on multiple dips since mid-July, confirming its strategic function as mid-term equilibrium;
∴ The slope remains mildly upward - no sign of reversal, only compression beneath.
✴️ Conclusion: Logic sealed - EMA50 maintains its structural role as mid-range dynamic floor.
⊢
▦ EMA200 - (Exponential Moving Average - 200 Close):
∴ EMA200 remains well below at $111,765.30, untouched since early July;
∴ Its wide distance from price confirms that the broader structure remains in bullish territory;
∴ Its trajectory continues upward, anchoring the uptrend beneath all volatility.
✴️ Conclusion: Logic sealed - EMA200 secures the long-term structure; market remains elevated far above reversal threshold.
⊢
▦ Ichimoku Cloud - (9, 21, 50, 21):
∴ Price is currently within the Kumo (cloud) zone, defined between SSA and SSB - a region of ambiguity and compression;
∴ The Senkou Span A and Span B are nearly flat, signaling lack of directional command in the near term;
∴ Kijun and Tenkan lines are converged, offering no trend bias - equilibrium is dominating.
✴️ Conclusion: Logic sealed - Ichimoku confirms a neutralized compression state; breakout required for trend clarity.
⊢
▦ RSI (21) + EMA9 - (Relative Strength Index with Signal Smoothing):
∴ RSI value stands at (51.48), while the EMA9-signal rests at (52.25) - confirming a soft bearish crossover;
∴ The RSI has declined from its recent peak and now oscillates around the neutral 50-line;
∴ Momentum is waning without structural damage, indicating tactical cooling.
✴️ Conclusion: Logic sealed - RSI confirms suspended momentum; structural neutrality prevails beneath fading thrust.
⊢
▦ Stochastic RSI - (3, 3, 21, 9):
∴ Current values are: (%K = 35.33), (%D = 32.68) - with %K slightly above %D, forming a mild bullish crossover;
∴ The oscillator has just risen from oversold levels, indicating potential energy buildup;
∴ Prior cycles in this zone have produced false starts, so confirmation is essential.
✴️ Conclusion: Logic sealed - Stoch RSI hints at rebounding energy, but with fragile structure and low reliability.
⊢
▦ MACD - (9, 21, 9 - EMA/EMA):
∴ MACD Line = (–105.52), Signal Line = (–129.07), Histogram = (+23.55) - confirming a bullish crossover;
∴ The crossover occurred below the zero line, indicating a possible reversal from weakness rather than strength;
∴ Slope of MACD is positive but modest - insufficient to declare dominant shift.
✴️ Conclusion: Logic sealed - MACD is in bullish transition mode, but still recovering from beneath structural base.
⊢
▦ OBV + EMA9 - (On-Balance Volume with Trend Overlay):
∴ OBV currently reads (71.13M), and is slightly above its EMA9, signaling retention of volume without strength;
∴ Volume has not left the system - but neither has it surged; this is passive accumulation at best;
∴ No divergence exists for now, but lack of buildup implies neutral positioning.
✴️ Conclusion: Logic sealed - OBV is stable and neutral; no buyer escape, but no commitment surge either.
⊢
▦ Volume + EMA21 – (Volume Profile with Trend Average):
∴ Current volume bar = (13.91), sitting below the EMA21 baseline;
∴ The volume profile across recent sessions is declining - suggesting consolidation or exhaustion;
∴ No breakout volume spike has accompanied price stabilization - trend is under silent compression.
✴️ Conclusion: Logic sealed - volume fails to validate price levels; tactical fragility remains unresolved.
⊢
🜎 Strategic Insight – Technical Oracle:
∴ The H4 structure presents a state of compression beneath a neutral cloud, suspended between tactical short-term EMA's (9, 21) and safeguarded by a rising EMA50 backbone;
∴ Momentum oscillators (RSI, Stoch RSI, MACD) converge toward reactivation, yet none have broken decisively above neutral thresholds - reflecting potential, not power;
∴ Volume participation is inconsistent and fading, offering no confirmation for breakout - the market is in silent observation mode, not assertion;
∴ Ichimoku confirms indecision: price floats within Kumo, without command or breakout - equilibrium reigns;
∴ Price positioning remains elevated above the deeper structure (EMA200), but its current zone between EMA9 and EMA50 represents a coil of indecision;
∴ The overall condition is not bearish - but it is tactically suspended, lacking conviction, awaiting external ignition.
✴️ Conclusion: The Oracle confirms - the structure is intact, but tactical initiative is lost; the field is poised, not marching.
⊢
∫ II. On-Chain Intelligence – (Source: CryptoQuant):
▦ Short-Term Holder (SOPR):
∴ SOPR currently reads (1.001), meaning short-term holders are spending coins with no significant profit or loss - a signal of economic neutrality;
∴ The chart displays persistent lateral volatility around the (1.0) threshold since early July - no emotional dominance in market behavior;
∴ This pattern historically coincides with pre-expansion compression phases, rather than breakdown events.
✴️ Conclusion: Logic sealed - SOPR confirms behavioral neutrality among short-term holders; the market remains in a state of expectation, not realization.
⊢
▦ STH-MVRV - (Short-Term Holder Market Value to Realized Value):
∴ The metric is currently oscillating around (1.30), well above the danger zone at (1.0), but far below the euphoria threshold at (1.8);
∴ The structure reflects multiple euphoria rejections, followed by a return to balance - a classic cooling-off pattern without structural failure;
∴ Convergence between market price, realized value, and short-term cost basis indicates the market is retesting foundation zones.
✴️ Conclusion: Logic sealed - STH-MVRV confirms post-euphoric cooling with structural support intact; no active trend, no breakdown.
⊢
▦ Exchange Inflow Spent Output Age Bands - (All Exchanges):
∴ Inflows to exchanges have been consistently low in recent weeks, particularly among young coins (0d–1d, 1d–1w) - showing no urgency to sell;
∴ Aged outputs (>6m) remain dormant - long-term holders are not mobilizing;
∴ The absence of inflow pressure signals no macro panic or exit event, reinforcing the diagnosis of tactical compression.
✴️ Conclusion: Logic sealed - muted inflows confirm a lack of distribution catalysts; stable structure sustains the technical silence on the 4H chart.
⊢
🜎 Strategic Insight - On-Chain Oracle:
∴ All three on-chain metrics converge into a clear state of tactical equilibrium - not bearish, not euphoric, but suspended between action and observation;
∴ Short-Term Holder SOPR stabilizes at (1.001), marking a precise psychological stasis - profit-taking and panic-selling are both absent;
∴ STH-MVRV confirms a post-euphoria cooldown with structural preservation, implying that short-term holders have recalibrated expectations without abandoning their positions;
∴ Exchange inflows remain historically depressed, with no aged coins activating - a hallmark of silent markets preparing for resolution;
∴ The chain speaks softly: no exit, no aggression, no irrationality - only latency, and the potential energy of stillness.
✴️ Conclusion: The Oracle confirms - the on-chain architecture reflects suspended initiative; nothing is broken, nothing is charged - only paused.
⊢
𓂀 Stoic-Structural Interpretation:
▦ Structurally: Bullish;
∴ Price remains well above the EMA200 and EMA50, with no breach of long-term support;
∴ All EMA's (9, 21, 50) are compressing, but retain upward trajectory - confirming structural integrity;
∴ Ichimoku Kumo holds price within a neutral band, but does not reflect a breakdown.
⊢
▦ Momentum-wise: Suspended Compression.
∴ MACD shows bullish crossover from beneath, but lacks amplitude to confirm trend reversal;
∴ RSI is parked around 50 with a bearish signal crossover - signaling stagnation, not strength;
∴ Stochastic RSI is climbing out of oversold, but with no impulsive follow-through.
⊢
✴️ Final Codex Interpretation:
∴ The H4 structure is consolidating beneath short-term resistance and within equilibrium clouds;
∴ Momentum is rebuilding, but flow remains stagnant;
∴ Buyers have not exited, but neither have they re-initiated force;
∴ The chart breathes - but does not speak.
⊢
⧉
· Cryptorvm Dominvs · MAGISTER ARCANVM · Vox Primordialis ·
⚜️ ⌬ - Silence precedes the next force. Structure is sacred - ⌬ ⚜️
⧉
⊢

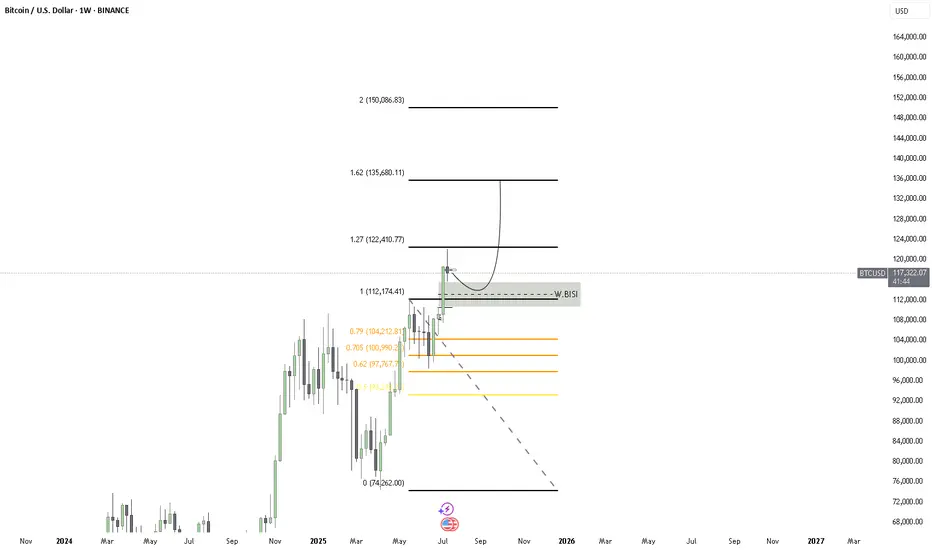
LONG BTC hello.
i m expecting to long from the w biSI
and the target is the projection
of course i will not go in without confirmation and 4 h bisi would be good
i will wait the price to give me an 4 h bisi then i will buy .targets are on the chart 1.62 fibo
is perfect
BTCUSD Technical Analysis | Smart Money Concept (SMC) BreakdownBTCUSD Technical Analysis | Smart Money Concept (SMC) Breakdown
🧠 Smart Money Market Structure Insight
📌 Key Elements Identified:
BOS (Break of Structure): Multiple BOS points indicate bullish intent early on. However, the latest BOS on July 14 followed by a significant drop signals a shift in momentum—possibly a distribution phase.
Liquidity Sweep: Price swept prior equal lows/liquidity before reversing, a typical Smart Money trap setup.
FVG (Fair Value Gap) / Imbalance: Identified around the mid-section of the chart—price filled partially but failed to hold, suggesting internal weakness.
Strong Support Zone (Demand Area): Marked between 115,000 - 114,640; this zone is anticipated to act as a springboard for bullish reversal.
📉 Current Price Action Observation:
BTCUSD is hovering around 118,152 - 118,560, moving sideways with lower highs indicating compression.
Price is projected to form a "W" pattern or double bottom in the shaded region.
Expected liquidity grab beneath 115,902 followed by potential bullish reaction targeting 121,562, as indicated by the white arrow.
🧩 Strategic Outlook & Potential Play:
🔻 Bearish Sweep First:
Market likely to sweep the support one more time, tapping into deeper liquidity pools between 115,000–114,640.
This is aligned with the concept of Smart Money hunting for retail stop-losses before reversing.
🔼 Bullish Recovery After Sweep:
Strong probability of bounce due to presence of:
Fair Value Gap (already tested),
Fresh demand zone,
Liquidity grab setup.
Projected Bullish Target: 121,562
Confirmation Needed: A strong bullish engulfing or BOS on lower timeframes near support.
🏷️ Conclusion:
This BTCUSD setup is a textbook Smart Money scenario: BOS ➝ Liquidity Grab ➝ FVG ➝ Reversal from Demand. Traders should wait for confirmation from the support region before entering long positions.

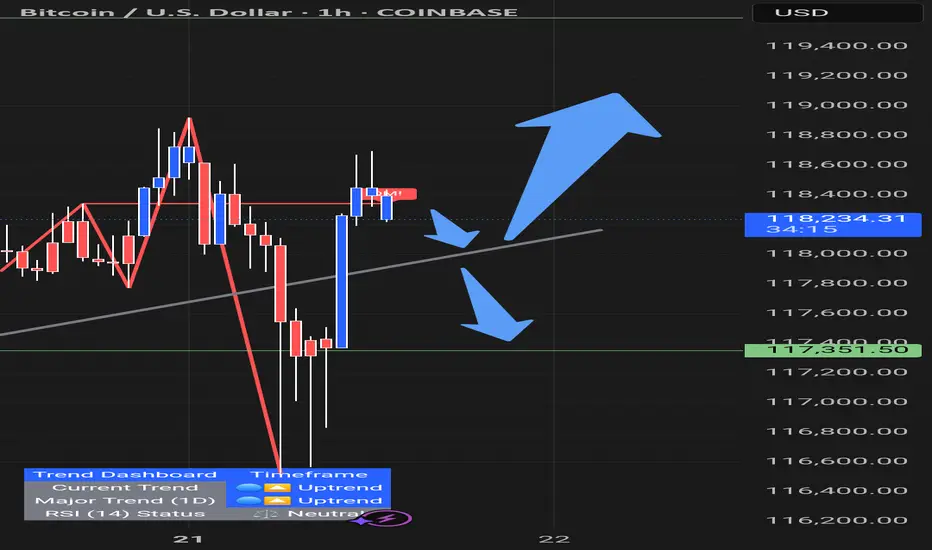
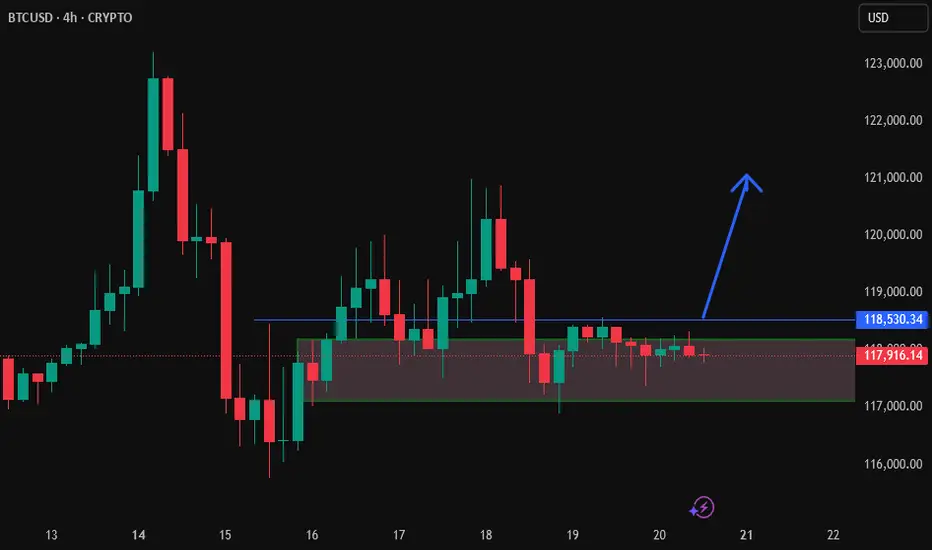
BTC/USD Short-Term🔷 Pattern: Symmetrical Triangle (Consolidation)
The price is inside the triangle formation (orange lines) and is approaching its completion.
An impending breakout (up or down) is highly probable within the next few hours.
📉 Support Levels (red lines):
117.210 – local horizontal support.
116.324 – 115.050 – strong demand zone (potential target in the event of a downward breakout).
📈 Resistance Levels (green lines):
118.900 – 119.700 – local resistance zone.
121.011 – 121.813 – higher target in the event of an upward breakout from the triangle.
📊 Technical indicators:
✅ RSI (Relative Strength Index):
Currently: 69.05 – close to overbought levels, but not yet at an extreme.
Potential for a short-term pullback unless a strong breakout occurs.
✅ MACD:
Signal lines are tightly intertwined, histogram flat → no dominant momentum.
Waiting for a breakout signal (bullish or bearish crossover).
✅ SMA:
Price currently below the 50 and 200 SMA for 1 hour → slight downward momentum.
The 50-SMA (red) is turning down, which may signal a continuation of the sideways or downward trend.
📌 Short-term conclusions (1–6 hours):
Scenario 1: Bullish breakout:
Confirmation: H1 candle close above 118,900.
Targets: 119,700 and potentially 121,000–121,800.
Scenario 2: Bearish breakout:
Confirmation: H1 candle close below 117,200.
Targets: 116,300, then 115,000–115,300.
📍 Watch for:
Breakout of the triangle boundaries with volume.
RSI behavior relative to the 70 level.
MACD crossover and histogram.


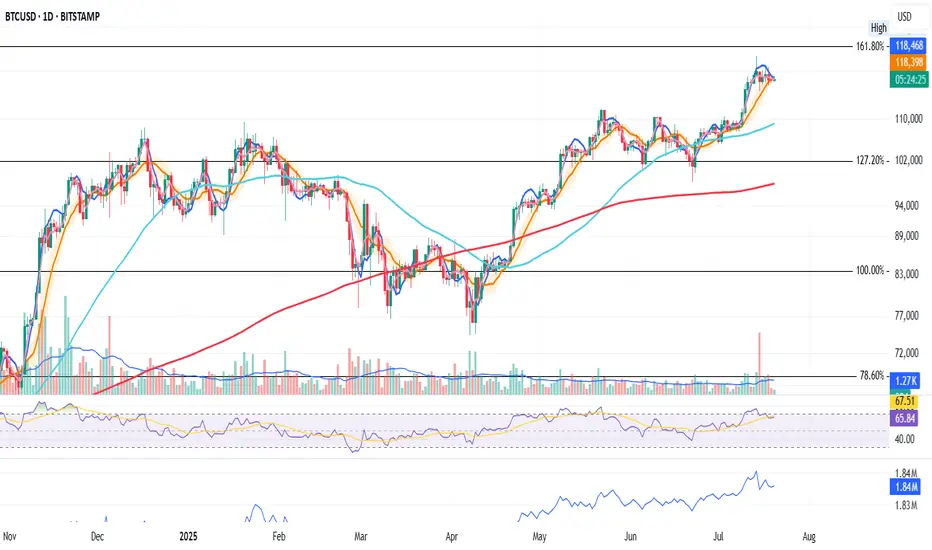
BTC Daily Outlook
In my opinion, Bitcoin looks like it might need a short pause here.
📉 It's sitting just below a key Fib level and may require some time to consolidate before making another attempt.
📌 Price is printing a possible second close below the BB center.
📉 SMA is below the BB center — not ideal.
📊 Volume saw a strong red spike on July 15
📉 OBV formed a lower high while price remains elevated (granted, it’s the weekend and volume tends to dip).
📉 RSI is below 70 and under its moving average.
Too early for a strong conclusion — but this is a caution signal.
Let’s stay alert and watch it unfold together.
Always take profits and manage risk.
Interaction is welcome.
BTCUSD Outlook – Probabilistic Trade Setup in AI Liquidity Cycle
📈 BTCUSD Outlook – Probabilistic Trade Setup in AI Liquidity Cycle
🧠 WaverVanir DSS | VolanX Protocol | SMC x Institutional Forecast Alignment
We are now entering a pivotal BTC phase. Multiple timeframes and AI-backed forecasts converge on a low-volatility accumulation breakout, with price structure aligning for a leg toward $127K–134K. However, short-term model dispersion requires precise risk management.
🧠 Technical Confluence (SMC + Fib):
Clean BOS + CHoCH confirms bullish structure
Retest of equilibrium zone around $116.8K–$117.2K
Institutional FVG demand sits at $115.4K
Fibonacci extensions align with:
🎯 Target 1: $127,065
🎯 Target 2: $133,182
🎯 Max Extension: $134,397
🌐 Macro + Fundamental Catalysts:
Spot BTC ETF inflows remain net positive
AI liquidity theme continues to push institutional demand into BTC and ETH as non-correlated inflation hedges
Fed pivot odds increasing toward Q4 → expected risk-on environment
U.S. CPI cooling, potential for weaker dollar = BTC bullish
Bitcoin dominance holding near highs
🔐 Risk Metrics (WaverVanir DSS):
Metric Value
Forecast 30D Return +3.4% ($122,072.54)
Confidence Interval $105K – $125K
Model Agreement 2/9 Bullish
Prediction Volatility 14.45%
Sharpe Ratio 1.29
Max Drawdown (forecast) 32.9%
Direction Confidence 72.3%
🎯 Trade Setup (VolanX DSS Model + SMC Confluence):
Parameter Level
Entry $118,000–$117,200
Stop Loss $112,528 (4.7%)
Target 1 $120,443
Target 2 $122,072
Target 3 $127,065 (extended)
Target 4 $133,182–$134,397 (macro projection)
Position Size 25% of capital
Time Horizon 7–30 Days (Scalp + Swing Tiered Model)
📊 Probabilistic Scenarios (Next 30 Days):
Scenario Target Range Probability Notes
🔼 Continuation (DSS Base Case) $122K–$127K 60% Model + SMC aligned
⏸ Accumulation Zone $116K–$119K 25% Rangebound/Equilibrium trap
🔽 Breakdown <$112.5K 15% Triggered by macro shock or liquidity flush
📌 This setup is front-tested using the WaverVanir DSS system, institutional ensemble models, and real-time SMC structure. Not financial advice – for educational and strategic insight purposes only.
#WaverVanir #VolanXProtocol #BTCUSD #BitcoinForecast #CryptoStrategy #SmartMoneyConcepts #FibonacciTargets #AITrading #InstitutionalCrypto #MacroAnalysis #TechnicalSetup #RiskManagement #TradingSignals #QuantitativeModels #Bitcoin

btcusd sl;116.7k
Bitcoin is the first ever cryptocurrency to exist, which was created in 2009 by Satoshi Nakamoto and has since become the most valuable asset on the digital market. It operates without the need for intermediaries, relying solely on cryptography and netw

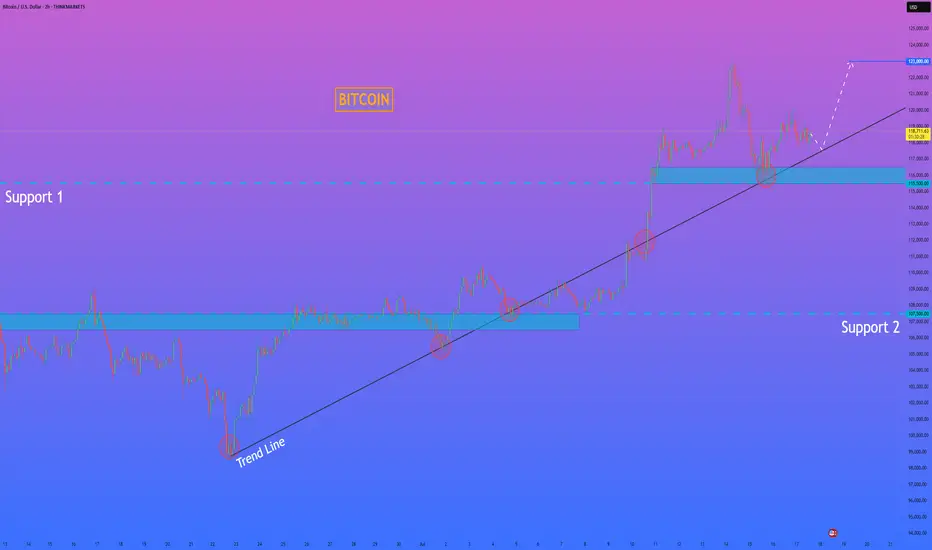
HelenP. I Bitcoin will correct to trend line and then start riseHi folks today I'm prepared for you Bitcoin analytics. The price has been trading in a strong bullish structure, clearly respecting the ascending trend line since the rebound from the 107500 level. Each time the price touched the trend line, it formed a higher low and continued the upward movement. After breaking through the important Support 1 zone (115500–116500), BTC made a strong impulse upward and reached a local high above 122000 points. Currently, the price is making a pullback and moving closer to the trend line again. This area has previously acted as a major point of interest for buyers, and now it's expected to play a key role once more. The support zone and trend line are converging, which makes this level critical for the next move. I believe BTCUSD will bounce from this area and continue its bullish momentum. My goal is set at 123000 points. Given the market structure, higher lows, and strong reaction from the support zones, I remain bullish and expect further growth from current levels. If you like my analytics you may support me with your like/comment ❤️
Disclaimer: As part of ThinkMarkets’ Influencer Program, I am sponsored to share and publish their charts in my analysis.
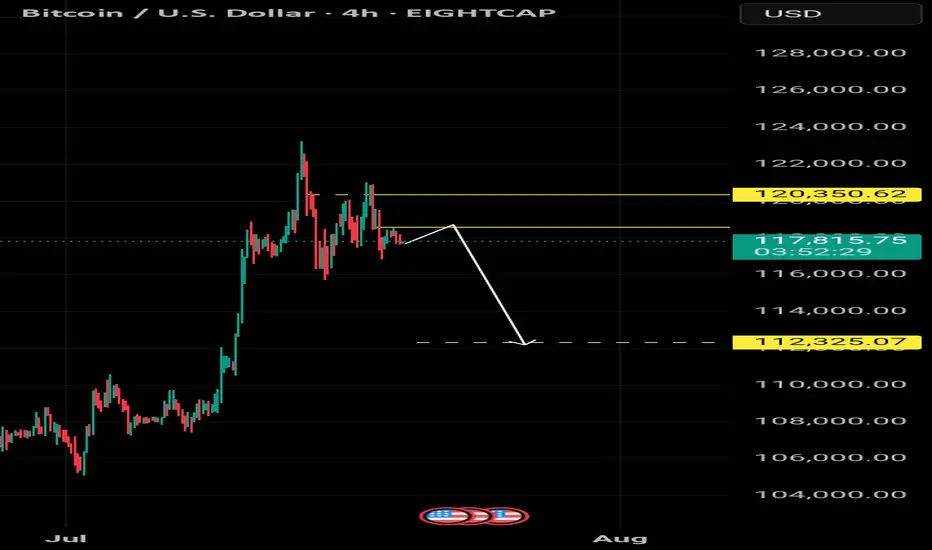
Btc outlook A simple outlook on Bitcoin
A corrective sell-off to gain some momentum.
The yellow zone is crucial and must hold without being broken.
BTCUSD bullish scenario will it go ATH 1,30,000+BTCUSD is currently in A bullish trend and it took the first support at 115900 which 0,5 fib and next at 117500 which 0.618 fib, the price is likely to go up target can be around 1,25000 and then to 1,30,000( weekly chart shows this target). Price should not fall below 115500,in this case it may further go down and take support around 1,10,000-1,12,000.

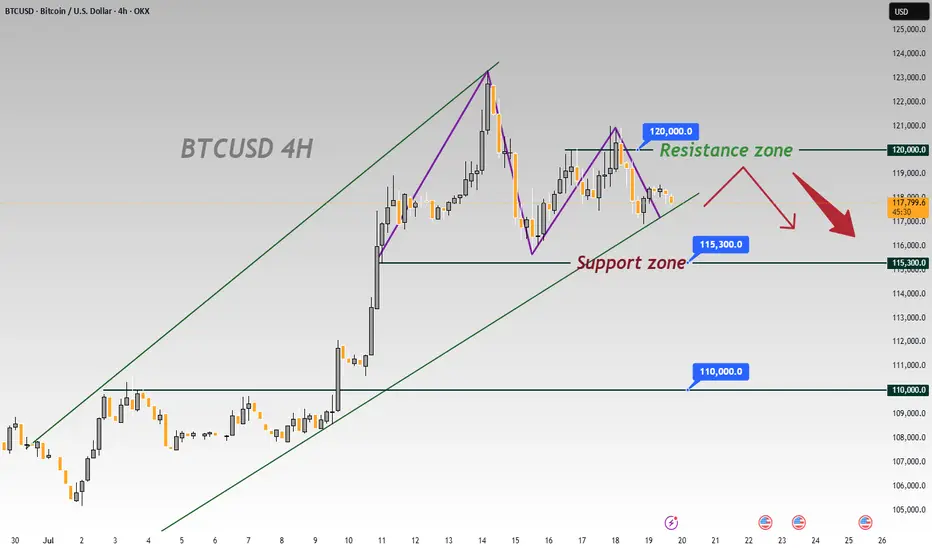
BTCUSD 4-Hour Chart Analysis: Range-Bound Trends & Key LevelsFrom the 4-hour chart of BTCUSD, the recent price movement shows obvious range-bound characteristics 📊. The upper zone around 120000 forms a key resistance level 🛑, where the bullish momentum has waned after encountering resistance 💨.
The lower level of 115300 is a significant support zone 🛡️. Previously, there was some buying support when the price retraced to this zone 👀. However, as the current price is pulling back from the resistance zone ↘️, if the bearish force takes the lead subsequently 🐻, the possibility of breaking below the 115300 support will increase ⬆️. Once it breaks below effectively 💥, the next key support level of 110000 will most likely become the target for the price to decline towards 🎯.
In terms of the short-term trend 📈, due to the obvious suppression from the resistance zone 🚧, the price will most likely continue the rhythm of testing the support downwards 🔽. In operation, one can pay attention to the breakdown situation of the support zone and layout trades accordingly 📝. Meanwhile, be alert to the possibility of a rebound after the price finds support in the support zone 🚀, and further confirmation of the direction needs to be combined with real-time K-line patterns 📊, trading volume 📈
🚀 Sell @119500 - 118500
🚀 TP 116500 - 115500
Accurate signals are updated every day 📈 If you encounter any problems during trading, these signals can serve as your reliable guide 🧭 Feel free to refer to them! I sincerely hope they'll be of great help to you 🌟 👇
BTC 106500 Liquidity Sweep BTC need liquidity sweep 🧹 biggest one before pump price to new ATH to 138500 so be ready for buy the dip 106500 buy area means sell now buy later on

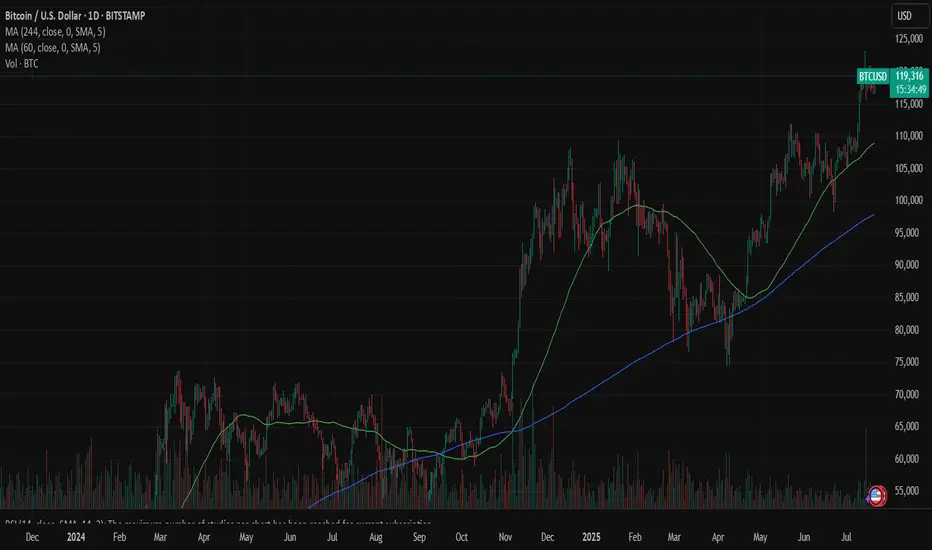
Bitcoin Ready For Another Leg Higher?Bitcoin currently shows characteristics of bullish consolidation. Following a notable upward move after the election , the price action has entered a phase of sideways trading within a defined range since inauguration.
This period allows the market to digest recent gains and for buyers to accumulate further positions before the next anticipated leg up. Technical indicators, while showing a temporary pause in upward momentum, generally remain supportive of a bullish continuation, with key support levels S1-75k, S2-100k holding firm. The consolidation phase, marked by decreasing volatility, often precedes a strong directional move, suggesting that Bitcoin is coiling for another potential surge.

Bitcoin target 134k Bitcoin is in a completely Saudi channel and the target is the range of 130,000 to 134,000.
The bull run will start next week and the entire market is bullish.

BITCOIN 15-Min Chart – Key Support Retest with Bullish PotentialThis 15-minute BTCUSD chart shows Bitcoin retesting a strong support zone near $112,680 after a clear downward move. The price is currently reacting at a previous demand area, marked in blue, just above the session’s LOW. A possible bullish reversal setup is forming if the support holds, targeting the previous HIGH around $114,000 and a potential TP at $114,200. Traders may look for confirmation signals (e.g., bullish engulfing, order block reaction) before entering long positions.


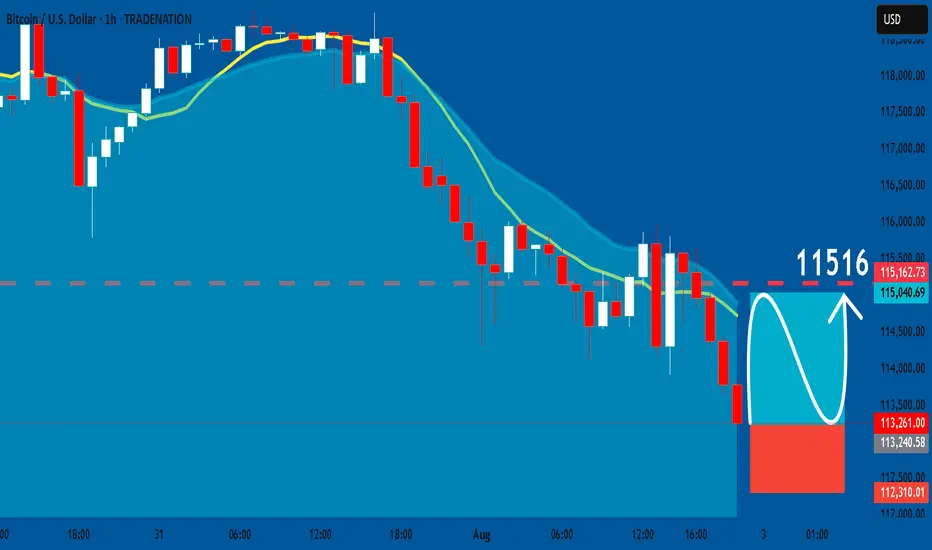
BTCUSD: Long Signal with Entry/SL/TP
BTCUSD
- Classic bullish formation
- Our team expects growth
SUGGESTED TRADE:
Swing Trade
Buy BTCUSD
Entry Level - 11326
Sl - 11231
Tp - 11516
Our Risk - 1%
Start protection of your profits from lower levels
Disclosure: I am part of Trade Nation's Influencer program and receive a monthly fee for using their TradingView charts in my analysis.
❤️ Please, support our work with like & comment! ❤️