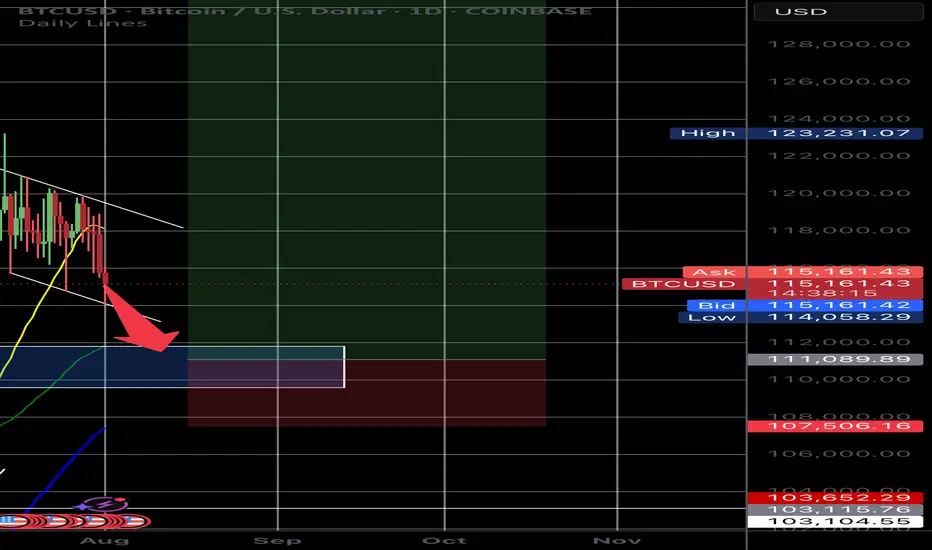
Major Warning: Bitcoin Breaches Key Support with Bearish SignalsBitcoin has officially broken down from its recent consolidation zone, closing below the critical 21 EMA on the daily chart. This move, combined with reversal signals on both the weekly and daily timeframes, suggests that downward pressure is intensifying.
In this video, I’ll walk you through:
• The candlestick patterns signaling reversal
• The significance of the 21 EMA breach
• Confirmed divergences from key indicators
• What this means for short-term and long-term price action
Whether you're holding Bitcoin or trading around it, this is a pivotal moment. The charts are speaking—are you listening?
BTCUSD trade ideas

BTCUSD The Week Ahead Key Support and Resistance Levels
Resistance Level 1: 119,000
Resistance Level 2: 121,030
Resistance Level 3: 122,862
Support Level 1: 111,683
Support Level 2: 110,450
Support Level 3: 108,720
This communication is for informational purposes only and should not be viewed as any form of recommendation as to a particular course of action or as investment advice. It is not intended as an offer or solicitation for the purchase or sale of any financial instrument or as an official confirmation of any transaction. Opinions, estimates and assumptions expressed herein are made as of the date of this communication and are subject to change without notice. This communication has been prepared based upon information, including market prices, data and other information, believed to be reliable; however, Trade Nation does not warrant its completeness or accuracy. All market prices and market data contained in or attached to this communication are indicative and subject to change without notice.

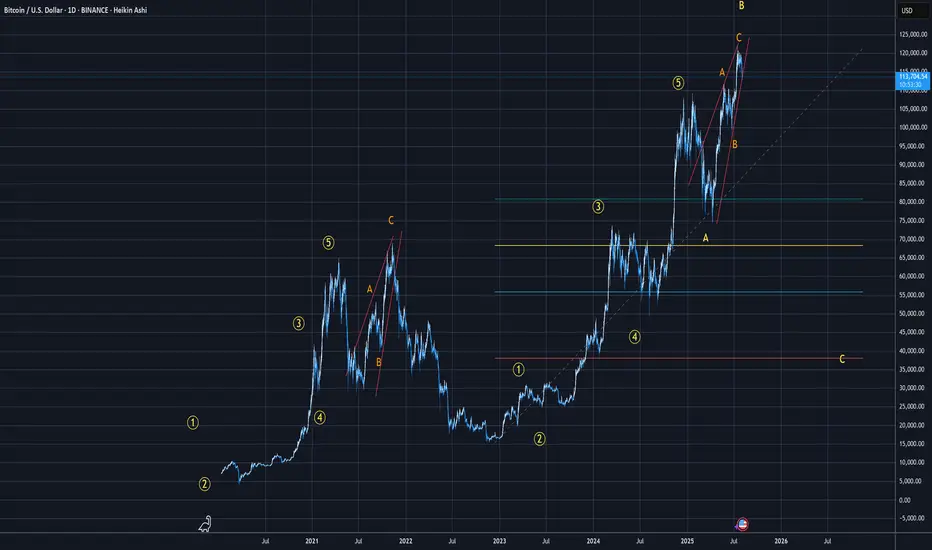
is BTC dead again ?I was really bullish until wave 4 didnt really bounce between the 38 and 50
suddenly very bearish
BTC; Heikin Ashi Trade IdeaAfter a correction, price may have a good reaction from first demand area I have marked.
Lower demand zone is even more valid, since we see manipulation and then impulsive move to the oposite side.

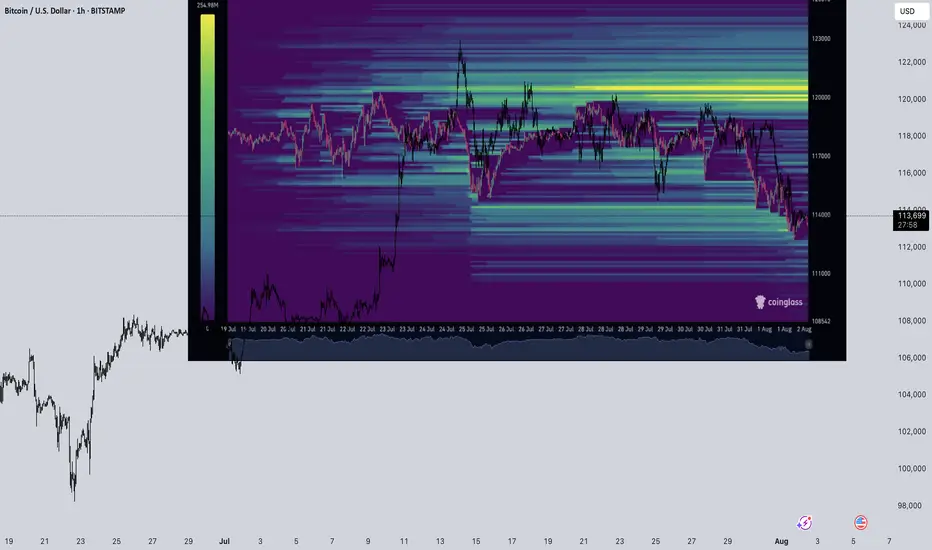
Btc / UsdtBITSTAMP:BTCUSD
"Bitcoin cleaned out the downside. Now all eyes on the untouched upside. Liquidity is a magnet — and BTC follows it."
Disclaimer : Not financial Advice
BTCUSD looking to SellI'm expecting BTC USD to enter into the break of structure and retest zone that is in f4HRS and and then push down from there with a 1:4RR hitting the next point of interest / area of interest


BTCUSD - Follow Up AnalysisTaking a look at the daily chart, price action did come down as previously expected in my last article.
Now we're heading into an area of strong support and I expect to see some sideways action until something significant happens next.
How I'm trading this price action?
I believe price action may continue to bounce around from the current price of 113,600 down to 110,000 for at least the next few days. With that said I'm implementing my range trading strategy. The range trading strategy also known as the Bitcoin Scalper scalps on the 1 and 5min timeframe creating sort of like a grid style approach but it's based on candlestick momentum. Since it trades off momentum, it's able to detect breakouts and know when to switch from the ranging strategy to the breakout strategy.

Bitcoin’s Game Has Changed: Fresh Support Zone, Targets Sky-HighHey Dear Friends,
Until recently, Bitcoin had been stuck in a range between 112,331 and 105,344 for quite some time. But that range has now been clearly broken. So, what does this mean? This zone, which used to act as resistance, is now expected to flip and act as support.
According to my weekly trading model, the long-term target levels I’m tracking for Bitcoin are: 127,818 – 137,000 – 146,000.
Since this is a weekly setup, it might take a while for these targets to play out. Even if we see pullbacks to the 112K, 105K, or even 100K levels, I expect to see strong buying pressure from that zone.
I’ll keep sharing regular updates as this setup develops.
To everyone who’s been supporting and appreciating my work—thank you, truly. Your encouragement means the world to me and keeps me motivated to keep showing up. Much love to all of you—I’m grateful we’re in this journey together.

Bitcoin buy setupHi everyone.
I think this area has a good potential to set an order and take at least 1% profit out of it..
Let's see how it reacts to this level...
Please consider the risk management.
Goodluck

One of these lines will be right..I expect a pump in the next 2 days otherwise we will fall and continue on the next support line. Odds are 70/30

BTC VS AI ?Hi
I had asked AI the probabilities and projection from previous moves.
So here goes; as you know accuracy is vague and shall not be absorb as 100%
Just analysis and probabilities.
Need clearer confirmation when taking a trade .
Given that the current price is 113,000, let's analyze whether the price has extended beyond previous retracement projections and then develop the next projection accordingly.
Recap from previous data:
Second move: price moved from 99,000 to 122,000
Projected retracement price (29.41%) was approximately 115,236
Current price at 113,000 is below 115,236 (projected retracement), meaning it has retraced more than expected before potentially continuing upward.
Interpretation:
Since 113,000 < 115,236, the price has actually retraced deeper than initially projected from the previous move.
This could suggest a stronger correction or weakness in the upward movement before continuation.
If the price started at 122,000 high and retraced below the anticipated retracement level, it may find support around current or slightly lower levels before attempting to move higher again.
Next projection based on current price of 113,000:
New retracement % on second move:
Move up: 122,000 - 99,000 = 23,000
Actual retracement: 122,000 - 113,000 = 9,000
Actual retracement % = (9,000 / 23,000) × 100 ≈ 39.13%
Updated retracement level is closer to a Fibonacci 38.2% retracement level, which is a common retracement level in markets.
Project next upward move:
Use the previous average upward move for projection: 28,500 (from prior analysis).
Starting point for next move projection: 113,000 (current price after retracement)
Next projected high = 113,000 + 28,500 = 141,500
Probabilities:
Retracement around 38.2% usually has a probability around 20-25%, slightly less frequent than 29-30%, but still common.
Uptrend continuation probability after retracement remains >60% if the trend is strong .
Summary Table with updated data:
Feature Value
Current Price 113,000
Previous High 122,000
Move Up Range 23,000
Actual Retracement Amount 9,000
Actual Retracement % 39.13%
Projection for Next High 141,500
Probability of 39% Retracement 20-25%
Probability of Uptrend Continuation >60%
Conclusion:
The price has retraced more than initially projected from previous data but still within reasonable common retracement levels (around 38%).
Assuming the uptrend holds, the next price move could push toward approximately 141,500.
It’s advisable to watch key support levels near 113,000 for signs of reversal or further retracement.
All the best
Lets see in we can trust it
Not a guru

BTCUSD Swing outlookSwing Outlook on BTCUSD!
8H Timeframe Analysis
Trend Bullish
Looking for buys on discounted levels

BTC - 12H Breakdown Please refer to our last post:
Now that we have seen BTC pick its direction here is what we should watch for next based on the charts. With the higher degree of certainty we should be visiting our yellow line measured move to the downside. This is just slightly below $112k.
If BTC continue to fall then watch for our first support to be around the yellow line. This would be scenario 1.
Right now BTC is trying to find some short term support which could lead to scenario 2 playing out. Scenario 2 would be we get a bounce from this level back to the bottom of the trendline. This could put price around $117.5k-$118k. If we see sellers turn this trendline (from old support into new resistance) it would be another confirmation we are visiting the yellow line.
However, if price is able to create a fake breakdown around these levels and reeneter the pattern then this just becomes a false break and the upside move can continue. This is the least likely scenario of the 3 but will update this post upon further price development.

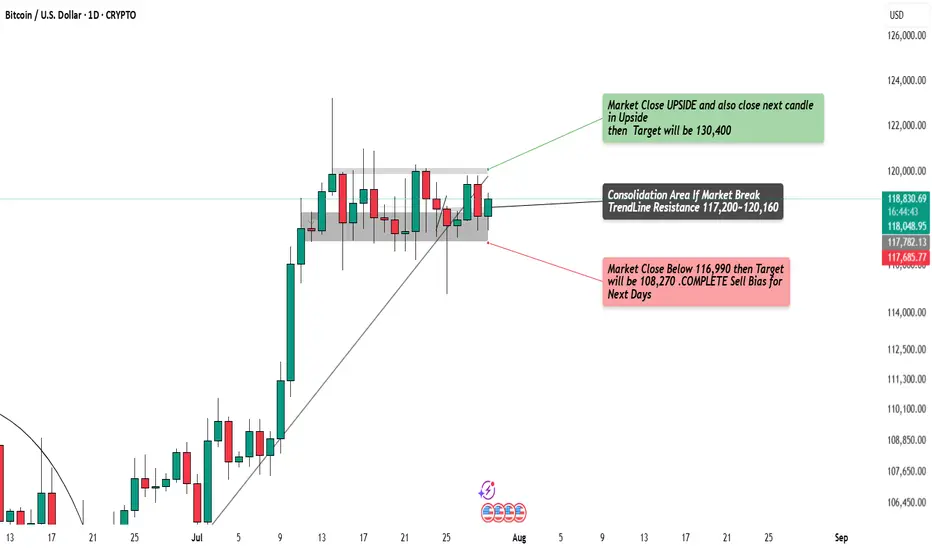
BTC/USD Ready to Explode?Watch 116,990 & 120,160 Breakout Zones!Massive move loading on BTC!
Price is trapped in a tight consolidation zone — breakout above 120,160 = 🚀 to 130,400, while a break below 116,990 = 💀 down to 108,270.
Waiting for 2 daily candle confirmations before entering . Stay sharp — this breakout could set the next major trend.
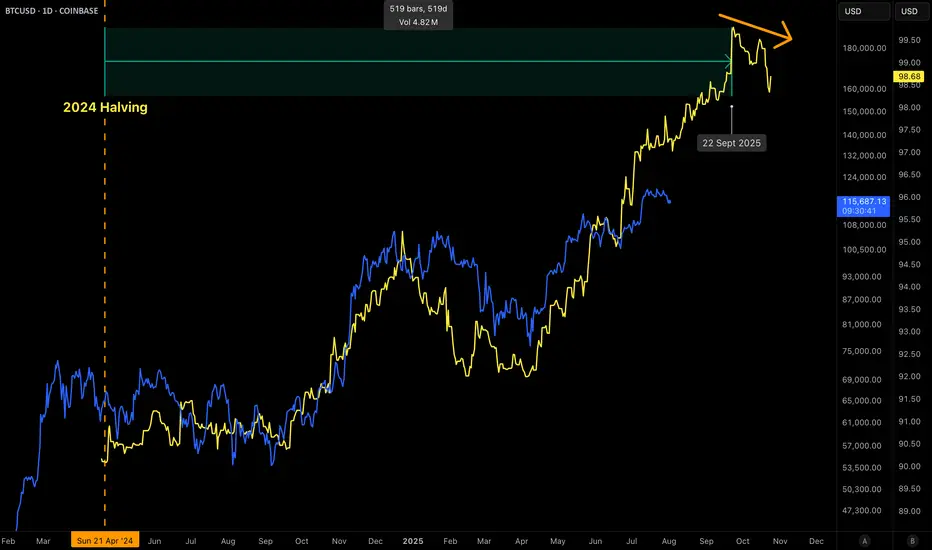
BITCOIN 2025 TOP PREDICTION!This chart represents the M2 Money Supply / BTCUSD correlation with an 84-day delay.
You can see that the M2 Money Supply has formed a double top (with a lower high) in late September.
The price of bitcoin tops out 525–532 days after the halving in every cycle.
What does this mean?
In my opinion, bitcoin will continue to follow the direction of M2 in a highly correlated manner. This would mean that BTC's top is only 2 months away.
What price will bitcoin top?
That I'm not entirely sure of yet. The M2 / BTC correlation can be placed in a plethora of different scales. However, it currently looks like the top will be BELOW $200,000.
I hope to be proven wrong, but as of right now, bitcoin is following previous cycles perfectly (excluding the fact that we created a new ATH prior the halving, this was because of ETFs).
Given diminishing returns (and assuming that "supercycle" is not reached), $135,000 - $190,000 top in late September makes sense.
More Pullback=Further Launch!!The structure has morphed
once again but the direction expectation
is still 100% in tact. In fact, all
we're doing right now is pulling
the bow string back a little more to
allow the arrow to fly up that
much further and faster! BTFD!!!!

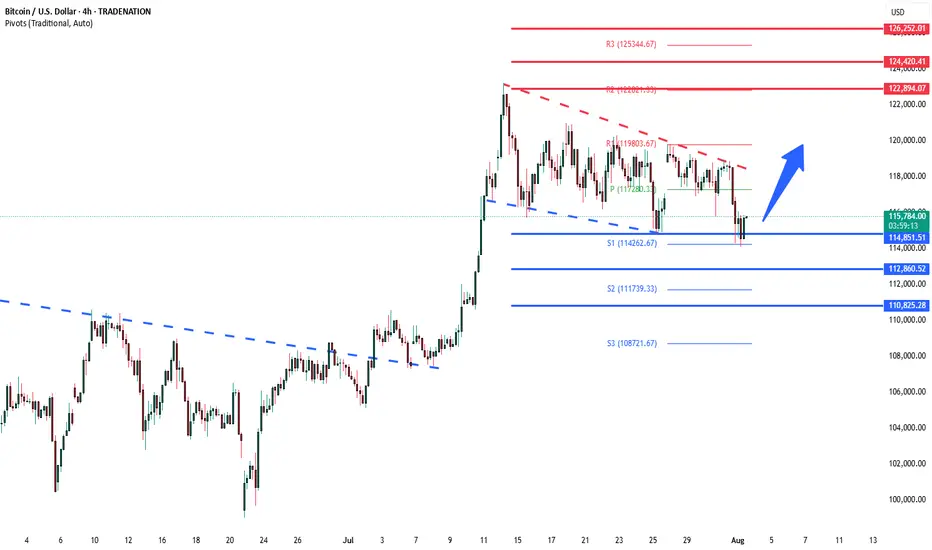
BTCUSD consolidation support at 114,850The BTCUSD remains in a bullish trend, with recent price action showing signs of a corrective pullback within the broader uptrend.
Support Zone: 114,850 – a key level from previous consolidation. Price is currently testing or approaching this level.
A bullish rebound from 114,850 would confirm ongoing upside momentum, with potential targets at:
122,900 – initial resistance
124,420 – psychological and structural level
126,250 – extended resistance on the longer-term chart
Bearish Scenario:
A confirmed break and daily close below 114,850 would weaken the bullish outlook and suggest deeper downside risk toward:
112,860 – minor support
110,825 – stronger support and potential demand zone
Outlook:
Bullish bias remains intact while the BTCUSD holds above 114,850. A sustained break below this level could shift momentum to the downside in the short term.
This communication is for informational purposes only and should not be viewed as any form of recommendation as to a particular course of action or as investment advice. It is not intended as an offer or solicitation for the purchase or sale of any financial instrument or as an official confirmation of any transaction. Opinions, estimates and assumptions expressed herein are made as of the date of this communication and are subject to change without notice. This communication has been prepared based upon information, including market prices, data and other information, believed to be reliable; however, Trade Nation does not warrant its completeness or accuracy. All market prices and market data contained in or attached to this communication are indicative and subject to change without notice.
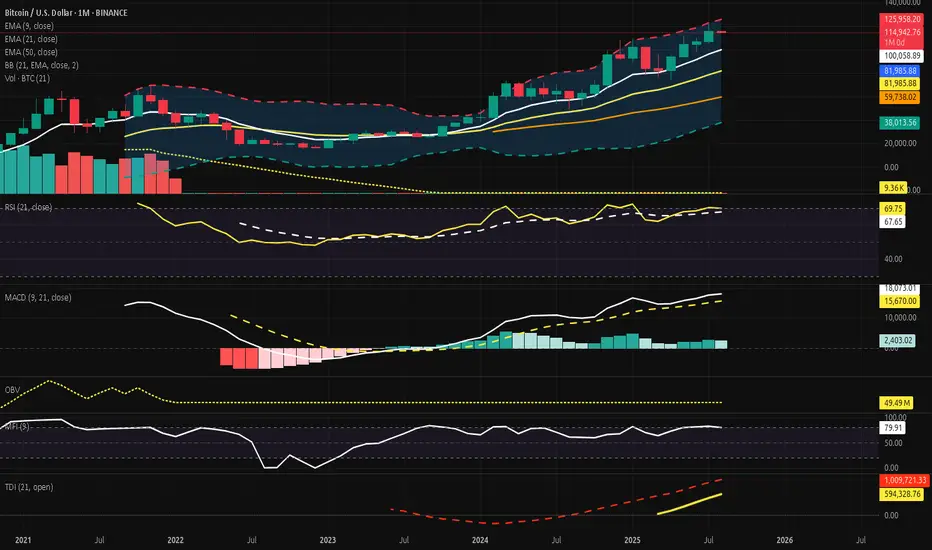
Bitcoin Monthly - Structure Intact, Tension Rising?⊣
⟁ BTC/USD - BINANCE - (CHART: 1M) - (Aug 01, 2025).
◇ Analysis Price: $114,994.73.
⊣
⨀ I. Temporal Axis - Strategic Interval - (1M):
▦ EMA9 - ($100,069.29):
∴ Price holds 14.93% above this dynamic threshold, indicating momentum continuation but also positioning within an overheated range;
∴ The EMA9 structure is firmly ascending, representing the spine of the short-term bullish wave;
∴ July’s candle remains fully above the EMA without testing it - no wick beneath the line-marking dominance of buyers without internal correction.
✴️ Conclusion: The EMA9 governs the tempo of the current trend and stands untouched. Elevated, but structurally intact.
⊢
▦ EMA21 - ($81,990.60):
∴ A core support vector in the macrostructure, now 28.73% below price, suggesting strong bullish detachment from equilibrium;
∴ The line maintains a smooth, upward slope, echoing the recovery arc since late 2022’s structural low;
∴ Its alignment with the Bollinger Basis and Realized Cap forms a triad of reinforced technical stability.
✴️ Conclusion: EMA21 anchors the mid-term uptrend and guards the sanctum of continuation. No breach, no threat.
⊢
▦ EMA50 - ($47,983.10):
∴ Deep beneath price, resting at 58.27% below the current level - a relic of past cycles, yet still relevant as ancestral support;
∴ The EMA50 has curved upward subtly, signaling the final stage of long-term bear cycle recovery;
∴ Price has not interacted with this zone since late 2023, preserving its status as last-resort structural bedrock.
✴️ Conclusion: EMA50 serves as the sacred foundation of the macro trend - distant, but silently upholding the higher order.
⊢
▦ BB (21, 2) - ($81,990.60, $124,871.91, $39,109.29):
∴ The Basis of the bands aligns precisely with the EMA21, confirming equilibrium at ($81,990.60) - the mid-guardian of the macro cycle;
∴ The Upper Band is currently intersecting the candle body at ($124,871.91), marking an imminent volatility ceiling that may trigger either breakout or rejection;
∴ The Lower Band rests at ($39,109.29), far beneath the trend structure, now serving as a shadow chamber rather than an active field of probability.
✴️ Conclusion: The BB channels have opened widely, signaling expansion. With price nearing the upper rim, the phase is volatile but directional. The core remains intact through the EMA21 basis.
⊢
▦ Volume + EMA21 - (37.62B, 29.71B):
∴ Monthly volume for July reached $37.62 Billion, standing above the EMA21 of volume at $29.71 Billion, indicating an active expansion phase in market participation;
∴ This is the third consecutive monthly close above the EMA21, forming a sequence of rising activity that mirrors the price climb - suggesting healthy conviction behind the movement;
∴ The volume body also aligns with bullish momentum confirmation, as it occurs within an ascending slope of the EMA21, avoiding false divergence or exhaustion patterns.
✴️ Conclusion: Volume expansion supports the current trend. The flow is consistent, not speculative.
⊢
▦ RSI (21, 9) - (69.79, 64.71):
∴ The RSI main line stands at (69.79), nearing the classical overbought threshold but not breaching it, reflecting a strong yet controlled uptrend;
∴ The signal line (9-period smoothing) trails at (64.71), confirming positive pressure without showing divergence - both curves remain aligned and ascending;
∴ There is no crossover, no rejection, and no curvature breakdown - suggesting momentum still leans bullish, but the zone is tightening.
✴️ Conclusion: RSI reveals active strength under equilibrium control. Nearing the gates of exhaustion, but no conflict yet.
⊢
▦ MACD (9, 21, 9) - (4,172.31 / 3,423.95 / +748.36):
∴ The MACD Line remains well above the Signal Line, holding a spread of (+748.36), confirming an active momentum cycle;
∴ Both lines are above the zero axis, reinforcing a long-standing bullish wave with consistent inertia since late 2023;
∴ The Histogram is positive, though it shrinks slightly from previous months, suggesting a potential slowing of force - not a reversal, but a breath.
✴️ Conclusion: The MACD still flows in favor of the bulls. The pulse continues, yet shows first signs of contraction. Momentum remains, but vigilance awakens.
⊢
▦ OBV (21, BB2) - (10.27M / 9.82M / 11.19M / 8.45M):
∴ The OBV line rests at (10.27M), positioned above the Basis (EMA21 at 9.82M), indicating a net accumulation bias over the mid-term;
∴ It remains within the upper half of the Bollinger channel, but beneath the upper band, currently at (11.19M), suggesting accumulation without climax;
∴ The bands are widening, signaling expanding participation and heightened flow volatility - yet without destabilization.
✴️ Conclusion: OBV confirms active, steady inflow. Accumulation sustains the structure. Flow is present, but not yet euphoric.
⊢
▦ MFI (EMA9) - (79.90 / 74.63):
∴ The MFI registers at (79.90), resting near the upper saturation zone, traditionally viewed as overbought - but no rejection candle has occurred;
∴ The 9-period EMA smoothing line at (74.63) trails cleanly beneath, reinforcing directional alignment without divergence;
∴ This spread between the MFI and its smoothing curve affirms a persistent inflow dominance, though now nearing exhaustion thresholds.
✴️ Conclusion: The MFI reveals an environment of strong capital influx. Though high, it is not yet reversal-bound. Compression may precede contraction.
⊢
▦ TDI + EMA21 - (69.79 / 64.71 / / 62.00):
∴ The RSI Line (TDI core) sits at (69.79), nearing the volatility band’s upper arc, denoting strong upward rhythm but with limited expansion room;
∴ The Signal Line at 64.71 lags slightly, confirming the trend with no divergence or curvature weakness;
∴ The Volatility Bands (±10 around Signal) contain price action cleanly - upper band at (74.60), lower at (58.83) - showing moderate but controlled pressure;
∴ The EMA21 overlay at (62.00) forms the base layer, maintaining upward inclination and reinforcing long-term trend security.
✴️ Conclusion: The TDI remains bullish, harmonized, and stable. Momentum leads, volatility permits. No rejection yet, but expansion space is finite.
⊢
🜎 Strategic Insight - Technical Oracle:
𓂀 The monthly structure reveals a state of controlled elevation within a structurally sound uptrend, yet with rising compression near upper bounds. The convergence of indicators outlines a field that is both fortified and tense;
∴ EMA9, EMA21, and EMA50 remain fully aligned and ascending - the Exponential Trinity forms a resilient foundation, untouched by regression;
∴ Bollinger Bands (21) have widened, and price now hovers near the Upper Band, suggesting that the volatility channel is at maximal stretch; further price advance may trigger short-term exhaust or rejection;
∴ Volume + EMA21 confirms that market participation has expanded meaningfully across three consecutive months - a sign of conviction rather than speculation;
∴ RSI (21, 9) and MFI (EMA9) hover in elevated zones, signaling latent overextension, yet without immediate signs of breakdown - still ruled by strength, not fear;
∴ MACD (9, 21, 9) retains bullish momentum, though its histogram begins to contract slightly, marking a potential early shift in impulse rhythm;
∴ OBV confirms accumulation without climax, and the TDI shows synchrony, yet the volatility band ceiling is near - a gateway, or a wall.
✴️ Synthesis Technical: The structure is strong, but stretched, all trend anchors remain intact, and no macro-reversal signal is present. However, the cluster of elevated oscillators and narrowed volatility envelopes warns:
∴ The next impulse will define the phase - either breakout beyond resistance ($125K+) or pullback to base zones near EMA21 (~$82K).
⊢
∫ II. On-Chain Intelligence - (Source: CryptoQuant):
▦ Realized Cap - UTXO Age Bands - ($437.6B):
∴ Capital density remains clustered in the 3m / 12m range, signifying strong mid-term holders anchoring price memory beneath $90K;
∴ The realized cap has risen steadily, confirming new capital commitment and reinforcing the EMA50 region as the “Arcane Bedrock”;
∴ No abrupt aging shift - holders have not fled, nor distributed heavily.
✴️ Conclusion: The realized cost base is lifting upward; Structure is strong beneath price.
⊢
▦ Whale to Exchange Transactions (Binance) - (Rising):
∴ Transfer spikes occurred in mid and late July, echoing pressure near technical ceilings;
∴ Whale flow to exchanges signals potential supply reloads, though no persistent distribution trend is confirmed;
∴ Activity suggests readiness, not execution - threat held in silence.
✴️ Conclusion: Whales signal tension, not aggression; Movement is tactical.
⊢
▦ MVRV Ratio + EMA9 - (2.257 / 2.039):
∴ The MVRV ratio holds above 2.0, implying price trades at over twice the realized cost basis - historically a zone of caution;
∴ No divergence from the EMA9; both slope upward - valuation expansion continues, but no climax;
∴ Price remains above the line of equilibrium, but not in parabolic distortion.
✴️ Conclusion: MVRV confirms overvaluation, but not detachment; Risk is elevated, but contained.
⊢
▦ Exchange Net Position Change (BTC) - (–35,871 BTC):
∴ Net outflows persist, with 35,871 BTC withdrawn in the last monthly cycle;
∴ This behavior aligns with strategic cold storage accumulation, reducing circulating pressure;
∴ On-chain confirms technical's: price rises on supply contraction, not mere speculation.
✴️ Conclusion: Bitcoin leaves the field; Supply retracts as price ascends; Structure reinforced.
⊢
🜎 Strategic Insight - On-Chain Oracle:
𓂀 The on-chain field reveals a fortified structure of conviction beneath the surface of price. Flow, cost basis, and behavior of dominant agents all signal a phase of controlled strength, though shadowed by rising valuation pressure;
∴ The Realized Cap ascends in harmony with price - an uncommon convergence. It suggests that new capital is not merely speculating, but embedding itself into the very structure of the network. The UTXO Age Bands reveal no panic rotation - holders remain;
∴ Whale Transactions to Exchanges rise in key moments, particularly around technical compression points. They do not yet dominate the flow, but stand ready - guardians or destroyers, in silence;
∴ The MVRV Ratio, though elevated, does not deviate violently. It warns, but does not collapse. It reflects a price above cost, but not a mania;
∴ The Net Exchange Position continues its descent. Bitcoin leaves the field; Supply contracts; This is not exit liquidity; This is strategic withdrawal.
✴️ Synthesis Technical: The network breathes in accumulation, not inflation; The participants anchoring this cycle are deliberate; On-chain structures confirm that value is migrating into dormancy, not into exits. The risk is not in structure collapse, but in overvaluation compression - a tightening halo around price.
⊢
⧉ III. Contextvs Macro-Geopoliticvs - Interflux Economicvs - (Jul 31, 2025 - Post-FOMC Strategic Decoding):
▦ FOMC Decision - (July 31, 2025):
∴ The Federal Reserve held its benchmark interest rate steady at (5.50%), marking the fourth consecutive pause - a clear stance of vigilant hold;
∴ The tone was neutral-hawkish, acknowledging progress on inflation while leaving the door open for future hikes if data demands;
∴ No mention of cuts. The Fed maintains narrative control - a message to both markets and sovereigns: we're not done yet.
▦ Jerome Powell’s Address:
∴ Powell reiterated the “data-dependent” framework, but expressed concern over sticky inflation in services and housing;
∴ He praised the resilience of the labor market, signaling no urgency to ease policy;
∴ His delivery was measured, ambiguous by design, injecting uncertainty - fuel for volatility, not clarity.
▦ Market Response - (Traditional Finance):
∴ The DXY (Dollar Index) swung sharply, but closed neutral, reflecting indecision over the Fed’s path;
∴ The S&P500 and Nasdaq attempted intraday rallies but reversed lower - a reaction to Powell not being “dovish enough”;
∴ Gold and Silver caught bids - hedges moved in, not out.
▦ Bitcoin (BTC/USD) Response:
∴ Bitcoin spiked on initial Fed release, tagging the upper Bollinger Band (1M) before retreating slightly - not a rejection, but a breath;
∴ No capital flight occurred. The response was measured and strategic, not speculative;
∴ On H4, Bitcoin touched the EMA200, reinforcing it as a post-FOMC decision point.
✴️ Macro Synthesis: The Fed sheathed the blade but did not lower the shield; Powell’s message: discipline remains. Markets flinched but did not panic; Bitcoin stood firm. This was not a moment of collapse - this was a moment of calibration.
⊢
⌘ Codicillus Silentii - Strategic Note:
𓂀 Let this note be written in the margin of all oracles, beneath the seals and above the motion: This is a cycle governed not by noise, but by intent restrained; The silence between macro movements, the calm in on-chain flows, and the geometry of structure all speak one truth:
The system is waiting;
There is no breakdown;
There is no climax;
There is only a tightening coil - one that neither confirms euphoria nor accepts rejection.
∴ Bitcoin holds above its sacred averages;
∴ The on-chain breath is slow, but pure;
∴ The macro field is firm, yet not soft.
⟁ The next force will not be a whisper - it will be a break or a roar.
✴️ Let no position be based in hope;
✴️ Let no assumption ignore volatility’s patience;
✴️ Let silence guide the strategy, not emotion.
⊢
𓂀 Stoic-Structural Interpretation:
∴ In the mirror of the arcane chart and the silence of on-chain flow, the Stoic lens reveals not merely price action - but the nature of motion itself;
∴ All movement is governed by tension and release, control and surrender. This cycle is no different;
∴ The trend holds, but does not rise arrogantly. It is disciplined;
∴ Capital flows, but not chaotically - it retreats where needed and commits only in strength;
∴ The macro world tempts chaos, but Bitcoin walks with its own gravity - unmoved unless chosen;
∴ Indicators show power without delusion, and pressure without collapse.
This is not a time for euphoria;
This is not a time for panic;
This is a time to observe structure, act with clarity, and remain unshaken.
✴️ The Stoic sees the signal beneath the storm:
Structure is intact;
Trend is valid;
Valuation is tense;
Strategy must remain cold.
⟁ Therefore, the Stoic does not chase candles; He waits for break of structure, or confirmation of continuation; No action is better than misguided motion.
⊢
✦ Structure: Bullish - (Controlled Phase).
∴ All key exponential moving averages - EMA9, EMA21, and EMA50 - remain aligned and ascending, with no curvature breakdown or crossover threat;
∴ Momentum indicators (MACD, RSI, TDI) are positive and synchronized, with no bearish divergence or rejection confirmed;
∴ Price holds above the EMA9 and remains well above the Bollinger Basis, signaling ongoing trend dominance;
∴ Volume exceeds its 21-month moving average, reflecting conviction, not hollow motion.
⟁ However:
∴ The structure is technically stretched - several oscillators approach saturation thresholds, signaling compression, not collapse;
∴ This is a bullish structure, but under strategic tension, not euphoria.
✴️ Final Judgment: Bullish Structure, currently in a compressed expansion state, preparing for either breakout continuation or technical correction - but showing no signs of structural reversal.
⊢
⧉
· Cryptorvm Dominvs · MAGISTER ARCANVM · Vox Primordialis ·
⚜️ ⌬ - Silence precedes the next force. Structure is sacred - ⌬ ⚜️
⧉
⊢
BTC is likely to resist falling below $112000BTC is likely to resist falling below $112000
If the confluence between the yellow trendline and the top green horizontal support level dont hold strong, we are likely to see BTC retrace to $100K
Please trade with care.
My thoughts are shown on the chart technically
I hope to connect with you.
Please like, share, comment and follow me.

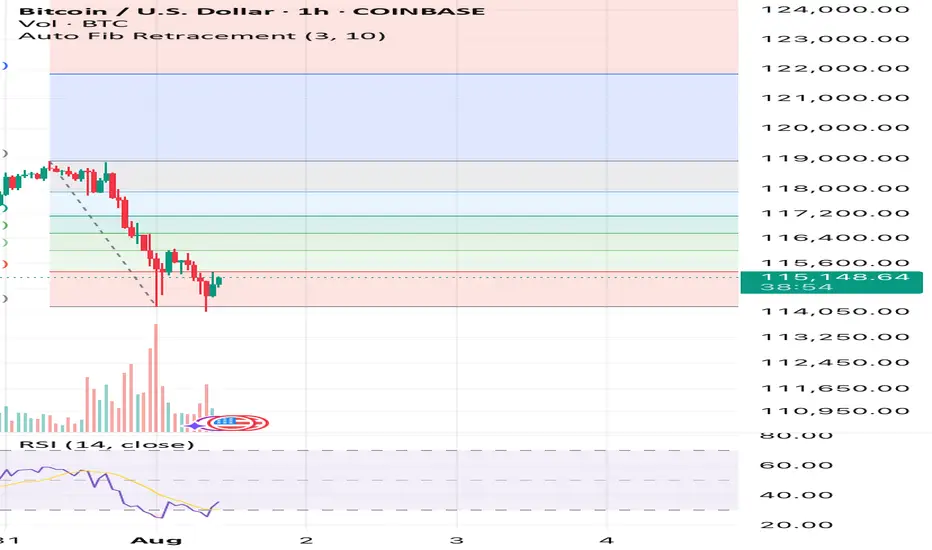
Bitcoin has an upside to it if we hold above $14,900See what you think it’s simple Auto Fib Retracement and RSI. That’s all I’m using here and also past times and other data outside of this image but inside the CRYPTOCAP:BTC market.
What you think? Up to $118k again before down or sideways? Or will this be the end of the large bull flag formation? We’ll soon find out!
Liquidity sweep to $111,000 then bounce to new ATHBTC must see a liquidity sweep down to the previous resistance level of around $111k wiping out the over leveraged longs before a push to new highs. We are seeing this slowly unfolding now where a push down to $114k has just happened. Soon a momentary push down to $111k hitting old resistance levels and the currently 50 day moving average will occur with a quick bounce back to $114-$115k.
THIS IS WHEN WE WILL SEE NEW ATH’s🚀🚀
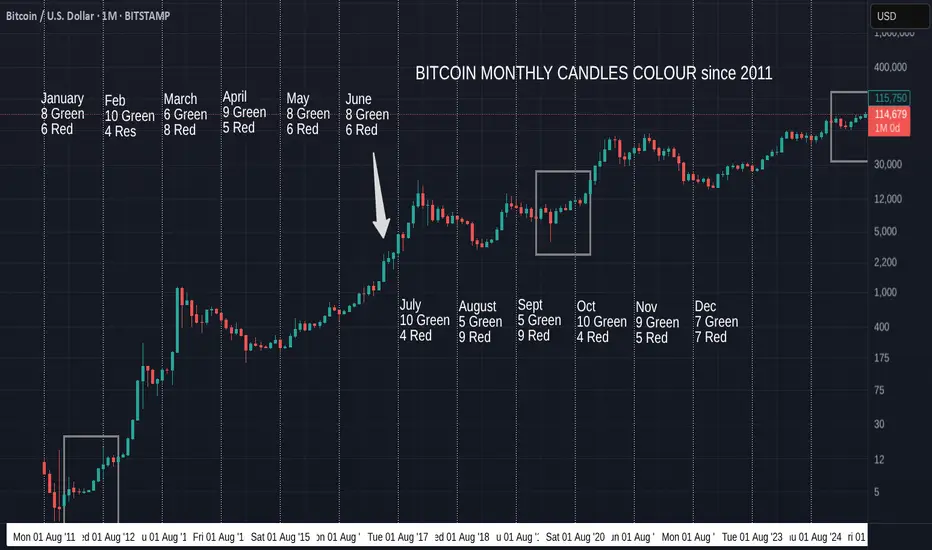
Bitcoin Monthly Candle Colour patterns and Colours since 2011
We got the expected GREEN July and so, amazingly, we continue to repeat the pattern from January to July 2012. ( Left Box )
It is almost the same pattern as 2020, apart from the Red May candle in that Year. (Right box)
The Large Arrow points towards another occasion where we had a series of consecutive Green candles from March to July, though these candles sizes are nothing like the ones we are currently experiencing.
The Boxes show us The only 2 occasions where we have had a Green December, Red January, Red February, Green March, Green April.
Then we had a Green May 2012 and a Red May 2020
Then both repeated a Green June, Green July.
The thing to note here is how all these are en-route to Cycle Highs.
So, August count currently is 5 Green to 9 Red, so the Odds are, while looking at BTC History, that we will get a RED August
HOWEVER, if we continue this run of following previous patterns, we will see a GREEN August.
In fact, 3 of those 5 Green August closes were in these 3 patterns mentioned.
Every single one of the 5 Green previous August followed a Green July, the last time was in 2021.
As mentioned in last months report, the size of the candles currently in this pattern are more like those in 2020 than the other 2 patterns talked about here.
With this in mind, we may expect a smaller Green candle close for August , Followed by a small Red candle in September. This did also happen in 2017 ( Arrow).
This August has opened Red but so far this year, many month opens were red and then changed.
So, My expectation id for a small Green August as markets cool off over the holidays and we wait for the start of Q4 in October.
We will have to wait and see as ever
Stay safe