BTCUSD ShortBTCUSD is now net short on the regression break.
I am hedging out my cold wallet holdings.
BTCUSD trade ideas

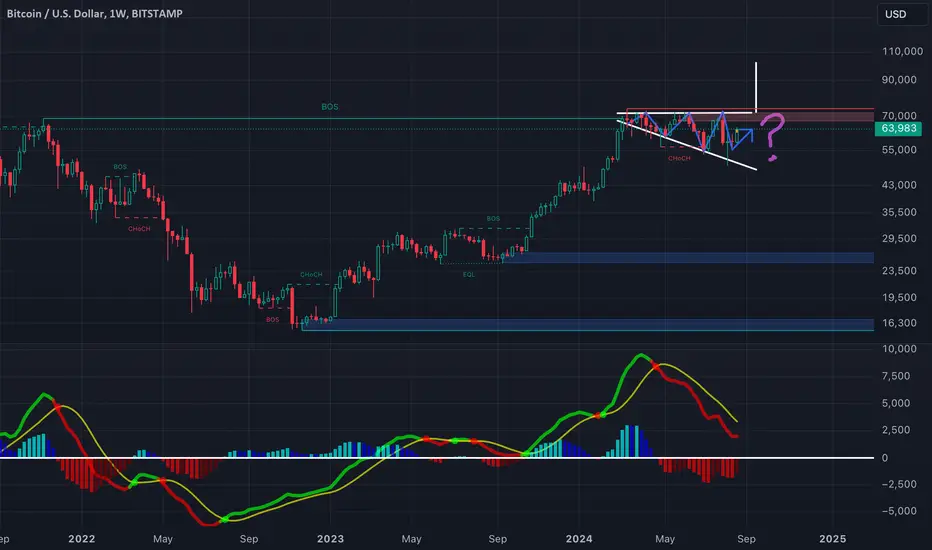
Please comment your opinion Greetings and respect to the analysts
This btcusd chart is on bitstamp I know the general analysis of what exists in the market, but please comment your opinion on this chart and the fractal and ascending channel that the price has always respected.

Bitcoin Go 135kBitcoin has not yet reached the channel ceiling and should bounce back after the resistance.
Bitcoin
Tp1:128000
To2:130000
Tp3:133000
Tp4:135000

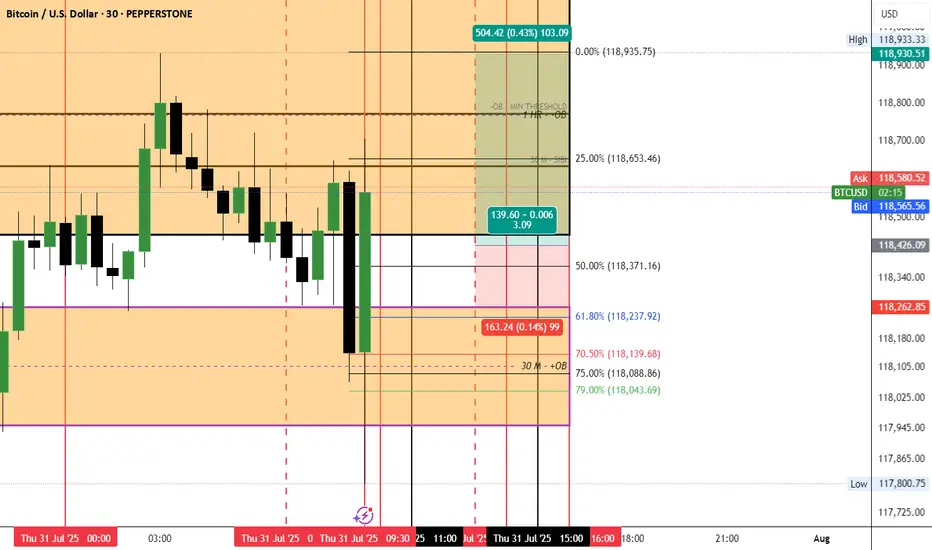
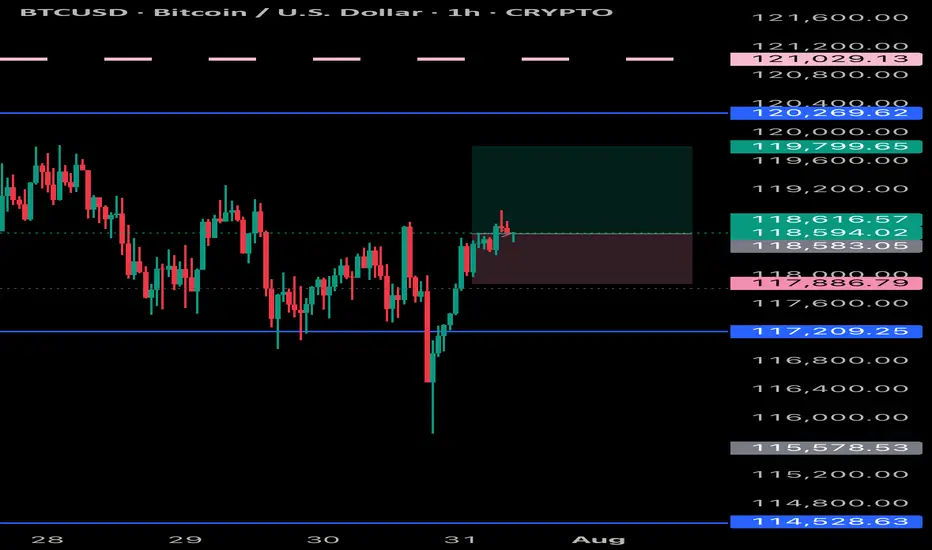
BTC LONG IDEA
My short term analysis of a long BTC Setup
ENTRY @ PRICE = 118,422
SL @ PRICE = 118262
TP @ PRICE = 118930
A rocket is fueling on the launch padNever before has Bitcoin so thoroughly built a launch pad. Retail interest is still low after the 2024 top and corporate/governmental interest is through the roof. This is going to be a massive bubble playing out over the next 3-6 months, possibly even over $300k Bitcoin at the end as the narrative shifts from "BITCOIN IS SPECULATIVE" to "BITCOIN IS A MUST HAVE ASSET" and retail will FOMO in as they always do.
The higher it goes, the more brutal the bear market will be. in late 2026-2027 the narrative will be "CRYPTO IS A SCAM". Corporate treasuries that jumped in late will be dumping bitcoin from their balance sheet and all these leveraged longs will fully unwind. Whales will start to accumulate and the 2029 cycle will be epic.
I'll believe cycles are dead when i see evidence of it. I haven't yet. Play this one right boys! Life changing money is coming.


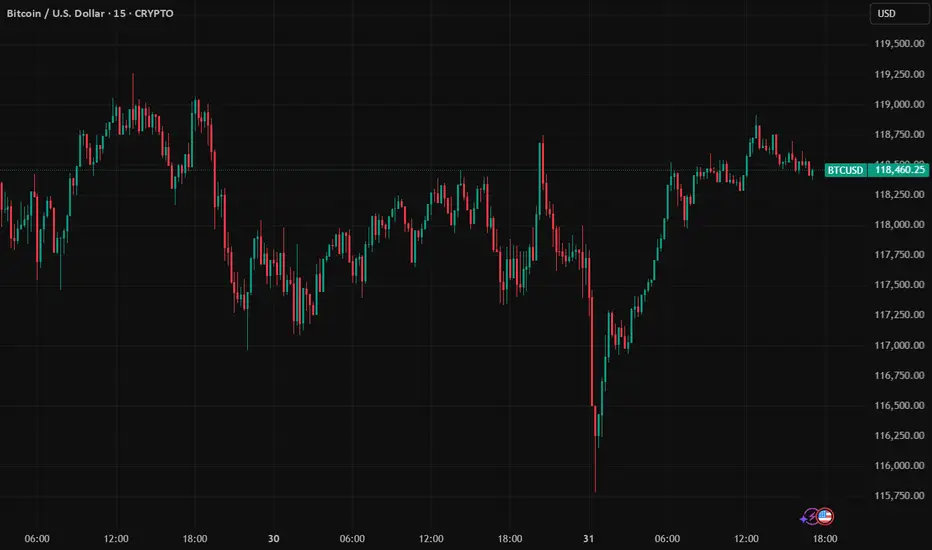
Bitcoin (BTC) Price Analysis – Short-Term vs. Long-Term Outlook"Bitcoin (BTC) Update:
4H Trend: Bearish below $119,500.
30M: Squeezing—prepare for a breakout!
15M: Double Top warning below $118,250.
Trade Plan:
Buy if BTC holds above $119,500.
Sell if it breaks $118,250.
#Bitcoin #Trading #Crypto"*
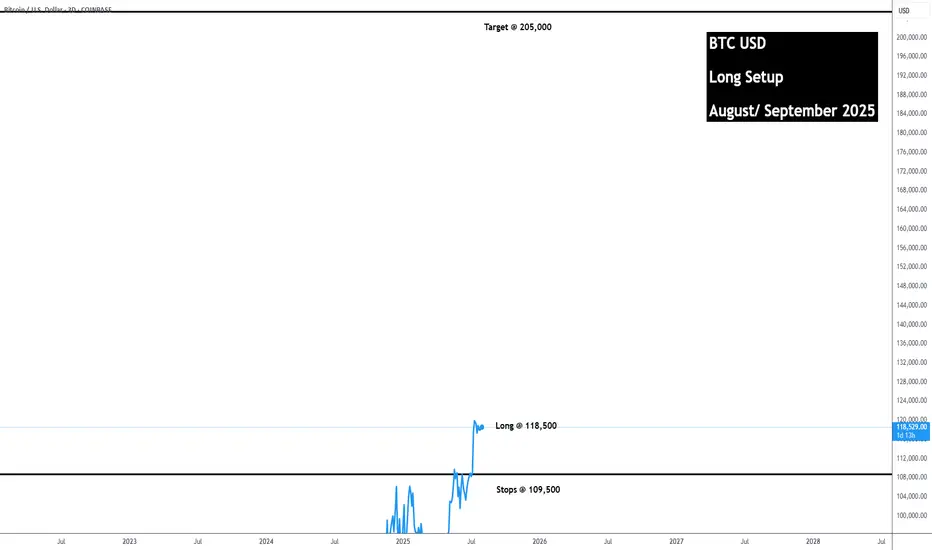
BTC USD Long 205,000 TargetI think it will reach the 200,000 range during August/ September 2025.
Update when needed.
BTCUSD INCREASES Bitcoin looking to be targeting new highs and I’m simply following the trend and keeping trading simple
BTC #This 15-minute chart of Bitcoin (BTC/USD) This 15-minute chart of Bitcoin (BTC/USD) shows a strong bullish recovery from the support zone near 117,200 (blue horizontal line). Price has formed a bullish continuation pattern (potential ascending triangle or flag) supported by the red trendline. The gray curved arrow suggests a projected bullish breakout toward the 119,600–119,800 resistance area. The breakout above the shaded demand zone and consolidation near the highs indicates strong buying interest. Watch for a clean breakout above recent highs for continuation.

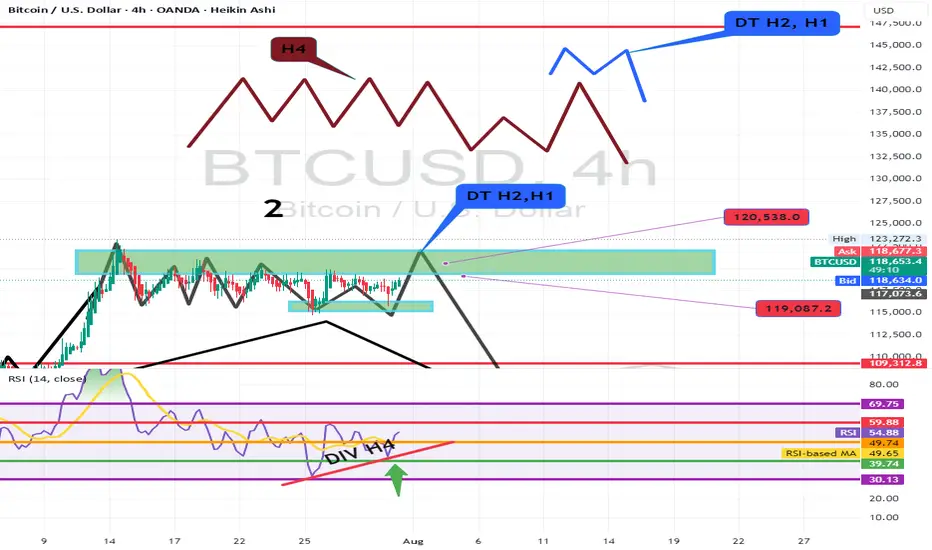
BTC USDHI GUYS.
update on daily path, weekly path to incoming serious sells.
on the right we see h4 buys to clear upper area. then i expect sells soon with h2,h1 double top price action incoming
Btcusd techinical analysis.Btcusd techinical analysis next move posibale at h1 time frame not finchinal.

Potential Long Scalp Trade for BTCBitcoinUSD is testing support at $116,400. Depending on this 1HR close, we could have a long trade scalp opportunity for it to reach PoC @ $118,000 to test resistance there. Stop loss would be set below wick @ $115,700. Open Interest for shorts and longs has gone up at this candle. If support holds, shorts will be underwater and liquidation will push prices up.

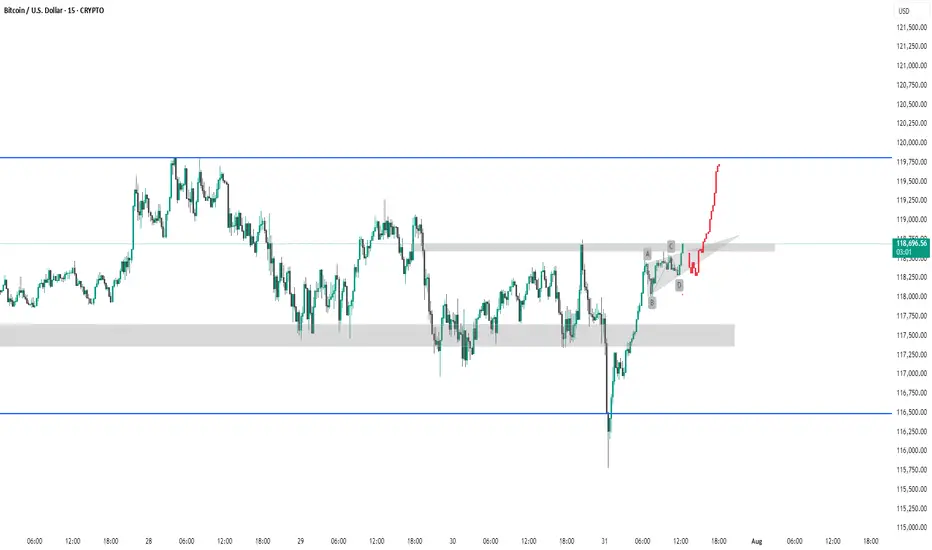
BTC #This is a 15-minute Bitcoin (BTC/USD) chart showingThis is a 15-minute Bitcoin (BTC/USD) chart showing a potential bullish breakout scenario. Price has broken above a key resistance zone (gray shaded area) and is forming a possible bullish continuation pattern (ABCD structure). The red projection indicates a bullish price target towards the 119,750–120,000 USD resistance area (blue line). Confirmation of breakout and sustained momentum above the gray zone would validate the bullish outlook.
thanking you

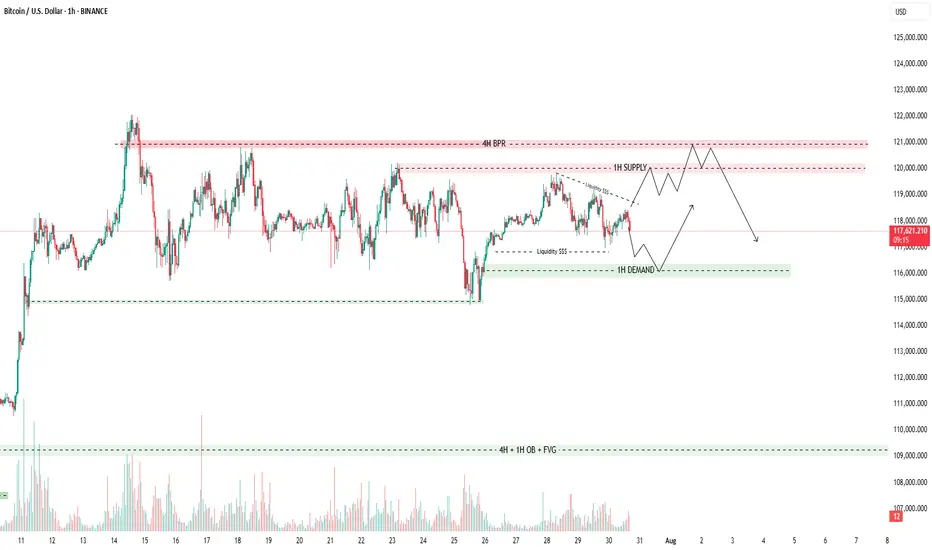
#BTCUSD 31st July View#BTCUSD Hasn't taken out its recent high, where all the other alt coins particpated in another high. Now it it fails and panic in 3-7 swing we will continue to buy for target of 132000$++ BINANCE:BTCUSD

Confluence Timing: How Precise Geometry & Magnet Zones Forecast 🌀 Confluence Timing: How Precise Geometry & Magnet Zones Forecast Flushes & Breakouts
📅 Date: July 31, 2025
🔎 Symbol: BTCUSD
📈 Timeframes: 4h, 1D, 1W
🧠 Concept Overview
What if we could predict high-impact moves not by guessing direction — but by timing structural convergence?
In this article, we present a geometric confluence model for BTC, where the intersection of diagonal structures and median zones has shown a recurring pattern of magnetism — leading to flushes, rebounds, or volatile breaks.
---
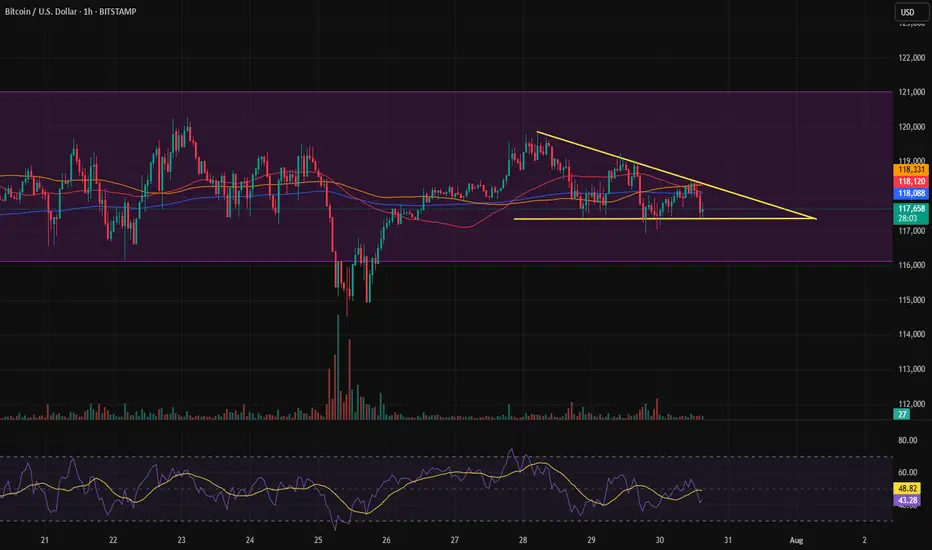
🔍 The Setup: Current Structure (as of 118.3k USD)
We are inside a compression structure, with:
Descending triangle resistance (upper yellow line, near 119k–120k)
Rising base support (lower yellow diagonal, anchored from ~114.5k)
Volatility median created from historical channels (parallel projection)
EMA Compression (8/13/21) on the Daily, showing dynamic tightness (~1.9 %)
→ Intersection timing of these structures projected a confluence window within 6h, confirmed by price clustering near apex.
---
🧪 Historical Backtest (Past 3 Years)
We analyzed similar confluence points using the same logic (RSI intact, EMAs tight, price near diagonal apex):
Event Date Timeframe Structure Result Movement
Oct 2023 1D Falling wedge & EMA cross Rebound +6.3% in 24h
Jan 2024 4h Triangle tip near POC Flush –4.5% in 6h
Mar 2025 1D Channel + RSI divergence Breakout +8.1% in 2 days
🧾 Average move from apex reaction zone:
Up: +6.8 %
Down: –4.2 %
Reaction window: within 6–12h of intersection
---
📊 Indicators in Play
EMA Cluster Contraction: 8/13/21 are within 1.9 % on Daily — historically leads to move within 12–24h
RSI(14) Stable + Fast RSI Rebound: Supports bullish continuation
Volume has dropped pre-break, classic behavior before resolution
Heatmap above shows major absorption at 119.0–119.4k
---
📌 Forecast Expectation
⏳ Timing: Apex cross within 6h
📈 If breakout: Target 122.8k → 124.4k → projected 127.6k
📉 If fakeout or flush: Bounce likely near 116.3k → watch for reclaim
📉 Short-term bear warning: Only if RSI breaks below 50 and EMAs get crossed to downside with volume spike.
---
📍 Actionable Notes
Long bias remains valid as long as structure holds and RSI remains above midline
A flush below 117.2k could trigger short-term breakdown, but buy-the-dip zones are active at 116.3k
Next major long opportunity: If price reclaims post-flush zone or breaks out above 119.8k with confirmation
Confluence model now active: future alerts will warn 4–6h before similar apex intersections
---
🧭 Conclusion
This is not just pattern trading. It’s time-sensitive geometry-based confluence tracking, with proven historical accuracy and structural logic.

BTC intra?
Hi,
This price 118700 is stubborn.
Next time test again.. We shall buy a ticket for upsides.
Watch it.. could be flying if the top is broken again
Do nothin if price isn't into it
All the best
Not a guru.

$BTCUSD, rally into rate cuts?BITSTAMP:BTCUSD has been coiling for some time now in a right angled descending broadening wedge.
A measured move of this cone so far would place BTC at right around ~$100k.
This aligns well with historical performance of BTC heading into a cutting cycle. If we rally into September and have a selloff following the cuts (sell the news), I wouldn't be shocked. This is a pattern that has happened in multiple years of the previous QE/QT Cycle (2016/2017, 2019/2020).
The real fireworks will be in 2025 if things go according to the FED's schedule
Bitcoin - Structural Ascendancy under Silent Momentum.⊣
⟁ BTC/USD - BINANCE - (CHART: 1D) - (Jul 29, 2025).
◇ Analysis Price: $118,996.40.
⊣
⨀ I. Temporal Axis - Strategic Interval - (1D):
▦ EMA9 - (Exponential Moving Average 9) - ($118,352.22):
∴ This short-term exponential blade reflects immediate price sensitivity, showing reactive balance across recent closes;
∴ Price currently floats above this threshold, indicating micro-support for the bulls - a soft floor in the fog of uncertainty;
∴ The EMA9 line curves gently upward, though not sharply - signaling lingering momentum, but without fury.
✴️ Conclusion: EMA9 acts as a dynamic support amid deceleration; a watchful line between calm consolidation and renewed ascent.
⊢
▦ EMA21 - (Exponential Moving Average 21) - ($116,729.10):
∴ This mid-range trend beacon provides clearer directional context - its upward slope holds the spell of continuity;
∴ Price rests safely above this median force, confirming bullish alignment;
∴ However, the arc begins to curve with less conviction, a signal that the current push is softening.
✴️ Conclusion: EMA21 maintains bullish structure but foretells potential slowing; if momentum dims further, this level may serve as magnet for retracement.
⊢
▦ EMA50 - (Exponential Moving Average 50) - ($112,511.79):
∴ The long-arm average projects the memory of the trend - the deep root under the recent canopy;
∴ Price is far above this line, a sign of strong prior conviction from bulls;
∴ Its firm inclination remains intact, yet price distance signals risk of gravitational return should upper momentum fracture.
✴️ Conclusion: EMA50 preserves bullish foundation, but may become a zone of rebalancing if the rally loses vitality.
⊢
▦ BB (21) - (Bollinger Bands + SMA21) - ($117,764.35):
∴ The Bands, ever sensitive to volatility’s breath, expand wide - a sign of elevated tension and price exploration;
∴ Price nears the upper band ($121,401.48), a common altar for speculative saturation and potential rejections;
∴ The median band (SMA) acts as equilibrium, now beneath the price - suggesting deviation from balance.
✴️ Conclusion: BB21 signals a volatile climax zone; price at the upper band often faces a verdict - continuation by force, or descent by default.
⊢
▦ Volume + MA21 - (Last - 148 vs Average - 363):
∴ Volume flows now with diminished voice - the current bar echoes only 148 units against a historical pulse of 363;
∴ Such silence beneath a rising price may betray a hollow rally - or a pause before engagement;
∴ Absence of participation often precedes reversal or sudden liquidity spikes.
✴️ Conclusion: Subdued volume undermines the bullish signal - lack of validation breeds caution in forward projection.
⊢
▦ RSI - (Relative Strength Index 21) - (61.41):
∴ RSI remains in neutral-high territory, not overbought, but clearly tilted toward bullish control;
∴ Momentum persists but shows signs of plateau - recent movement flattens after steady ascent;
∴ Without new strength, RSI may drift toward the median.
✴️ Conclusion: RSI shows bullish favor, but the fire beneath the trend cools; next candles will determine if it's pause or fade.
⊢
▦ MACD - (9, 21) - (Histogram: –455.70):
∴ MACD line at 2,078.82 vs Signal line at 1,623.12 suggests bullish dominance in structure;
∴ Yet the negative histogram tells a story of fading acceleration - as if the charge slows though direction holds;
∴ This divergence signals decay beneath strength, an omen of indecision.
✴️ Conclusion: MACD is structurally bullish, but its weakening impulse demands attention - the momentum candle dims.
⊢
▦ StochRSI - (3, 3, 21, 9) - (%K: 20.46 / %D: 23.93):
∴ The indicator rests near the lower bounds (sub-25) - a territory of emotional exhaustion and tactical reversion;
∴ A cross upward from these levels often ignites short-term rally pulses;
∴ No confirmed crossover yet - but proximity speaks of potential awakening.
✴️ Conclusion: StochRSI breathes in the lowlands, poised to reverse if kinetic force is summoned.
⊢
▦ OBV - (On Balance Volume) - (102.17M):
∴ The OBV remains elevated, suggesting previous bullish runs were volume-supported, not hollow;
∴ However, flatness in recent OBV progression warns that fresh volume is not accompanying the current price hold;
∴ It whispers of consolidation, or worse - divergence.
✴️ Conclusion: OBV confirms the history of strength, but offers no new blood to feed the advance.
⊢
🜎 Strategic Insight - Technical Oracle:
∴ The battlefield holds its shape - the banners of bullish trend still wave, upheld by structural support from EMA's and historical OBV flow. But the wind... it stills.
∴ Volume fades, momentum indicators lose their incline, and oscillators rest on edges. This is a moment of price levitation - elevated without lift. The form remains, but the force hesitates.
∴ The Arcane Pattern whispers:
Should volume return and MACD reignite, $121K may be pierced with clarity;
If silence deepens, however, the bands will contract, and price may descend toward EMA21 or even test EMA50.
∴ The Vortex of Pause has formed. From here, either ignition... or gravity.
⊢
𓂀 Stoic-Structural Interpretation:
▦ Structurally Bullish - Strategically Cautious:
∴ Price remains securely above all major (EMA's 9/21/50) on the daily chart, preserving directional integrity;
∴ Bollinger Bands expanded near upper thresholds, signaling climax zone - yet not rupture;
∴ Momentum indicators (MACD, RSI) maintain bullish structure, but histogram weakness and RSI flattening warn of interior softening;
∴ Stoch RSI in low-band suggests reversal potential, but has yet to trigger.
✴️ Conclusion: Market structure supports continuation, but momentum exhaustion and low volume raise caution flags. Bulls hold the field - but must call the wind.
⊢
▦ Tactical Range Outlook:
∴ Upper Limit: $122,054 - Fibonacci 1.0 and previous cycle top;
∴ Short-Term Support: $118,352 - EMA9 + 0.618 Fib confluence;
∴ Median Guard: $116,729 - EMA21 + 0.382 Fib;
∴ Sacred Support: $112,511 - EMA50 base + structural floor;
∴ Final Bastion: $103,971 - 0.236 Fib retrace (macro turn pivot).
✴️ Conclusion: Bullish path remains sealed while price resides above EMA50 and above $103K. Breach of that zone could awaken deeper volatility structures.
⊢
◩ Codicillus Silentii - Strategic Note:
∴ Price stands at the edge of Fibonacci climax, just below the mythic $122K - a known threshold of reaction;
∴ Volume whispers, not commands - the force of momentum now rests on belief, not confirmation;
∴ The convergence of structure without influx invites caution. This is the realm not of action, but of observation.
✴️ Final Seal: Beware the illusion of calm. A structure may stand in silence, but silence precedes collapse as often as continuation. The Sacred Frame is intact - but shall remain sacred only through vigilance.
⊢
⧉
· Cryptorvm Dominvs · MAGISTER ARCANVM · Vox Primordialis ·
⚜️ ⌬ - Silence precedes the next force. Structure is sacred - ⌬ ⚜️
⧉
⊢

Bitcoin is in a coma.I see a larger range where Bitcoin is showing compression and indecision.
Whenever it breaks out of this compression, if it breaks to the upside, the first target would be the top of the channel, with hopes of a channel breakout.
If it breaks to the downside, the first target would be the bottom of the channel, with hopes of a breakdown.
In either case, we only enter with a confirmed trigger.
BTCUSDT BUYING AND SELLING SETUP !🔻 SELLING ZONE: 119,817 – 120,215
🔴 VERY STRONG SELLING ZONE: 120,700 – 121,122
🟢 BUYING ZONE: 115,823 – 116,392
✅ VERY STRONG BUYING ZONE (Buy Limit): 109,221
Watch these zones closely for potential entries. Wait for confirmation before executing trades and always follow proper risk management.