BTCUSD 7/28/2025Just so you can see what I see... We read Candles over here!
_SnipeGoat_
_TheeCandleReadingGURU_
#PriceAction #MarketStructure #TechnicalAnalysis #Bearish #Bullish #Bitcoin #Crypto #BTCUSD #Forex #NakedChartReader #ZEROindicators #PreciseLevels #ProperTiming #PerfectDirection #ScalpingTrader #IntradayTrader #DayTrader #SwingTrader #PositionalTrader #HighLevelTrader #MambaMentality #GodMode #UltraInstinct #TheeBibleStrategy
BTCUSD trade ideas

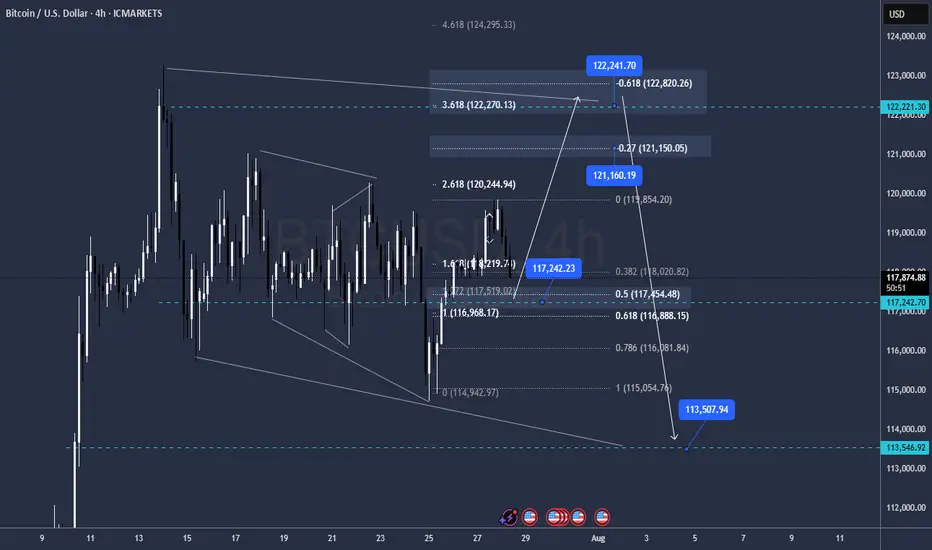
BTC new meassuresokay impulse is pretty much clear
buy level 117.250 Targtting 121.100 / 122.200 / 122.800
Sell level 122.200 targetting 113.500
Re buy level 113.500 targetting 127.500 / 133.000
GG
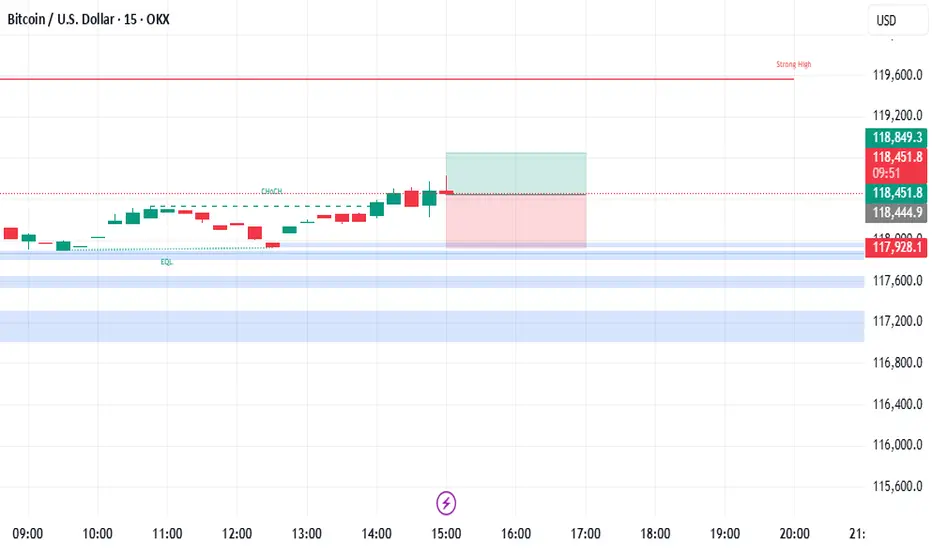
BTC Short Scalp TradeBitcoin has reach the top of downtrend channel which seems to be holding as significant resistance @ $119,600. The Volume Area High is also located at this level. This gives opportunity for a short scalp trade with TP at $118,200 where a NPoC and PoC of Volume Profile is located. Stop Loss is 0.67% above entry with $7.4M of Sell Book order volume.
NPoC

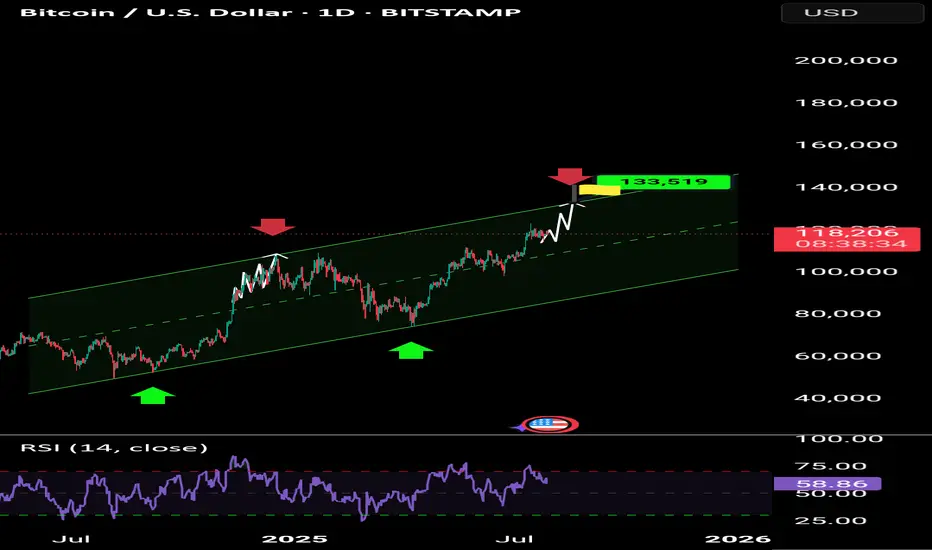
Bitcoin Go 133000Bitcoin prepares to attack the ceiling of the 133,000 range channel after some suffering
Bitcoin tp1:126000
Tp2:128000
Tp3:133000
Bitcoin's next target is $133,000Bitcoin prepares to attack the ceiling of the 133,000 range channel after some suffering
Bitcoin tp1:126000
Tp2:128000
Tp3:133000
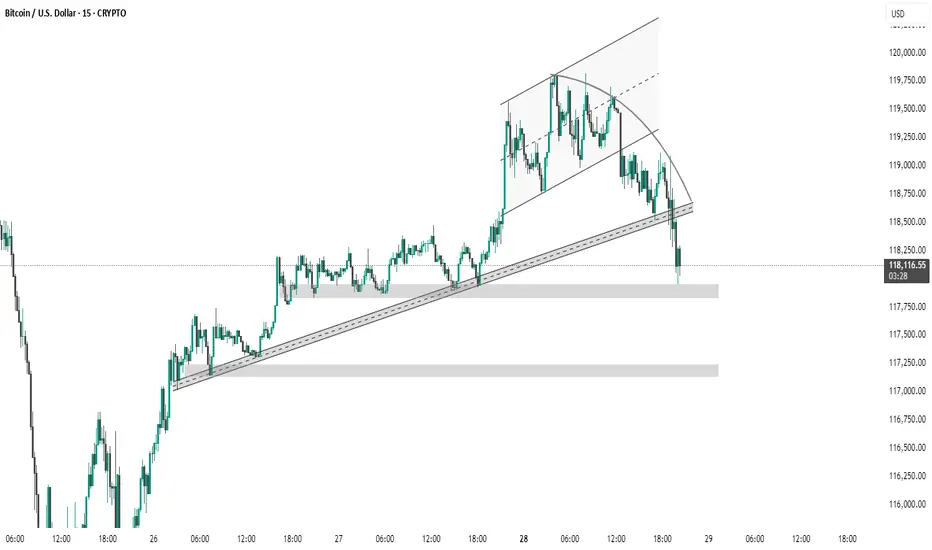
BTC #15-minute BTC/USD chart This 15-minute BTC/USD chart shows a clear breakdown from a rising channel, followed by a retest and rejection at the former support trendline. The price has now broken below key trendline support and is testing a demand zone near 118,000 USD. If this level fails to hold, the next support lies around the 117,250–117,000 USD zone. This indicates a potential shift in market structure from bullish to bearish in the short term.
BtcUsd targetting 40 to 50 pips next level will be 119000📊 Market Analysis:
Bitcoin (BTCUSD) is currently showing a minor bullish momentum, and based on the current price structure, we are expecting a 40–50 pip move to the upside, targeting the $119,000 level as the next key resistance.
📈 Technical Highlights:
Price is pushing upward with steady momentum.
Forming higher lows, signaling buyer control.
RSI staying above the midline – bullish strength confirmed.
Price aiming to break minor resistance to head toward $119,000 zone.
🎯 Next Target:
Immediate Move: +40 to +50 pips.
Major Resistance Level: $119,000 – watch for potential breakout or reversal there.
📉 Risk Management:
Invalidation below recent low or support zone.
Set tight stop-loss for intraday trades.
🕒 Timeframe: Short-term intraday move – Scalping or quick swing.
#BTC #Bitcoin #Crypto #BTCUSD #Scalping #ShortTermTrade #TradingView
Btcusd Going down 40 to 50 pips BTCUSD Going down cuple of hours and you can take profit 40 to 50 pips

btc on selling#BTCUSD on multiple price rejection at 119k,now we await final touch before a fall below 116487-110k.
Sell at 119436, target 116487-110k, stop loss 120372.
Bullish range isn't strong

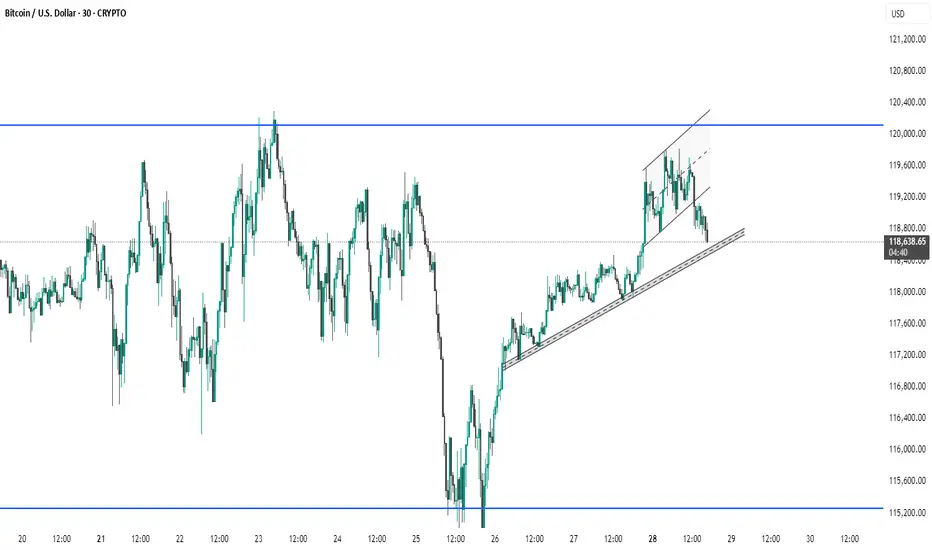
BTC #Bitcoin (BTC/USD) on a 30-minute timeframe. The chart shows Bitcoin (BTC/USD) on a 30-minute timeframe. Price recently broke down from a rising channel and is currently testing a key ascending trendline for support around $118,600. A break below this trendline could signal further downside, while a bounce may lead to another test of the $120,000 resistance level. Traders should watch closely for a confirmed move below or a reversal signal at this support zone.
Bitcoin Cycles Signal Major Move — BIT500 on What Comes NextBitcoin’s historical price action is known for its cyclical behavior — driven not only by supply dynamics like halving events, but also by global macroeconomic forces. This week, leading crypto macro analyst TechDev released a widely discussed model projecting that Bitcoin may be entering a new explosive phase, closely linked to a shift in monetary policy, global liquidity cycles, and risk asset rotation.
At BIT500, we see this as more than a theory — it’s a playbook. Understanding macro-driven crypto cycles gives institutional and high-net-worth investors a clear advantage. And, when used properly, it can become the foundation for consistent alpha generation in the digital asset space.
TechDev’s Model: Liquidity as the True Driver
According to TechDev, Bitcoin’s major uptrends are synchronized with global liquidity expansions. In particular, the model links Bitcoin price surges with:
Falling real interest rates,
Expanding global M2 money supply,
Weakening U.S. dollar (DXY decline).
This pattern played out in 2016–2017 and again in 2020–2021. As global central banks prepare to shift toward more accommodative policies — especially amid slowing GDP growth and rising debt burdens — similar conditions may be taking shape for late 2025 and into 2026.
BIT500 analysts agree: the macro landscape is increasingly favorable for risk-on positioning, especially in hard assets like Bitcoin.
On-Chain Indicators Confirm the Thesis
Supporting the macro thesis is a growing set of on-chain signals. Our internal models — as well as public indicators like Dormancy Flow, MVRV ratio, and Realized Cap metrics — show long-term holders are accumulating, while short-term holder activity has flattened.
The decline in exchange reserves, increased self-custody trends, and decreased miner selling pressure all align with prior pre-bull market phases. This combination of tightening supply and macro liquidity can act as fuel for the next leg up — one that could catch passive investors off-guard.
How BIT500 Capitalizes on Bitcoin Cycles
At BIT500, we convert insights into execution. Our team applies cycle-based, quantitative strategies to capture asymmetric upside while managing downside risk.
Here’s how we turn macro analysis into market performance:
Phased Capital Deployment
We deploy capital in staggered allocations, entering during compression phases and scaling in as trend confirmation emerges — minimizing exposure during volatility and maximizing return during expansions.
Volatility Harvesting
We implement delta-neutral and volatility-arbitrage strategies across Bitcoin derivatives markets, generating income in all phases of the cycle — especially when price is range-bound.
Multi-Asset Rotation Models
Based on cyclical rotation, we dynamically adjust exposure between Bitcoin, Ethereum, and select altcoins. These models are tested to outperform static portfolios across halving-based and macro cycles.
Custom Risk Monitoring Systems
BIT500 clients benefit from our proprietary Cycle Risk Dashboard, which sends alerts when market structure shifts — enabling proactive rebalancing rather than reactive trading.
Conclusion
Bitcoin’s next major price movement is likely to be shaped not just by crypto-native factors, but by broader shifts in global liquidity, interest rates, and investor sentiment. TechDev’s research confirms what BIT500 has long modeled — that understanding economic cycles is key to anticipating large-scale Bitcoin breakouts.
For investors seeking not just exposure but performance, the coming months represent a rare window of opportunity. At BIT500, we don’t just track cycles — we build strategies to monetize them with discipline and precision.
Bitcoin ConsolidatesBitcoin continues to chop sideways, consolidating below the all time high. Demand is high, RSI is dropping as price goes sideways. This will break out again eventually and all eyes will be back on the honey badger.
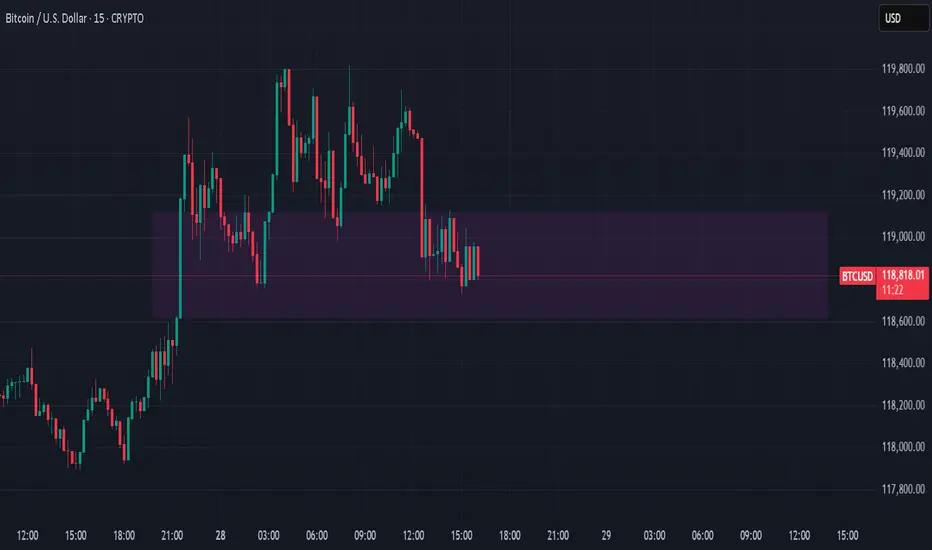
Watch this FVG for retracement zone for price action trenWatch this FVG for retracement zone for price action trend
Bitcoin, Politics, and Security: This Week in CryptoThis week brought a series of headline-making moves in the crypto space, reflecting the growing maturity and complexity of the digital asset landscape. From massive Bitcoin buys to cybersecurity initiatives and political implications, here's what stood out — and why it matters.
Strategy Buys $740M in Bitcoin
Institutional players continue to accumulate Bitcoin — but the scale and structure of Strategy’s recent purchase caught the attention of analysts. According to filings with the SEC, the firm added 11,000 BTC, bringing total holdings to 186,000 BTC — worth over $11 billion.
What’s notable is that Strategy appears to be financing these purchases using bond issuance, effectively applying low-interest leverage to increase crypto exposure. This marks a shift in how corporations are approaching Bitcoin — as both a reserve asset and a financial instrument.
Trump Media Discloses $2B in Digital Assets
In a surprising disclosure, Trump Media & Technology Group, the parent of Truth Social, revealed it holds $2 billion in digital assets — including USDC, Ethereum, and small allocations to Solana and Chainlink.
The move has sparked debate within both financial and political circles, given Donald Trump’s renewed activity as a U.S. presidential candidate. Such a significant crypto treasury tied to a politically active entity raises concerns about market influence and regulatory scrutiny.
CoinDCX Launches $1M Bug Bounty Program
Indian crypto exchange CoinDCX announced a $1 million bug bounty program, inviting white-hat hackers and security researchers worldwide to find vulnerabilities in its platform. This marks a shift toward proactive cybersecurity in the crypto exchange industry.
The company also plans to launch an open-source vulnerability-sharing platform to facilitate threat intelligence across exchanges — a move that could standardize Web3 security practices.
Bottom Line
This week underscored the increasingly strategic posture of major crypto market players. From treasury management and structured crypto financing to cybersecurity and institutional-grade governance, the digital asset sector is evolving rapidly.
For savvy investors and ecosystem participants, this complexity brings more opportunity than ever before — but also demands sharper focus, real-time analytics, and risk-aware strategies.
If you need these articles tailored for a newsletter, blog, or investor deck — just let me know!

Bitcoin Stalls Ahead of Fed and ETF DataAt the time of writing, Bitcoin is trading in a narrow band between $66,000 and $67,800 — showing price stability but lacking directional momentum. This consolidation phase comes ahead of several major catalysts: the upcoming Federal Reserve interest rate decision, quarterly earnings from top tech firms, and updates on inflows and outflows from U.S.-based spot Bitcoin ETFs.
Macroeconomic Pressure: All Eyes on the Fed
The U.S. Federal Reserve will meet on July 31 to discuss interest rates. While most analysts expect the central bank to hold rates steady, markets are focused on the Fed’s tone. Any suggestion of easing or a future rate cut — possibly in Q4 — could trigger renewed appetite for risk assets, including crypto.
Tech Earnings: Nasdaq Sentiment Spillover
Major tech firms including Apple, Amazon, and Google are scheduled to report earnings this week. These reports are closely tied to broader market sentiment, especially for the NASDAQ and S&P 500 — both of which show increasing correlation with crypto. Positive earnings could strengthen risk-on sentiment and give Bitcoin a short-term boost.
ETF Flows: A Silent Market Driver
Since the beginning of the year, spot Bitcoin ETFs have shown mixed behavior — strong inflows in Q1, followed by periods of cooling and outflows. Investors are now awaiting updated flow data from major asset managers like BlackRock and Fidelity to assess whether institutional interest in Bitcoin remains intact.
A return to consistent inflows could serve as a catalyst to push BTC out of its current range. Conversely, continued stagnation or net outflows may trigger a breakdown below $65,000 — a key support level.
Technical View: Calm Before the Storm
According to BBDelta, $66,500 is acting as a short-term equilibrium point between buyers and sellers. Open interest in Bitcoin futures remains elevated, indicating that traders are bracing for significant movement once market catalysts emerge.
Conclusion
Bitcoin is currently in a state of “wait and see,” and the next several days could be pivotal. The convergence of macroeconomic updates, tech-sector earnings, and ETF flow reports is likely to set the tone for crypto markets through August.
For professional investors and active traders, now is the time to prepare. BBDelta advises clients to structure scenario-based strategies, focusing on key levels and volatility hedging. Sideways markets offer opportunities for precision entries, capital protection, and disciplined positioning — all critical before the next major impulse move.

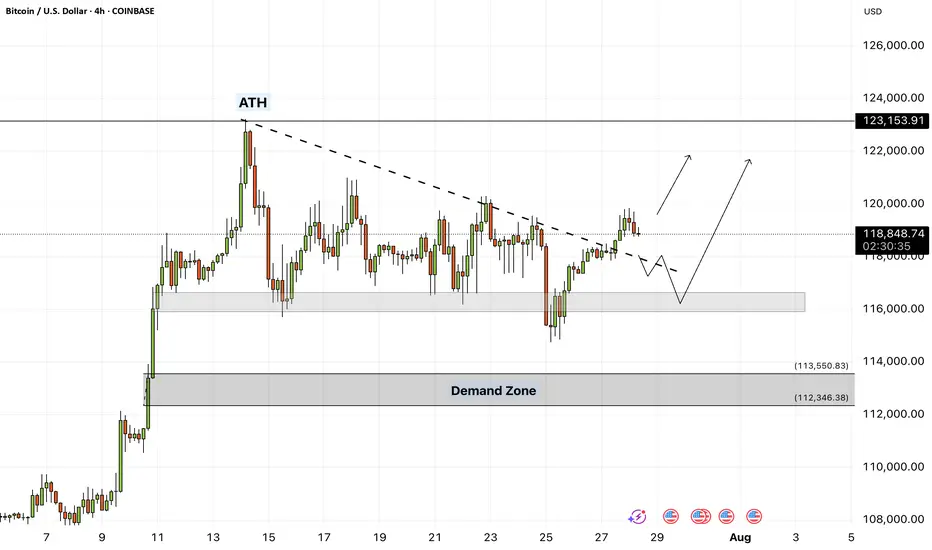
Bitcoin - Will Bitcoin continue its upward trend?!Bitcoin is above the EMA50 and EMA200 on the four-hour timeframe and is in its medium-term ascending channel. Bitcoin’s current upward momentum has the potential to reach its previous ATH. If it corrects, you can look for Bitcoin buying opportunities from the identified support area, which is also at the intersection of the bottom of the ascending channel.
If this support is lost, the decline will continue to around $113,000, where you can again buy Bitcoin with a better risk-reward ratio.
It should be noted that there is a possibility of heavy fluctuations and shadows due to the movement of whales in the market, and capital management will be more important in the cryptocurrency market. If the downward trend continues, we can buy within the demand range.
Last week, a group of U.S. senators released an initial draft of a new legislative proposal aimed at creating a clearer regulatory framework for the digital asset industry in the United States. The proposal builds on the recently passed CLARITY Act in the House of Representatives and focuses on strengthening market structure, enhancing consumer protection, and expanding regulatory oversight.
According to the senators, the bill addresses key areas such as banking, disclosure requirements, securities classification, and measures to combat illicit financial activity.Senator Lummis, in highlighting the proposal, stressed the urgent need for legal clarity to support the growth of this emerging industry within the U.S. The legislation aims to facilitate the integration of digital assets into banking services and would allow financial holding companies to provide services based on such assets.
The draft also includes measures aimed at preventing illegal financial activities, such as improving regulatory standards and boosting inter-agency cooperation to identify and block misuse of digital assets.
In addition, the senators have issued a “Request for Information” (RFI) to support the legislative process and have invited the public to share their opinions on more than 35 related topics, encouraging broader engagement in shaping the bill.
Meanwhile, in Asia, Japan-based firm Metaplanet announced that it has added 780 BTC worth $93 million to its digital holdings. This acquisition brings the company’s total Bitcoin reserves to 17,132 BTC, valued at roughly $2 billion. Metaplanet is fast becoming one of the largest institutional Bitcoin treasuries in the region—potentially serving as a model for other firms across Asia.
At the same time, publicly traded U.S. companies have significantly ramped up their Bitcoin holdings. By the end of Q2 2025, these companies had accumulated nearly 900,000 BTC, marking a 35% increase over the previous quarter. This surge, driven primarily by firms such as MicroStrategy, has sent demand for Bitcoin soaring.
Some analysts believe that the $1.5 trillion in free cash flow held by companies within the S&P 500 index could spark a new wave of institutional Bitcoin buying.
Looking ahead, the upcoming week is packed with critical U.S. economic data. Alongside the Non-Farm Payroll (NFP) employment report and inflation metrics via the Personal Consumption Expenditures (PCE) index, the initial estimate for Gross Domestic Product (GDP) and various other indicators will be released—potentially offering a clearer picture of where the U.S. economy is heading.
The Federal Reserve remains primarily focused on inflation and labor market dynamics. June CPI data indicated signs of inflationary pressure caused by tariffs. If Thursday’s PCE report—particularly its core reading—confirms a similar trend, the Fed may decide against a rate cut in September. As a result, financial markets have priced in only about a 65% chance of a rate cut at that meeting.
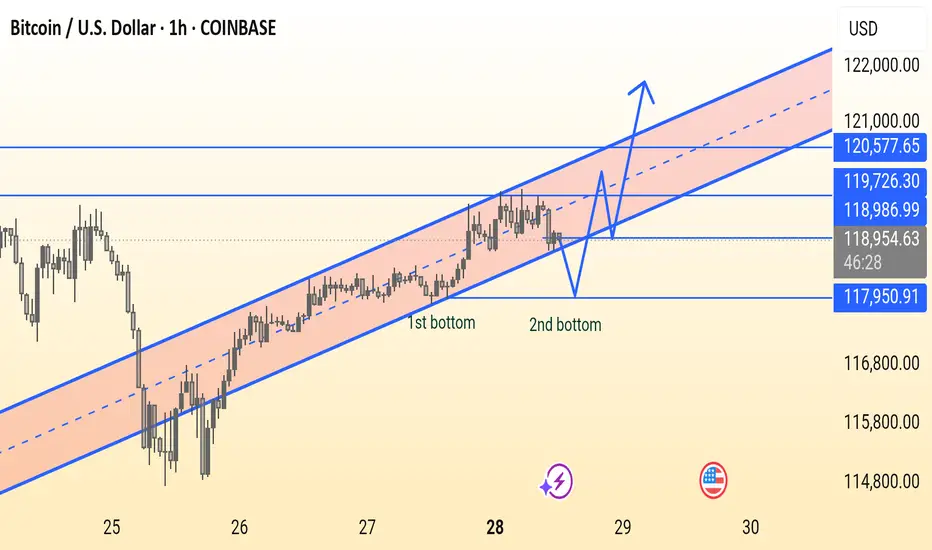
BTC/USD Double Bottom Forming in Uptrend ChannelThis BTC/USD 1-hour chart shows Bitcoin trading in an ascending channel, forming a potential double bottom near support around $118,950. A breakout above $118,986 could lead to a bullish move toward $120,577. Key support lies at $117,950 — holding this level is crucial for bullish continuation.
Metaplanet Doubles Down on Bitcoin Despite Weak SharesJapanese investment firm Metaplanet continues to draw attention with its pro-Bitcoin stance, announcing a fresh acquisition of BTC worth $93 million. The move comes despite ongoing pressure on the company's stock, underscoring its long-term commitment to digital assets.
Publicly listed on the Tokyo Stock Exchange, Metaplanet began accumulating Bitcoin in early 2024, taking inspiration from U.S.-based MicroStrategy. Since then, the company has steadily increased its holdings, viewing the cryptocurrency as a hedge against inflation and currency devaluation — particularly in light of the weakening yen.
With this latest purchase, Metaplanet’s total Bitcoin holdings now exceed 5,000 BTC, making it one of Asia’s largest corporate holders of the asset. Company executives emphasize that their approach is not driven by short-term speculation, but rather by a strategic vision to transform the balance sheet and align with the future of finance.
Still, the stock market has not fully embraced the strategy. Since the company’s initial crypto investments, Metaplanet shares have experienced significant volatility and an overall downward trend. Some investors remain wary of overexposure to a single volatile asset, fearing it could deter traditional capital and increase overall risk.
Speaking to local media, CEO Tetsuya Nagata reiterated that the firm’s Bitcoin commitment is deliberate and resilient. “We’re not chasing short-term price movements,” he said. “We see corrections as opportunities to strengthen our position and prepare for long-term transformation.”
Analysts are divided. Some view Metaplanet’s approach as a sign of growing institutional appetite for crypto in Asia, while others call for a more diversified portfolio to mitigate risk. There is growing speculation that Metaplanet’s bold move could set a precedent for other Japanese and regional companies seeking similar exposure.
Against the backdrop of global economic uncertainty and financial digitization, Bitcoin is evolving from a speculative asset into a core component of strategic asset allocation. Metaplanet is a clear example of this shift — one that is navigating short-term market challenges in pursuit of a long-term digital vision.
Time will tell whether the strategy pays off. But for now, Metaplanet is carving out a bold new role in Japan’s corporate landscape, as a pioneer of institutional Bitcoin adoption in Asia.

Solana (SOL) Revs Up Again — Fresh Breakout Above $200 in Sight?After months of consolidation, Solana (SOL) is once again showing signs of bullish momentum, trading near $176 and rapidly approaching a potential breakout level of $200. Investors and analysts alike are paying close attention, as on-chain activity and ecosystem development provide a compelling case for a renewed upward trajectory.
With growing demand for high-throughput blockchain infrastructure and new institutional integrations, Solana is positioning itself as more than just an Ethereum alternative—it’s emerging as a core infrastructure layer for high-performance Web3 applications.
Institutional Momentum Gathers Pace
In the last three weeks, several high-profile announcements have bolstered confidence in the Solana ecosystem. Fidelity Digital Assets revealed it is piloting tokenized bond products on Solana’s network, citing its fast settlement time and composability.
Meanwhile, Visa expanded its USDC settlement pilot on Solana across five countries, reinforcing the blockchain’s real-world financial use cases.
“Solana is no longer just retail-driven,” said Karla Nunez, digital asset strategist at ApexBridge. “Institutions are beginning to build directly on it—and that changes the dynamic.”
Ecosystem Growth and Developer Activity
The number of active developers on Solana has surged 38% quarter-over-quarter, according to Electric Capital’s Developer Report. Projects in DeFi, gaming, and NFTs continue to attract users, helped by extremely low transaction costs and sub-second finality.
Notably, the Solana Foundation recently launched a $100 million grant fund for AI-integrated crypto applications, which could catalyze the next wave of user adoption.
Technical Indicators Support Breakout Narrative
SOL has outperformed major altcoins this month, rising 21% in July. The token is now trading above its 50-day and 100-day moving averages, and momentum indicators suggest a potential breakout above the key psychological barrier at $200.
A confirmed break would likely open the door to $240–$260, with minimal historical resistance in that zone.
Macro Factors Provide Tailwind
The broader crypto market is recovering as inflation metrics cool and expectations for central bank easing rise. Solana, with its high beta to market movements, often leads altcoin rallies during bullish pivots.
Furthermore, the recent dip in Ethereum gas prices has had limited impact on Solana’s user base, suggesting its appeal is increasingly based on performance, not cost arbitrage.
Conclusion
While risks remain—from network outages to broader market volatility—Solana’s resurgence appears fundamentally supported. With institutional interest rising, technical signals aligning, and ecosystem momentum building, a clean break above $200 could mark the beginning of a new cycle for SOL.
For investors seeking exposure to high-speed smart contract platforms with real-world traction, Solana may be nearing another defining moment.

“Biggest Trade Deal Ever” — 5 Things to Know in Bitcoin This WeeAs Bitcoin enters the final trading week of July 2025, global markets are responding to what many are calling the “biggest trade deal ever”—a multilateral digital finance agreement between the United States, the European Union, and five Asia-Pacific countries. While the implications are far-reaching for global payments, the spotlight remains squarely on Bitcoin, which has now firmly reclaimed the $120,000 level.
Here are five key developments shaping Bitcoin’s trajectory this week:
1. Digital Trade Pact Signals Institutional Legitimacy
The newly signed agreement includes provisions for cross-border tokenized settlement, streamlined regulations for digital asset custodians, and recognition of Bitcoin as a “monetizable asset class” in interbank systems. While CBDCs and stablecoins will be used in formal settlements, the framework opens the door for Bitcoin to function as reserve collateral.
“This is the first time sovereign regulators have embedded Bitcoin into a multilateral economic framework,” said Janice Harlow, senior strategist at Beacon Global.
2. ETF Inflows Return After Brief Slowdown
After a two-week lull, Bitcoin spot ETFs have seen renewed demand, with $850 million in net inflows over the past five trading sessions. The iShares Bitcoin Trust (IBIT) and Fidelity’s FBTC led inflows, signaling re-accumulation by institutional buyers.
Derivatives data from CME suggests traders are positioning for upside, with call options volume outpacing puts at a 2.3:1 ratio.
3. Hash Rate Hits All-Time High
Bitcoin’s hash rate has climbed to a new record high, exceeding 640 EH/s, indicating miner confidence and long-term investment in infrastructure. This surge comes despite the recent halving, which slashed block rewards and pressured weaker miners.
The increasing energy commitment suggests miners are betting on future price appreciation and institutional demand stability.
4. Whale Activity Accelerates
On-chain analytics from Glassnode show a sharp uptick in accumulation by wallets holding over 10,000 BTC. Approximately $2.1 billion in BTC has been withdrawn from exchanges in the past week, pointing to strong conviction among whales and high-net-worth investors.
“This looks less like speculation and more like positioning ahead of structural shifts,” noted Rishi Kulkarni, managing partner at TitanBay Capital.
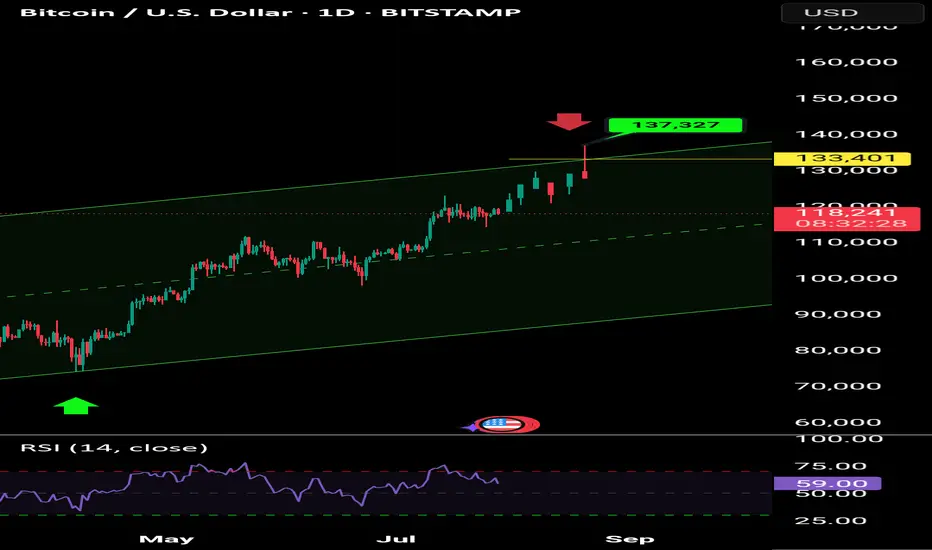
5. Technical Indicators Flash Bullish
Bitcoin has reclaimed its 50-day and 200-day moving averages, and RSI (Relative Strength Index) remains in neutral territory at 56—suggesting room for further upside without overheating.
With the $128,000 resistance level in sight, many analysts believe a breakout to $140,000 is plausible in August, barring macroeconomic shocks.
Final Thoughts
With regulatory breakthroughs, strong on-chain data, institutional accumulation, and miner alignment, this week’s developments may mark a turning point in Bitcoin’s evolution from speculative asset to globally integrated infrastructure.
Whether the “biggest trade deal ever” delivers on its promise remains to be seen—but for Bitcoin, the direction appears clear: up and institutional.
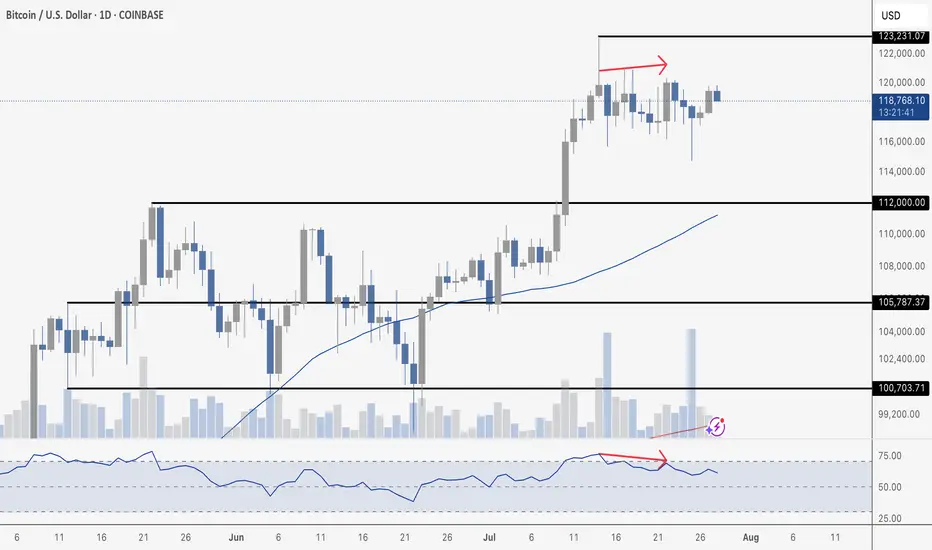
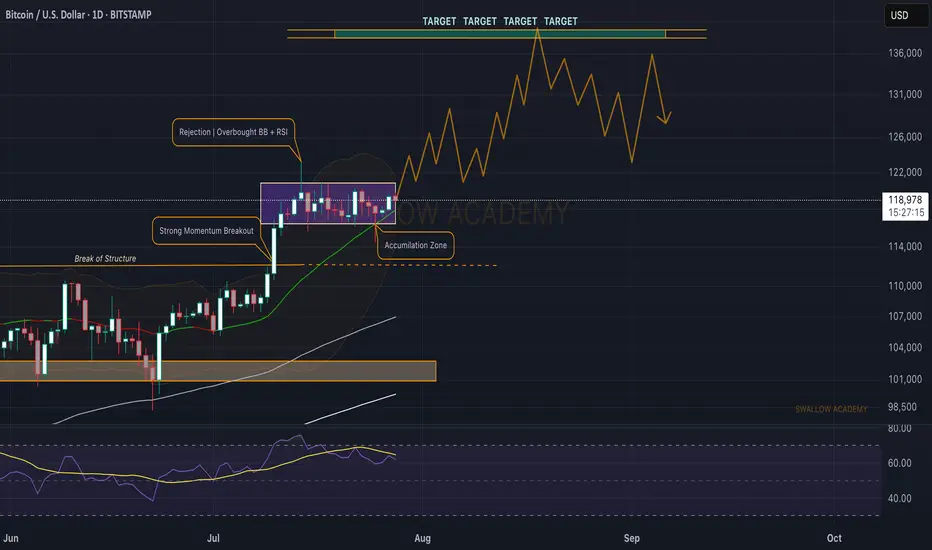
Bitcoin (BTC): Still In Accumulation Zone | Volatility IncomingWe are still in the accumulation zone on the daily timeframe withBitcoin. What we are looking for here is a breakout from that accumulation zone, which, upon seeing a bullish breakout, we are going to long and that's what we are leaning towards.
Swallow Academy
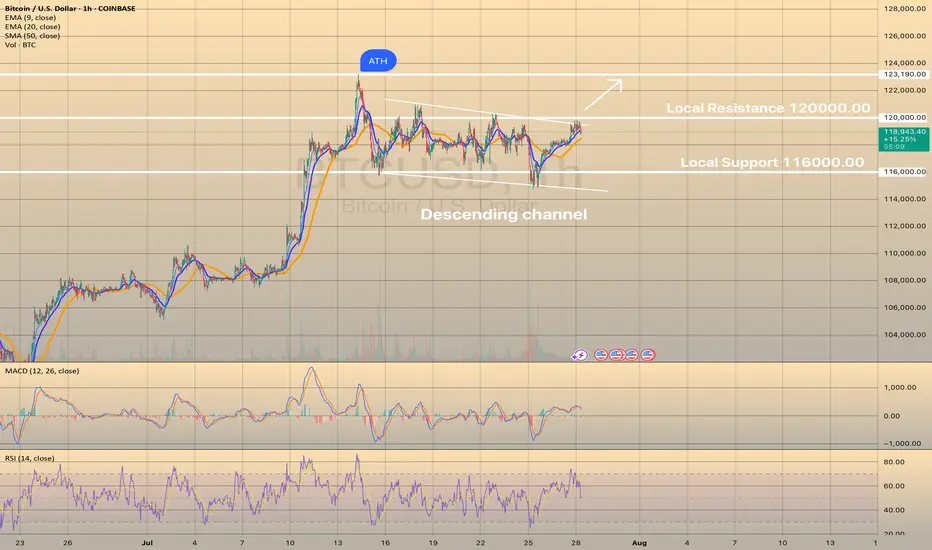
BTCUSD IS READY TO BREAK THE DESCENDING CHANNELBTCUSD IS READY TO BREAK THE DESCENDING CHANNEL
In our latest report we wrote down that the asset may rebound from lower border of the descending channel and head toward local resistance level of 120,000.00. The forecast has successfully worked out, so what's next?
Currently the price consolidates slightly below the upper border of the descending channel and local resistance level of 120,000.00. Although, the RSI and MACD confirm bullish impulse and, in general, the asset is in mid-term bullish trend, still would be safer for long trade to wait for a breakout of the resistance with first target of 123,190.30 (ATH).