Bitcoin vs Global M2: Can Liquidity Predict the future?This chart compares Bitcoin’s price (daily) with a Global M2 indicator that includes the monetary supply of major economies like the U.S., Eurozone, China, and Japan.
It’s not a perfect global measure — but it gives us a reliable macro signal of what global liquidity is doing.
And when it comes to Bitcoin, liquidity is everything.
Why this matters:
Bitcoin is often seen as volatile or unpredictable. But when we zoom out and overlay it with liquidity flows (like M2), a powerful pattern emerges:
Bitcoin tends to follow global M2 with a ~10-week lag.
When M2 rises, Bitcoin often rallies weeks later. When M2 contracts, Bitcoin loses momentum.
This makes M2 a powerful leading indicator — not for predicting exact price levels, but for catching the direction of trend and regime shifts.
What this chart tells us:
M2 leads, Bitcoin follows.
The curves won’t align perfectly — but the macro structure is there.
Big expansions in M2 create a friendlier environment for risk assets like BTC.
This is the same logic used by macro strategists like Raoul Pal: liquidity drives everything.
Important disclaimer:
This doesn’t mean M2 tells you where price will be on a specific date. But it can help identify turning points — and confirm whether we’re in a reflationary vs contractionary environment.
Think of it as a weather forecast, not a GPS pin.
In other words:
This chart doesn't show the price. It shows the future.
BTCUSD trade ideas

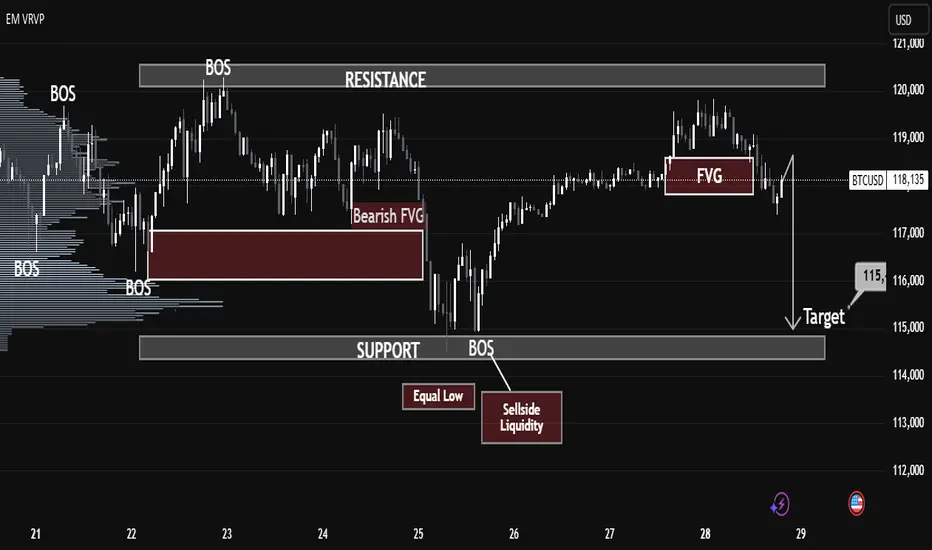
BTCUSD Market Breakdown – Liquidity Sweep Incoming?BTCUSD Market Breakdown – Liquidity Sweep Incoming?
🔍 Technical Analysis (July 29, 2025)
Chart Observations:
1. BOS (Break of Structure):
Multiple BOS events are identified, confirming key directional shifts in market structure. The last BOS near the support zone signals bearish intent.
2. Bearish Fair Value Gap (FVG):
A clean bearish FVG is left behind after a sharp drop on the 25th, indicating institutional imbalance and potential retracement area. Price rejected from that FVG later.
3. Equal Low & Sellside Liquidity:
The highlighted equal lows around July 25-26 mark areas of resting liquidity—prime targets for smart money manipulation.
4. New FVG Formed (July 28):
Another bearish FVG appears just before the projected breakdown, strengthening the case for a bearish continuation.
5. Support Zone Target – $115K:
A clean support zone (marked between 114,500–115,500) sits directly below the current market price. This is the likely liquidity target after sweeping equal lows.
6. Volume Profile (VRVP):
Low-volume nodes between the current price and support suggest minimal resistance to a sharp downward move.
⸻
🎯 Conclusion:
The structure, FVGs, and liquidity pools all point toward a liquidity raid below the equal lows, aiming for the support target near $115K. Traders should watch for a decisive break below the current range, especially if the FVG acts as resistance again.
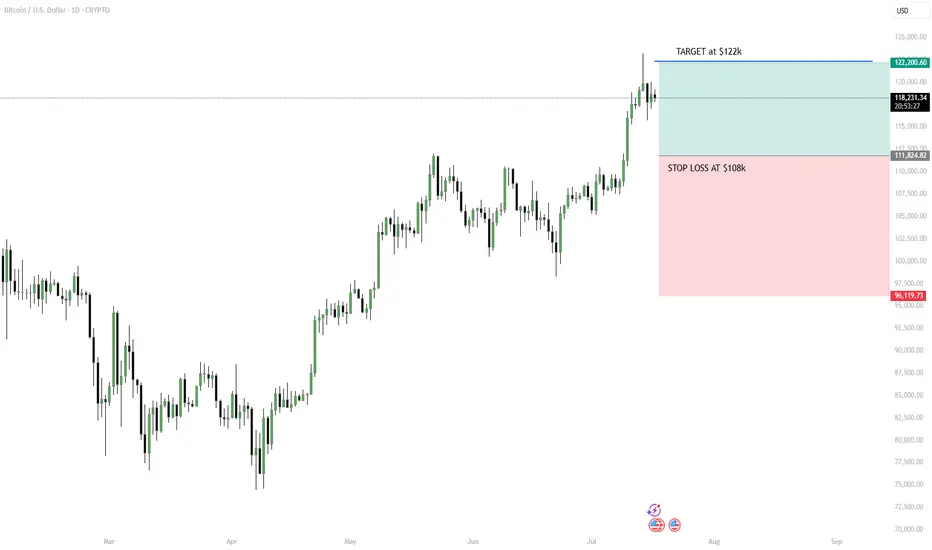
Strategy: “Breakout Bounce” – Buy the Retest, Ride the WaveHello Traders! BTC has broken out above $118K–$120K after a strong uptrend. Now it’s pausing, and a short-term pullback looks likely. Instead of buying the top, we wait for the price to retest previous resistance (around $112K–$114K), which could turn into support.
MY PLAN:
Wait for pullback to $112K–$114K zone.
Look for a bullish candle (daily or 4H) to confirm entry.
Target: $122K short-term or trail stop if trend continues.
Stop loss: Below $108K to manage risk.
Tip: Don’t chase. Be patient, follow the setup, and use proper risk management.
Please leave a comment and don't forget to support a fellow trader! Also, you can leave in the comments your target and plan ideas!
Have a great day y'all!
-Neo
Bitcoin longBitcoin retracement at 113.000 - 114.000 range, testing the support, 1H timeframe.
Liquidating positions on the level. Then long after testing the support.

Do you think I'm joking ???As I said, Bitcoin broke the triangle, and now with a slight price correction(109k), it could surge to $150k , and you still think I'm joking!!
Previous analysis
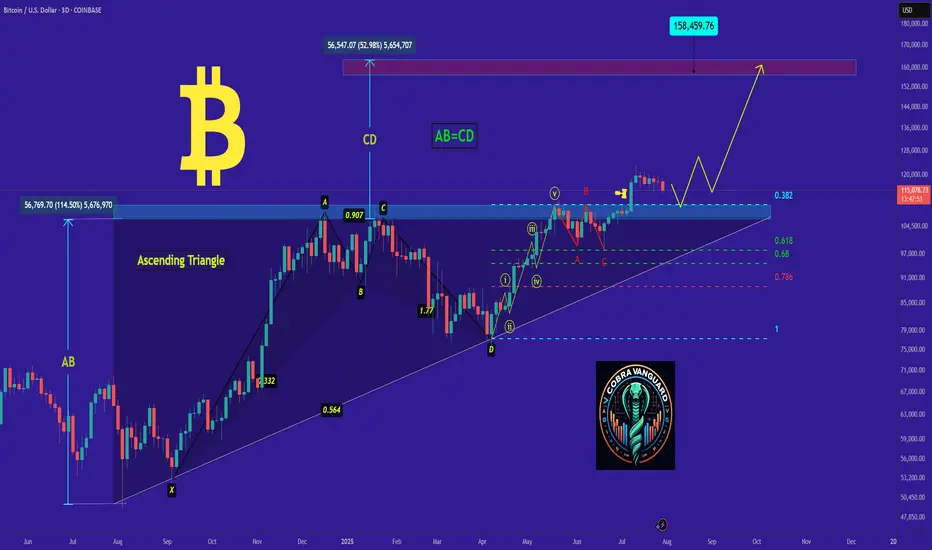
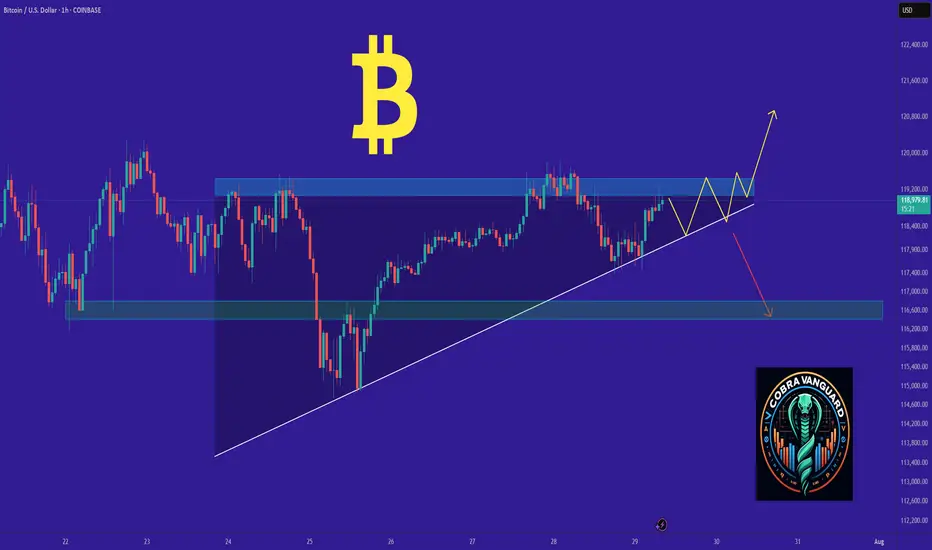
BITCOIN's Situation (1h) !!!The price is within an ascending triangle, which could be encouraging. However, since crypto doesn't always follow patterns, it might break down from below and correct to around $116K!
Best regards CobraVanguard.💚
BTC/USD – 4H Short Setup AnalysisBitcoin is currently trading within a defined range under macro resistance. The chart shows price stalling below a key supply zone, with rejection from the upper Keltner Channel and diagonal resistance (yellow trendline). A local bearish divergence appears to be playing out as momentum fades.
📉 Short Position Setup:
Entry: $119,275 (supply retest)
Stop Loss: Above local high / top channel boundary
Targets:
TP1: $117,163 (38.2% Fib)
TP2: $115,858 (61.8% Fib)
TP3: $113,746 (full measured move)
Confluence:
Bearish rejection near multi-touch trendline resistance
Lower high formation after extended consolidation
Heikin Ashi candles showing loss of bullish momentum
Watch for: Breakdown of the white trendline support to confirm momentum shift. Invalidation if BTC closes strongly above $120,000.
Timeframe: 4H | Strategy: Range Reversal + Fib Confluence

BTCUSD--SHORT--26_07_25--breaking orange trendline
--pullback and retest trendline between levels 119597,117411
--move down towards descending channel through 111658

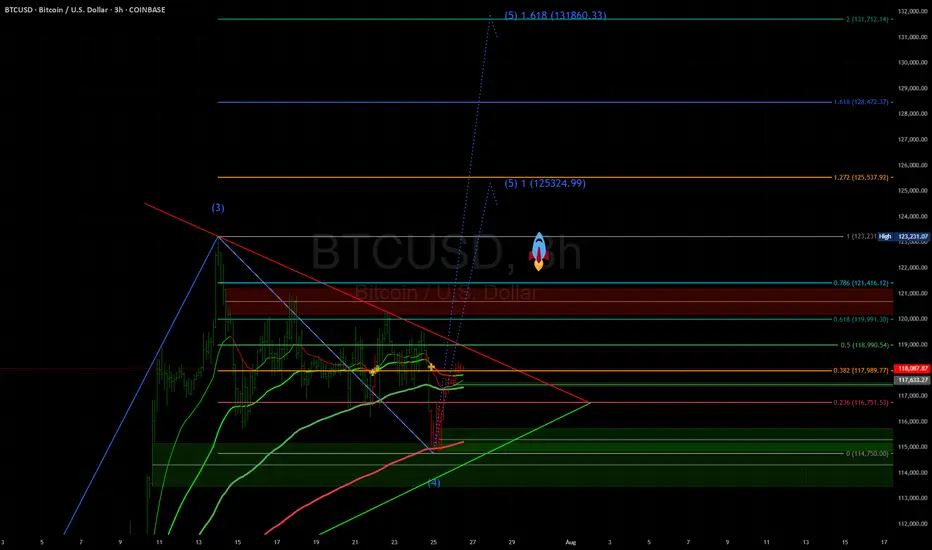
BTC 125k - $130KHello Traders,
Using Fibs and Elliot Waves I show possible BTC targets coming soon in the next leg up. Lets see how this plays out.
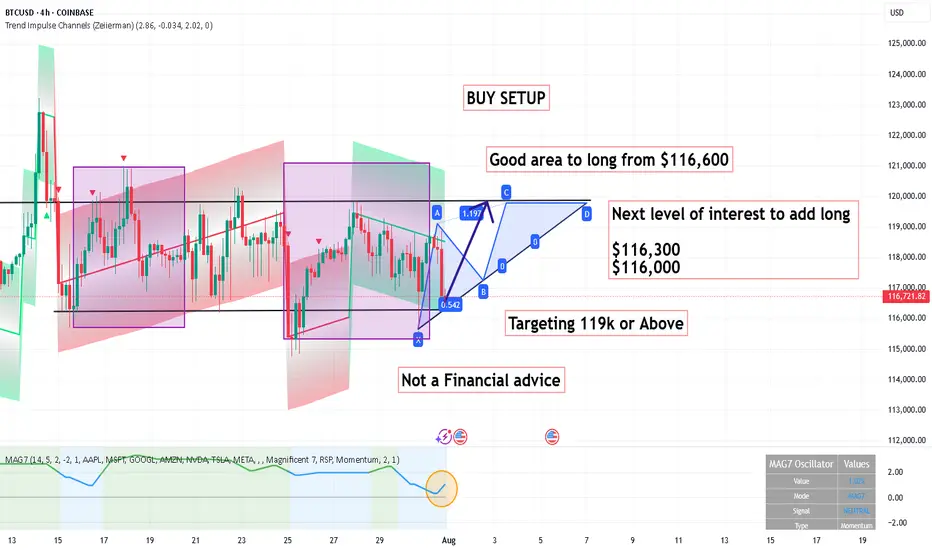
BUY SETUP ,Good area to long from $116,600BUY SETUP
Good area to long from $116,600
Next level of interest to add long
$116,300
$116,000
Targeting 119k or Above
Its not a Financial advice
Bearish Outlook for BTCUSDOn the 4-hour timeframe, Bitcoin seems to be starting a corrective phase, likely moving toward the $110 mark. Current price action is facing resistance at a descending trendline, aligned with the 78.6% Fibonacci retracement level, which should limit any short-term upward moves. The price is also trading below the 50-period SMA, with a strong bearish candle from a few sessions back supporting the downward trend.
For a bullish outlook to take hold, Bitcoin would need to decisively break above the 78.6% Fibonacci level with a robust bullish candle closing above the 50 SMA. Until that happens, I remain bearish, with a target of $110.
This technical perspective aligns with the scenario where the Federal Reserve opts to maintain interest rates at 4.50% at this Wednesday's FOMC meeting
Stay cautious and trade wisely!

Realized Price / 200 SMAThe realized price has crossed above the 200 SMA. The last time that this happened was November 2020. BTC then went on a tear in the following 90 days gaining 212%. Even if BTC gains only 50% of that 212% this time we will see the BTC price hit 250k.
We aren't bullish enough.

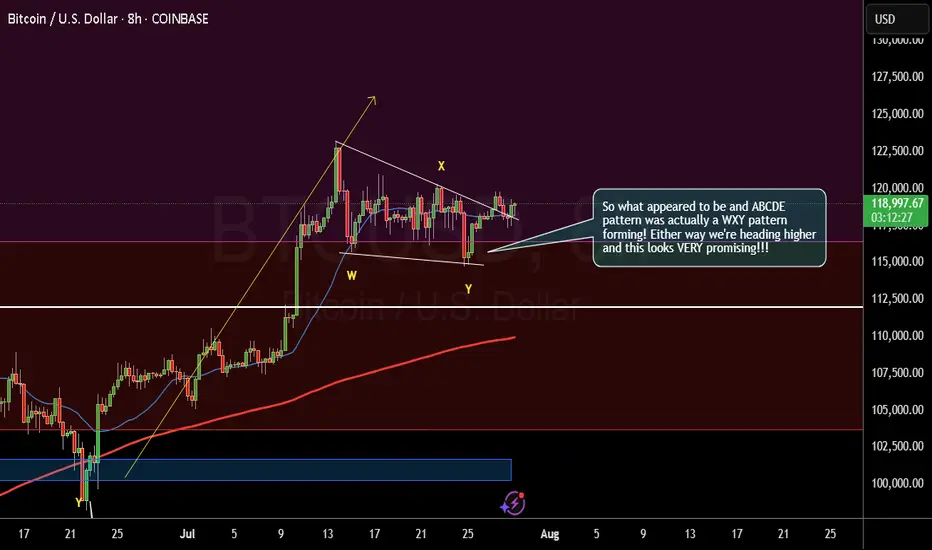
Different Pattern, Same result - Exploding higher!So what appeared to be and ABCDE
pattern a few days ago was actually a WXY pattern
forming! Either way we're heading higher
and this looks VERY promising!!!
Bitcoin’s Bull Run: Is There Still Fuel in the Tank?Bitcoin has had an impressive year, breaking out of a downward channel and launching into a strong upward rally as we saw in the previous idea .
But now, price action is slowing, and many are asking: Is the bull run over or just taking a breather?
Let’s look at what the chart tells us.
📈 A Classic Bull Flag in the Making
After the breakout, BTC seems to be forming another channel or what traders often call a bull flag . This is typically a bullish continuation pattern , meaning that after a short consolidation, price may break upward again.
But that’s the technical side. What about the big picture?
🔁 Bitcoin Cycles: History Rhymes
In the chart below the price, we see a comparison of Bitcoin’s last two cycles (shown in red and orange). Interestingly, both of those cycles point to end between September and November this year.
If history repeats, or at least rhymes, the current cycle could follow the same timeline. That gives us a few more months of potential upside before this bull run starts cooling off.
Note that the first cycle peaked faster, but also had a mini bull momentum in the same zone where the next cycles peaked.
⚠️ Still Bullish, But Watch Your Step
Even though we’re near all-time highs and price is showing signs of slowing, there may still be room for growth. However, the risk is increasing, so this is a time to stay bullish but with extra caution.
A key level to watch is marked in red on the chart. Falling below it could mean the bull momentum is fading. The reason is quite simple, a bull rally can't trade inside prices of previous consolidation phases because that means lateral or bear momentum.
🧠 Final Thoughts
Bitcoin has a history of repeating patterns, and right now, we seem to be tracking closely to previous cycles. With a potential breakout forming and a few months left on the clock, there could still be opportunities ahead.
But don’t forget: every cycle ends. Stay alert, manage risk, and don’t chase green candles blindly.
💬 Does this setup align with your view on BITSTAMP:BTCUSD ?
🚀 Hit the rocket if this helped you spot the opportunity and follow for more clean, educational trade ideas!

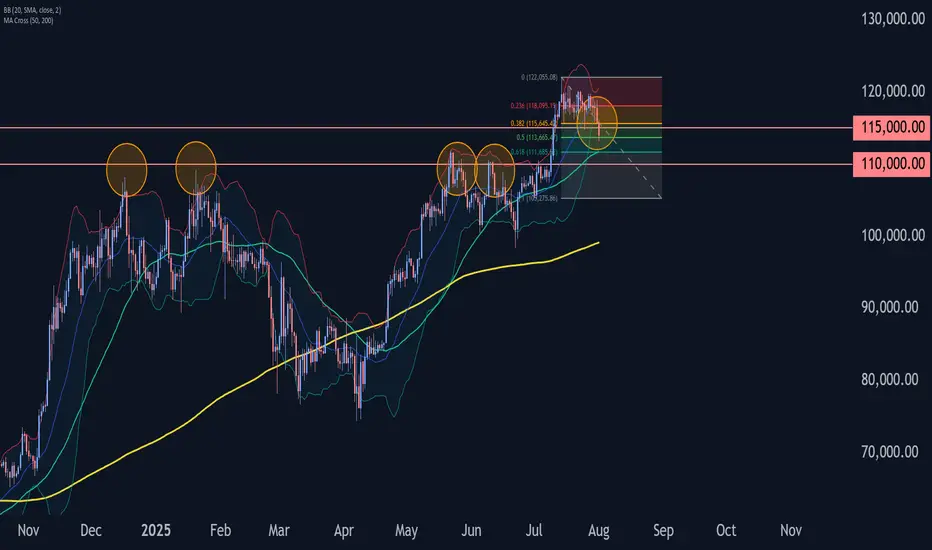
Bitcoin Wave Analysis – 1 August 2025- Bitcoin broke the pivotal support level 115000.00
- Likely to fall to support level 110000.00
Bitcoin cryptocurrency recently broke below the pivotal support level 115000.00, coinciding with the 50% Fibonacci correction of the sharp upward impulse from the start of July.
The breakout of the support level 115000.00 strengthened the bearish pressure on Bitcoin.
Given the bearish sentiment seen across the cryptocurrency markets today, Bitcoin can be expected to fall to the next support level at 110000.00 (former resistance from May and June).
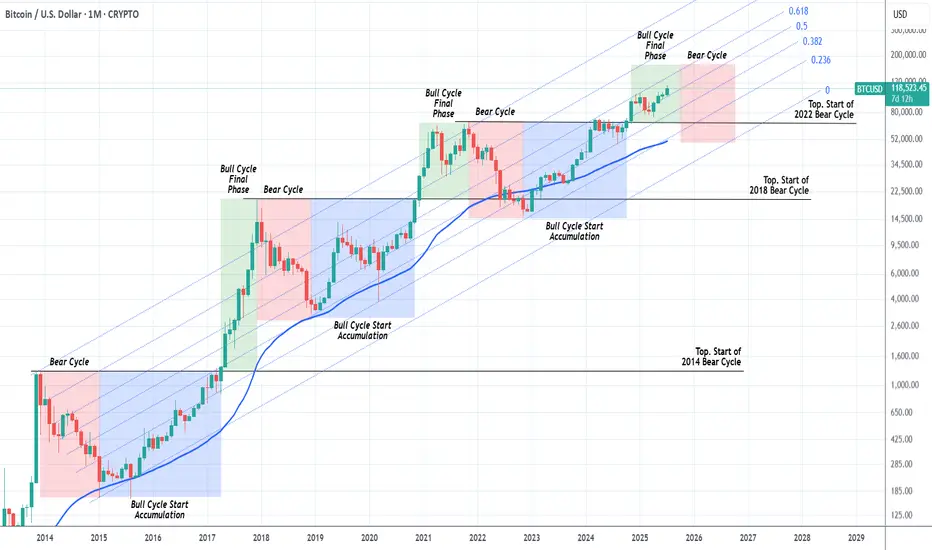
BITCOIN Should we start thinking about the next Bear Cycle yet?Bitcoin (BTCUSD) has had extremely symmetric (time-wise) Cycles in the past +10 years and this is a subject we've analyzed extensively many times. We've spent the last months projecting potential Targets for each stage of the bull run and only the last few are left.
This is exactly why we thought today's chart would be very fitting. The current Bull Cycle isn't over yet but also, based on the 4-year Cycle Theory, isn't far of either. By October 2025, that model suggests that all profit should have been taken.
As you can see, we are in the green zone, the Bull Cycle's Final Phase and since this Cycle has been trading entirely within the 0.236 - 0.618 Fibonacci Channel range, by October the price shouldn't be much higher than $160k.
In any event, this is a good guide, presented to you in a good time, to keep your mindset inside a long-term perspective and prepare you for not only the upcoming Top but also the next (1 year) Bear Cycle, which could again push the price below the 1M MA50 (blue trend-line), which would be a solid level for long-term buy positions again.
So do you think the Top is closer than it looks? Feel free to let us know in the comments section below!
-------------------------------------------------------------------------------
** Please LIKE 👍, FOLLOW ✅, SHARE 🙌 and COMMENT ✍ if you enjoy this idea! Also share your ideas and charts in the comments section below! This is best way to keep it relevant, support us, keep the content here free and allow the idea to reach as many people as possible. **
-------------------------------------------------------------------------------
💸💸💸💸💸💸
👇 👇 👇 👇 👇 👇
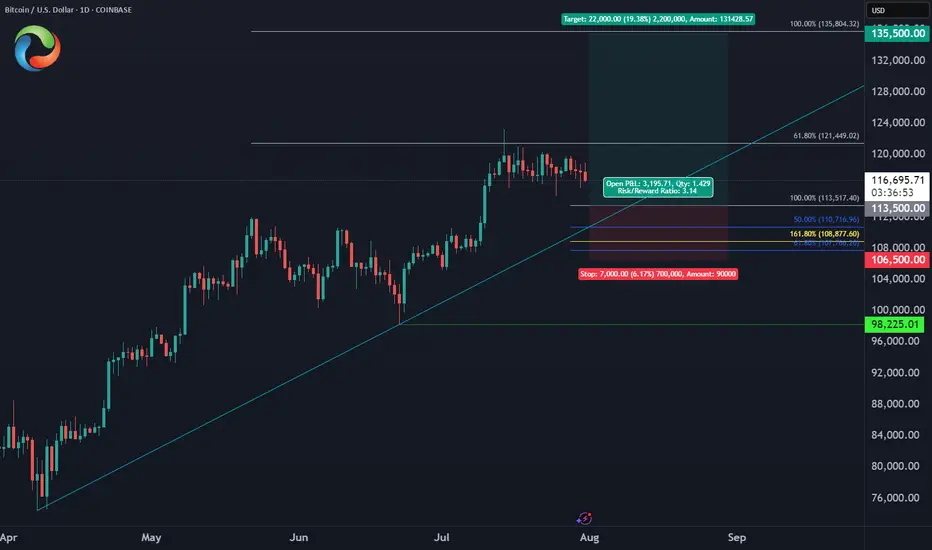
Bitcoin August Trade PlanBINANCE:BTCUSD
✅Entry Zone: $113,500 - $110,700
⛔️Stop: $106,500 (below June low)
🎯Target: $135,500 (ATH liquidity)
🔖Risk/Reward: 1:3
BTCUSD – Descending Channel or Bullish Flag?BINANCE:BTCUSDT – Market Maker’s Game Inside a Descending Channel
Timeframe: 2H | MJTrading View
Market Structure Overview:
Bitcoin recently printed a new ATH at $122,000 after a parabolic run from the previous ATH at $111,937.
Since then, price has been consolidating inside a descending channel, which could act as a bullish flag in higher timeframes.
Liquidity pools are clearly formed:
Above $122K – resting stops of late shorts.
Below $115K–$114K – weak long stops and untapped demand near the Order Block (OB).
Key Levels & Liquidity Zones:
Upside:
$122K Liquidity Pool → If swept, could trigger momentum towards $124K–$125K.
Downside:
$116K OB → First defensive zone for bulls.
$112K Strong Support → Aligns with previous ATH breakout base.
Market Maker’s Dilemma:
If you were a market maker… which liquidity pool would you hunt first?
Price is coiling tighter within the channel, and both scenarios are possible:
Upside Sweep → Rapid breakout above $122K to clear shorts, then potential continuation.
Downside Sweep → Sharp drop into $116K–$112K liquidity, flushing longs before any recovery.
⚡ MJTrading Insight:
This is the classic market maker compression – first sweep likely determines direction.
Patience here is key; let the liquidity tell the story.
#BTCUSD #Bitcoin #Liquidity #SmartMoney #PriceAction #MJTrading #ChartDesigner #CryptoAnalysis
Psychology Always Matters:

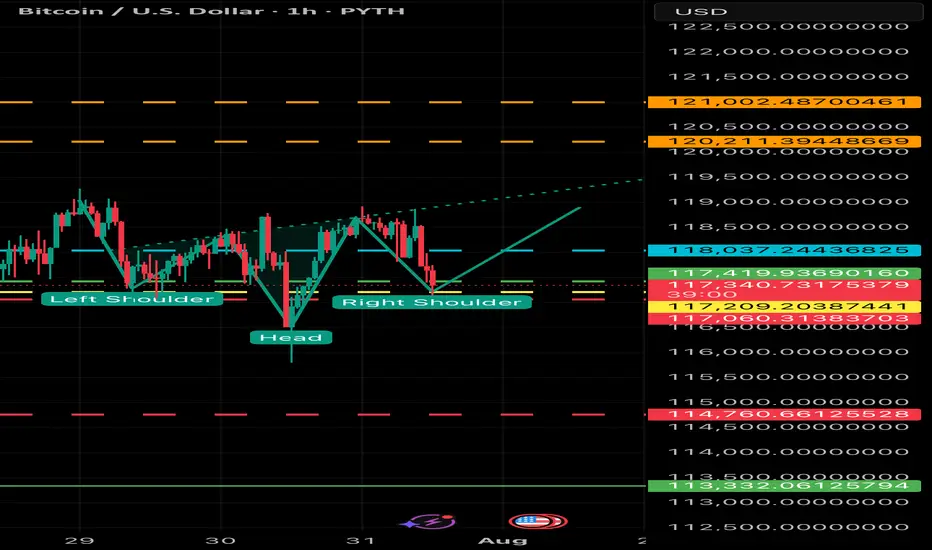
BULLISH BTC - Potential Inverted head and shoulders forming Potential breakout to $119 to $124,000 - Look for volume and support at $116 to $117,000. Breakout above $118,500 will confirm formation.
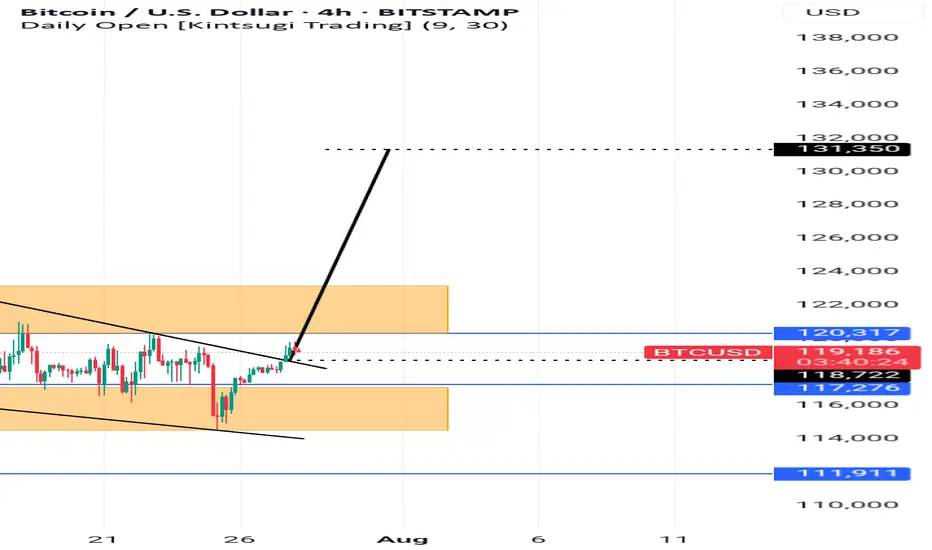
Bullish movementBitcoin has formed a falling wedge pattern, the retest as already happened with two candles already closing and the third one currently forming.
There is a possibility that it can form another retest before finally moving upwards and this would be the time to enter a buy position (119.223) and ride the move upwards all the way to 131.350
Alternatively one can wait to see whether price will move upwards and respect the resistance level and move downwards for a sell.
BTCUSD 8/1/2025Come Tap into the mind of SnipeGoat as he gives you a Full Top-Down Analysis of Bitcoins Price Action as we come into the month of August. What is Price doing? Where is Price going? Come get the answer here!
_SnipeGoat_
_TheeCandleReadingGURU_
#PriceAction #MarketStructure #TechnicalAnalysis #Bearish #Bullish #Bitcoin #Crypto #BTCUSD #Forex #NakedChartReader #ZEROindicators #PreciseLevels #ProperTiming #PerfectDirection #ScalpingTrader #IntradayTrader #DayTrader #SwingTrader #PositionalTrader #HighLevelTrader #MambaMentality #GodMode #UltraInstinct #TheeBibleStrategy
