BTCUSD| XAUUSD| AUDUSDwe did a quick look on last week analysis and how price eventually went, so we try to look the direction of price as the general trend currently isa side ways move.
BTCUSD trade ideas

#Bitcoin – What’s Really Happening? Daily Structure + Macro#Bitcoin – What’s Really Happening?
Daily Structure + Macro Setup = Big Move Loading
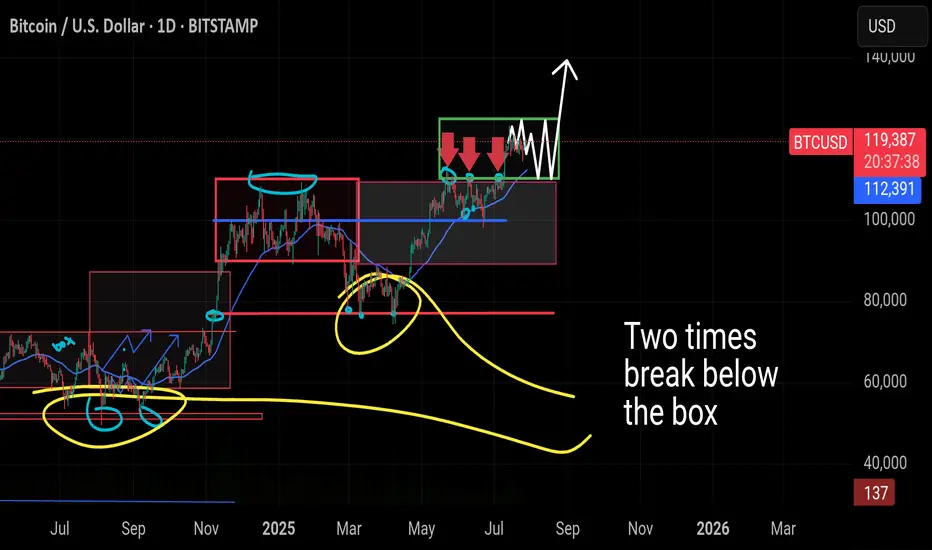
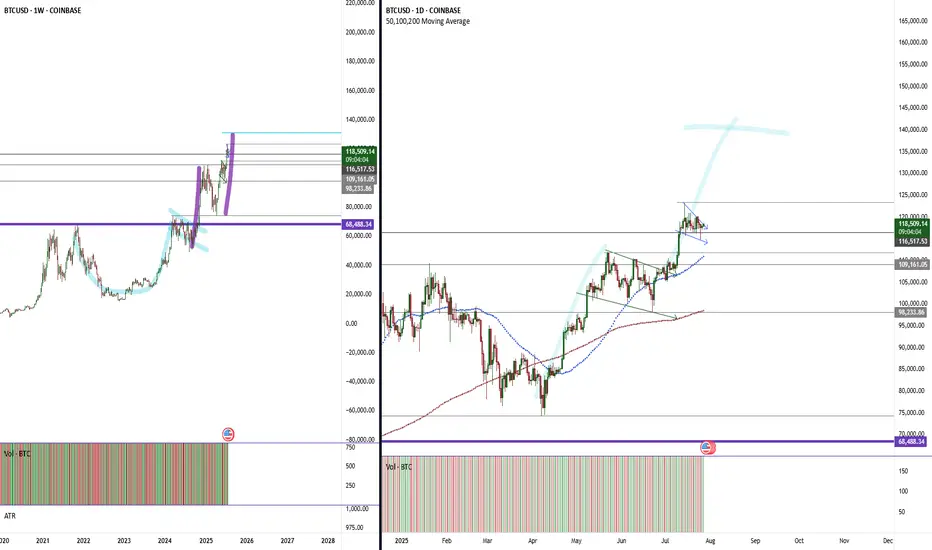
🔸 1D Chart: CRYPTOCAP:BTC Range-Bound Between $125K–$110K
Bitcoin is currently trading inside a tight sideways range, marked by resistance near $125,000 and support around $110,000. This is now the third time we've seen price consolidate in this green zone.
🔸 In the previous two attempts, BTC briefly dipped below support before quickly reclaiming the level — classic fakeouts, not real breakdowns. The current price behavior mirrors that same structure.
🔸 What If CRYPTOCAP:BTC Drops Again?
A dip below $110K or even toward $100K should not trigger panic. Historically, these wicks below the range are liquidity grabs — not signs of weakness. As long as the 200 MA holds and price doesn’t sustain under $100K, the macro trend remains bullish.
🔸 Key Zones:
– Immediate support: $112,398
– Major support: $100K psychological level
– Structure invalidation: Sustained loss below $100K (not expected)
🔸 Macro Outlook: Still Bullish
While BTC chops sideways, the broader environment is heating up:
🔸 Trump-EU Mega Trade Deal
Markets just got a major catalyst — a massive U.S.–EU agreement that includes:
– $750B in U.S. energy exports
– $600B in EU investment
– $150B in energy purchases from U.S.
This clears out tariff fears and opens the door for stocks and crypto to run. Risk appetite is returning fast.
🔸 Whale Activity Panic = Noise
Galaxy Digital wallet movement spooked the market temporarily, pushing BTC to $114,500. But zoom out:
– ETF inflows still dominate daily sell volume
– BlackRock continues absorbing supply
– Long-term whales haven’t sold — they’re holding
This was not a breakdown. It was a shakeout. Accumulation is still happening.
🔸 The Real Fuel: M2 Money Supply
Here’s where things really align for the bulls:
– In 2020, a 25% rise in M2 → BTC 800% rally
– In 2025 so far: +2.3% increase, and we’re still in “tightening”
– Largest M2 spike: +0.63% in June
Given BTC typically lags M2 by 60–90 days, the June print is setting up for a 15–17.5% upside over the coming weeks. That puts us on a clear path toward $130,000+
🔸 Bitcoin is sideways, not weak. Range-bound price action is accumulation, not distribution. Macro signals are aligning, M2 is expanding, and whale panic was short-lived.
We’re not just holding a range — we’re coiling for the breakout.
You’re early. Stay ready.
#bitcoin
BTC?
Hi,
Next 48hrs.
We hope to see momentum to the upside.
Firm break of Insidebar H4 (high of 119800)
If this probability/theory is solid.
Expecting +^>10% movement in 1 week
All the best
Have your R:R ready.
NB/ NOT A GURU
manage well okayy
Hope all the success for youu
(note; the reversal that day was real, hurting many hodl- seller will be turning buyers soon, creating bigger momentum )

BTCUSD Bullish Move Price Tap on the W FVG and respected this POI , we can target the Buyside Liquidity above
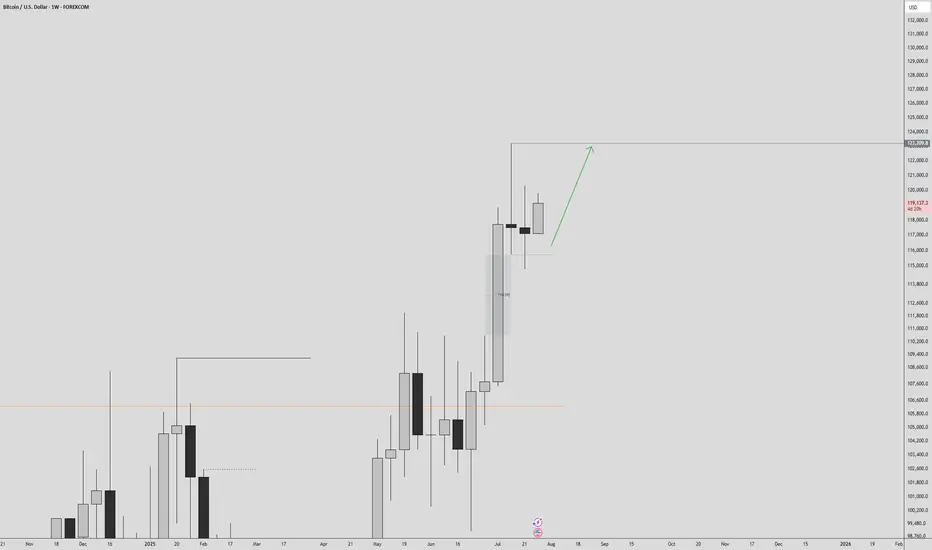
Bitcoin Weekly Seal at the Threshold 122K - No Gaps, No Retreat.⊣
⟁ BTC/USD - BINANCE - (CHART: 1W) - (Jul 27, 2025).
◇ Analysis Price: $119.374,00.
⊣
⨀ I. Temporal Axis - Strategic Interval - (1W):
▦ EMA9 - ($112.771,21):
∴ The weekly close remains above the EMA9, preserving short-term bullish structure;
∴ The EMA9 continues rising at a consistent slope, reflecting sustained upward momentum;
∴ A retracement to this level would represent the first defensive support on a tactical pullback.
✴️ Conclusion: EMA9 acts as a dynamic short-range support and trend continuation marker.
⊢
▦ EMA21 - ($104.883,22):
∴ Price remains notably above the EMA21, confirming structural strength in medium-term trend;
∴ The EMA21 was previously retested during consolidation in Q2 2025;
∴ A weekly close below it would indicate a structural loss of momentum.
✴️ Conclusion: EMA21 confirms medium-term bullish bias as long as preserved.
⊢
▦ WMA50 - ($98.605,81):
∴ WMA50 serves as a major cyclical support and remains untouched since early 2024;
∴ The gap between price and WMA50 indicates strong extension, yet risk of mean reversion rises;
∴ This level aligns with a prior demand zone around ($95K–$100K).
✴️ Conclusion: WMA50 is a latent demand zone - strategic if market reverts from exhaustion.
⊢
▦ WMA100 - ($84.570,72):
∴ This weighted average aligns with the 0.382 Fibonacci level;
∴ A long-term correction toward this band would reflect the depth of macro pullbacks in previous cycles;
∴ Currently distant from price action, but structurally significant if macro volatility increases.
✴️ Conclusion: WMA100 anchors mid-cycle recalibrations and aligns with retracement symmetry.
⊢
▦ WMA200 - ($63.181,79):
∴ The 200-week WMA remains far below price and untouched since early 2023;
∴ This is the ultimate structural support in secular bull cycles;
∴ If revisited, it signals macro-level capitulation or black swan scenario.
✴️ Conclusion: WMA200 holds the foundational line of long-term structural integrity.
⊢
▦ Fibonacci Retracement - (Range from 0 = $27.143,79 to 1 = $122.056,95):
∴ 0.000 = $27.143,79 - Genesis base from Apr 2025 cycle;
∴ 0.236 = $49.543,30 - Psychological line of control in late 2023;
∴ 0.382 = $63.400,62 - Aligned with long-term moving averages;
∴ 0.500 = $74.600,37 - Symmetry pivot of current macro-leg;
∴ 0.618 = $85.800,12 - Golden pocket lower bound;
∴ 0.786 = $101.745,53 - Golden pocket upper edge and structural resistance pre-breakout;
∴ 1.000 = $122.056,95 - Current cycle high (resistance zone);
∴ 1.618 = $180.713,28 - Projected extension target for parabolic continuation.
✴️ Conclusion: Key retracement zones for tactical reactions lie at (0.786 - $101.7K) and (0.618 - $85.8K); upside breakout target confirmed at (1.618 - $180K).
⊢
▦ Volume + EMA21 - (Last: 2.38K BTC):
∴ Volume is stable and slightly rising compared to prior weekly sessions;
∴ No high-volume sell candles indicate panic or exit;
∴ EMA21 on volume shows baseline liquidity remains active.
✴️ Conclusion: Healthy volume confirms orderly continuation rather than climax or exhaustion.
⊢
⨀ II. Momentum & Pressure Indicators:
▦ RSI (21) + EMA9 - (66.71 / 64.34):
∴ RSI approaches the 70-level but remains below overbought territory;
∴ EMA of RSI confirms rising internal strength;
∴ No divergence is observed - internal price energy remains aligned with upward momentum.
✴️ Conclusion: RSI signals strong but not overheated momentum - bulls still in control.
⊢
▦ MACD (9, 21) - (MACD: 7,887.99 | Signal: 6,362.06 | Histogram: +1,525.93):
∴ MACD histogram remains green, showing continuation of bullish trend;
∴ The spread between MACD and Signal is positive and expanding again;
∴ No bearish crossover threat imminent at current slope.
✴️ Conclusion: MACD structure reinforces bullish pressure - trend still intact.
⊢
▦ OBV + EMA9 - (OBV: 220.38M):
∴ OBV remains in an uptrend, supporting price action;
∴ EMA overlay shows no divergence or flattening;
∴ Volume accumulation remains healthy, confirming underlying conviction.
✴️ Conclusion: OBV supports continuation - no signs of distribution.
⊢
▦ Stochastic RSI (3,3,21,9) - (%K: 93.68 / %D: 90.72):
∴ Both %K and %D lines are in the overbought zone (>90);
∴ Crossovers are still bullish but nearing potential exhaustion zone;
∴ Caution warranted for short-term momentum correction.
✴️ Conclusion: Overbought levels reached - watch for tactical slowing, though no reversal confirmed.
⊢
🜎 Strategic Insight - Technical Oracle:
∴ The weekly chart exhibits a structurally intact bull trend, confirmed by the alignment and spacing of EMA's and WMA's across all horizons (short, mid, long);
∴ Fibonacci retracement levels delineate critical reaction zones, with (0.786 - $101.745,53) and (0.618 - $85.800,12) serving as dominant retrace supports in the event of a tactical correction;
∴ The presence of a projected (1.618 extension at $180.713,28) offers a sacred path forward should price breach and sustain above the current high of $122K.
∴ Momentum oscillators (RSI and MACD) continue their upward thrust without divergence, but the Stochastic RSI warns of temporal exhaustion - a typical hallmark before consolidation or rotation;
∴ Volume structure is stable and non-climactic, suggesting continuation rather than blow-off;
∴ No sign of distribution via OBV - accumulation remains intact.
✴️ Conclusion: The market remains within the upper chamber of the Fibonacci spiral. Tactical cooling is possible due to overextension in the momentum field, but no structural damage is observed. A controlled retrace into the golden pocket would be both acceptable and ritualistically symmetrical. The path to $180K remains open, but guarded.
⊣
⟁ BTC/USD - CME Futures BTC1! - (CHART: 1D) - (Jul 27, 2025):
◇ Current Price: $120.785.
◇ Chart Link:
⊣
▦ CME Futures GAP - Observation & Ritual Closure:
∴ The current chart shows a clustered consolidation near $120K–$121K with no immediate upper gap visible;
∴ The last prominent CME Gap was filled during the late June run-up and early July vertical move;
∴ No new gap formed during the weekend-to-weekday open for the last 3 sessions - continuity is intact.
✴️ Conclusion: There is no unfilled CME Gap between the current price and previous sessions. All recent discontinuities appear ritually sealed. Attention now turns to potential downside gaps from rapid bullish impulse moves around ($104K–$108K), which could remain structurally unfilled - unless tactically challenged during correction.
⊢
🜎 Strategic Insight - CME Oracle:
∴ The lack of open CME Gaps suggests a clean technical field - no magnet effect pulling price backward in the short term;
∴ The compression near $121K may precede either an explosive breakout toward the Fibonacci extension ($122K / $130K+), or serve as a false plateau before a tactical flush;
∴ Absence of gaps also removes "gap fill" traders from immediate relevance, allowing price to move freely based on liquidity and macro flows.
✴️ Conclusion: The CME chart confirms no active gravitational pull downward - the battlefield is neutral and favorably clean for bullish continuation, pending macro and liquidity alignment.
⊢
∫ III. On-Chain Intelligence - (Source: CryptoQuant):
▦ Exchange Inflow Total + 9EMA - (All Exchanges):
∴ Exchange inflows remain significantly suppressed, with no spikes above 75K BTC since Q4 2023, despite the price nearing $120K;
∴ The 9EMA of inflows is stable and near local lows, showing no abnormal movement toward exchanges;
∴ Historically, spikes in inflow coincide with distribution, fear, or profit-taking, none of which are currently present on a structural level.
✴️ Conclusion: The on-chain exchange inflow behavior confirms low distribution pressure at current highs. The lack of elevated Bitcoin deposits into exchanges indicates conviction among holders and the absence of a mass selloff attempt, even near critical Fibonacci resistance.
⊢
🜎 Strategic Insight – On-Chain Oracle:
∴ While price consolidates near its cyclical high, exchange inflows remain muted, echoing behavior observed during earlier phases of strong market conviction (e.g., late 2020);
∴ This suggests the market is not preparing for heavy liquidation;
∴ The silence of inflows reinforces the tactical hypothesis that current price action is organic and not panic-driven, preserving the ritual path toward ($122K/$180K).
⊢
⧉ IV. Contextvs Macro-Geopoliticvs - Interflux Economicvs:
▦ US-EU Trade Accord: 1(5% Unified Tariff Across All Sectors):
∴ The United States and the European Union have reached a comprehensive trade agreement, averting escalation: a 15% unified tariff will apply across most EU exports to the US, down from a threatened 30%;
∴ Exceptionally high 50% tariffs remain on steel and aluminum, while some industries such as automotive, semiconductors, and pharmaceuticals will be capped at 15%;
∴ Zero-tariff exemptions have been granted to strategic sectors, including aerospace, select chemicals, semiconductor equipment, agricultural products, and critical raw materials;
∴ In return, the EU has committed to invest $600 billion in US infrastructure and tech, and to purchase $750 billion worth of US energy and defense products over three years.
✴️ Conclusion: The trade pact imposes moderate cost adjustments for key industries but restores transatlantic stability. Although friction remains in sensitive sectors, the agreement prevents global trade disorder and enhances strategic economic visibility.
⊢
🜎 Strategic Insight - Macro Oracle:
∴ The accord mitigates systemic trade risk and clears geopolitical uncertainty, which would otherwise impair market confidence in risk-on assets;
∴ Predictable tariffs (15%/50%) reduce abrupt inflationary shocks, enhancing macroeconomic forecasting and central bank policy latitude;
∴ Massive EU commitments in energy and defense inject transatlantic liquidity and strengthen demand for US dollar-based assets;
∴ While European manufacturers face pressure, the global system benefits from lower volatility and restored economic symmetry;
∴ This opens room for speculative and structural capital to flow more confidently into high-volatility instruments, including crypto assets.
✴️ Conclusion: The macro backdrop reinforces the sacred bullish path - a re-alignment of order in the West, combined with non-disruptive trade stabilization, lays the groundwork for continuation of liquidity-driven risk flows. Bitcoin stands to benefit as a speculative vessel in a structurally stable yet monetarily dynamic environment.
⊢
𓂀 Stoic-Structural Interpretation:
▦ Structurally Bullish - Tactically Watchful:
∴ Price remains above all critical EMA's and WMA's on the 1W chart;
∴ Fibonacci structure is intact, with the $122K high acting as ritual resistance and the (0.786 / 0.618 zone ($101K / $85K) as sacred fallback;
∴ Momentum indicators (MACD, RSI) sustain positive bias with no divergences;
∴ CME Futures show no unfilled gaps - the field is clean, allowing strategic extension.
✴️ Conclusion: The macrostructure supports continuation higher into the sacred extension zone ($130K–$180K), with short-term vigilance warranted due to overbought Stoch RSI and reduced volume velocity.
⊢
▦ Tactical Range Caution:
∴ Upper Limit: $122.056 - Cycle high and Fibonacci 1.0;
∴ Mid Guard: $112.770 - EMA9;
∴ Structural Support: ($101,745 - 0.786) Fib retrace;
∴ Golden Anchor: ($85.800 - 0.618) Fib retrace.
✴️ Conclusion: As long as price remains above $101K, the bullish code remains sealed. Breach of $85K would unlock deeper structural reassessment.
⊢
◩ Codicillus Silentii - Strategic Note:
∴ The week closes at the threshold of the Fibonacci (1.0 mark - $122.056), beneath a ceiling forged by time and belief;
∴ All technical layers are aligned, yet the silence in the inflow, the clean CME field, and macro equilibrium whisper a rarer truth - no storm is seen, but no wind is promised;
∴ This is the zone of the Watcher - where action becomes hesitation, and hesitation becomes discipline.
✴️ Strategic Note & Final Seal: Do not confuse absence of danger with presence of opportunity. A vertical structure with no threat below can still falter from within. This is a time not to act, but to remain unshaken.
⊢
⧉
· Cryptorvm Dominvs · MAGISTER ARCANVM · Vox Primordialis ·
⚜️ ⌬ - Silence precedes the next force. Structure is sacred - ⌬ ⚜️
⧉
⊢

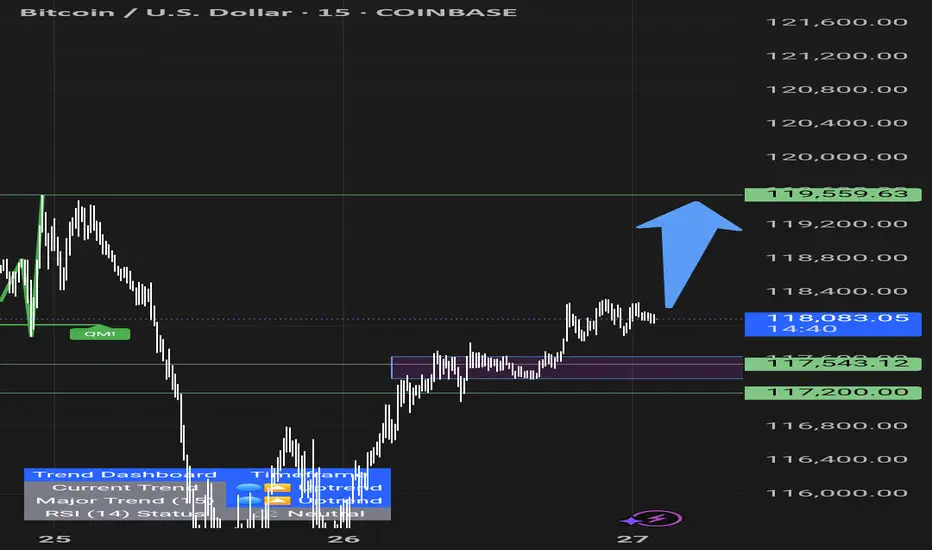
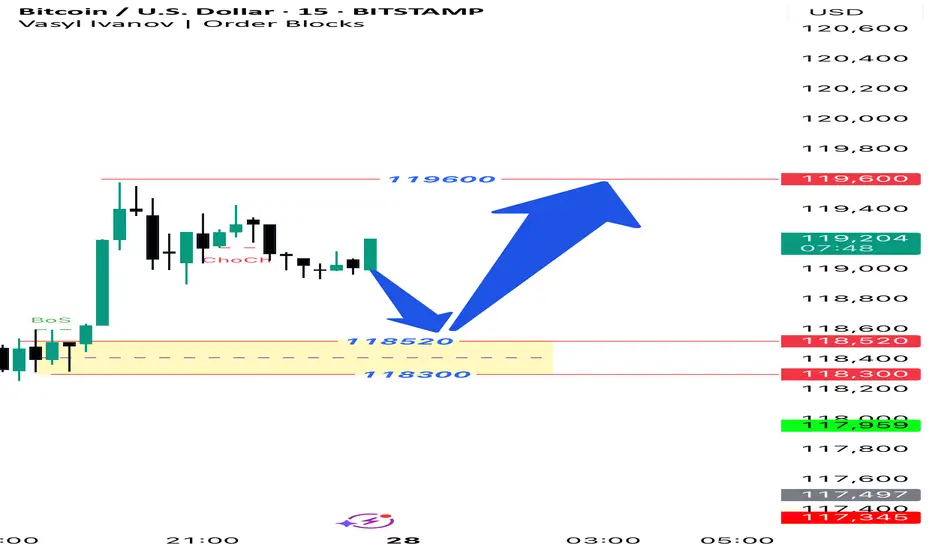
BTCUSD 15M Setup The trend is up in the 1-hour timeframe, so we are looking for buying opportunities in the 15-minute timeframe. We expect the price to fall to the range of 118,520 to 118,300 and then rise to the target of 119,600 and above.

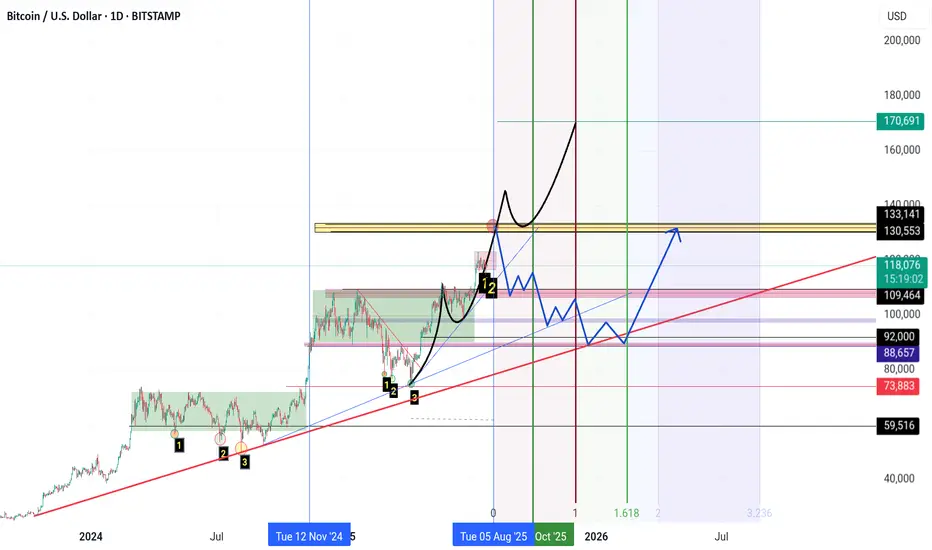
$BTCUSD - Bullish 2025 - Cycle Wave III up (eta Dec2025)NOT FINANCIAL ADVICE
Let's start with this bullish outlook on Bitcoin and its various phases:
Here, I estimate the likelihood of CRYPTOCAP:BTC 's journey through its Cycle Wave III.
AI Generated Bitcoin Prediction: No ATH This Week! 📉 AI Generated Bitcoin Prediction: No ATH This Week! 🚫📈
Euphorisme is what traps people... watch out.
📌 Overview
In this 1H Heikin Ashi chart for BTC/USD, a clear AI-generated prediction outlines a volatile week ahead, but with no signs of a new all-time high (ATH). While price action recently broke above key resistance levels around $119,300–$119,570, the projected trajectory is more cautious than bullish.
The blue line overlay sketches a speculative wave structure — an AI-based forecast — suggesting multiple failed attempts to break above $122,165, a level that coincides with previous rejection zones.
🔍 Key Technical Levels
Level Significance
$122,165 Major rejection level
$120,916.94 Resistance + liquidity zone
$119,568.92 Immediate rejection area
$118,313.11 EMA & SMA cluster support
$118,185.55 Short-term support
$117,893.78–$118,037.81 Bull trap range
⚠️ Why You Should Be Cautious
The AI-predicted price action shows a pattern of rising highs followed by sharp reversals.
Multiple red inverted triangles suggest lower high formations, a sign of weakening bullish momentum.
Current levels around $119,300 are still within a macro supply zone, with price likely to consolidate or retrace.
🧠 Psychological Trap: Euphoric Longing
Markets often punish emotional entries — and euphoric breakouts like we saw at $119,500 tend to trigger FOMO longs. This is where smart money exits, not enters.
“If it feels like you're late to the move, you probably are.”
🔄 Mid-Term Scenario
If the AI prediction holds:
Expect volatility with fake breakouts.
Watch for distribution near $122K.
A potential drop toward $118K–$117.8K may offer a better re-entry.
📆 Macro Context
The week is filled with economic events (marked below the chart), and the AI model seems to expect choppy reactions, not a clear breakout. These red calendar icons often correlate with increased volume and traps.
🧩 Strategy Suggestion
Avoid chasing pumps into resistance zones.
Wait for confirmation or deviation from the projected path.
Consider setting alerts near $122K and $118K to monitor key reactions.
🧠 Final Thought:
ATH is a process, not an event. If the AI is right, we’re not there yet.
“Let the herd long the top, and let you short the trap.” – Smart Money
💬 Share your thoughts below. Do you agree with the AI's prediction?
🔔 Follow for more predictive insights & logic-backed analysis.
#Bitcoin #BTCUSD #CryptoTrading #NoATH #SmartMoney #TradingPsychology #EuphoricTrap #HeikinAshi #BTCAnalysis

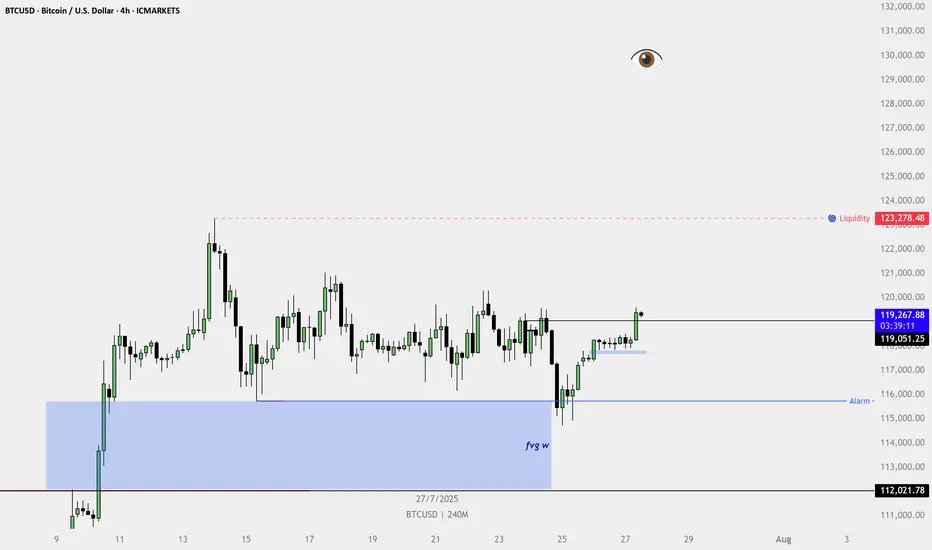
BTCUSD 4H chart is clearly showing a bullish structure.🔍 Technical Highlights:
HTF FVG Tap (Marked as "fvg w"):
Price reacted strongly from the weekly fair value gap, indicating institutional buying interest from a higher timeframe demand zone.
Higher Low + Bullish Break:
Price formed a higher low and broke above the recent swing high, confirming a shift to bullish structure.
4H Bullish FVG Formed:
After the breakout, a fresh bullish FVG formed on the 4H chart — a classic sign of momentum and continuation.
Breaker Structure Confirmed:
Price closed above a series of bearish candles, confirming buyer strength and trapping late sellers.
Internal Liquidity Taken:
The range-bound consolidation (chop) has been swept, clearing out internal liquidity and fueling the breakout.
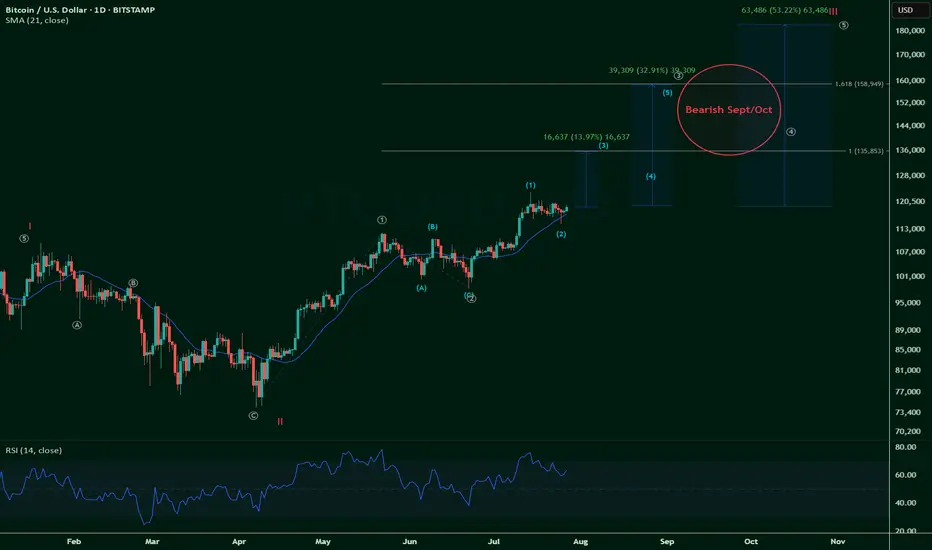
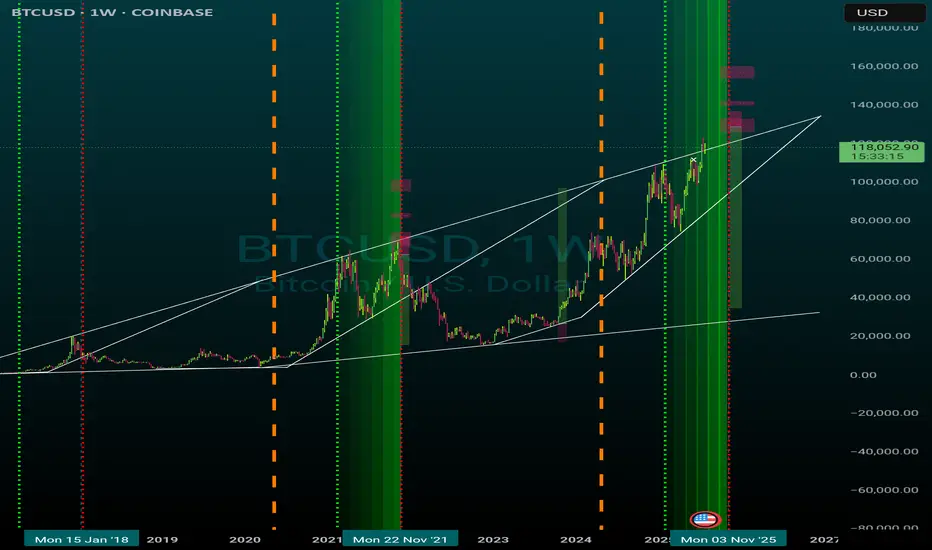
Diminishing return target ideaA concept grounded in the recurring four-year market cycles, taking into account the observable logarithmic trend lines of diminishing returns with each successive cycle

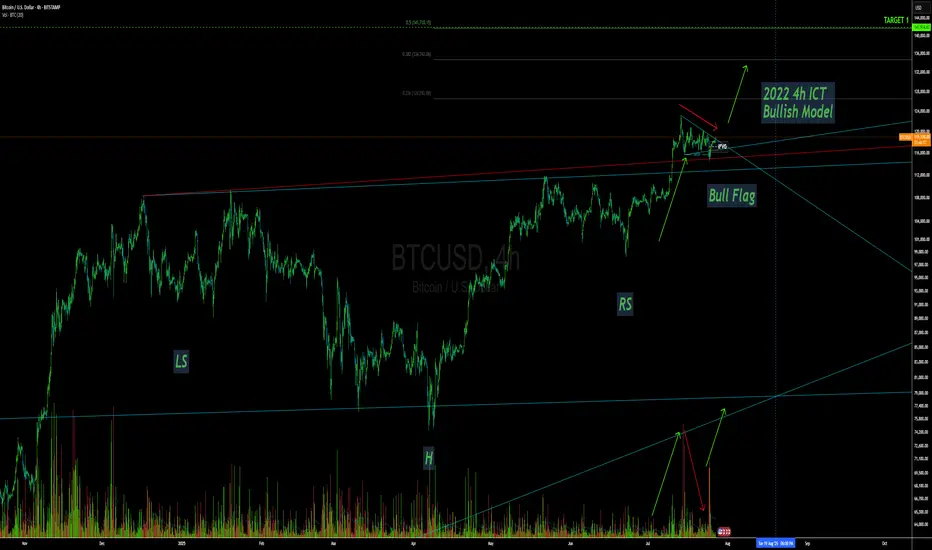
BTC - Long!The last few weeks flagging out of this Inverse H&S Fridays is already bullish, Fridays fakeout lead to a 4HR 2022 iFVG ICT model, Bullish, Not much more to say other than see you at 140k+.
Riding sep OPEX IBIT $70 Calls.
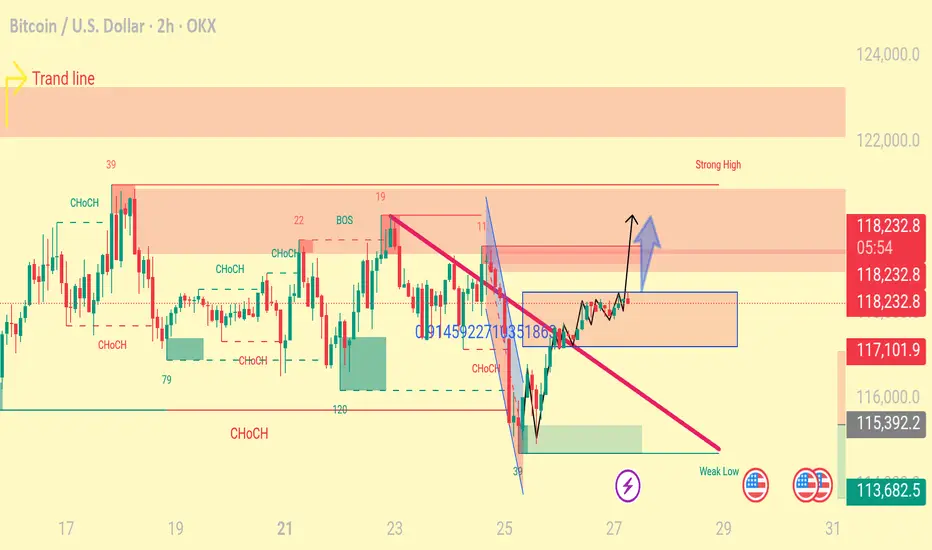
Bullish Breakout Signals Potential for New All-Time HighsBased on the 4-hour chart for BTC/USD, the price action is showing strong bullish signals, suggesting a potential continuation towards new all-time highs. The key target area, following this breakout, is projected to be between $128,000 and $130,000.
Key Observations:
Pattern Breakout: The most significant development on the chart is the decisive breakout from a major descending trendline. This trendline has been acting as resistance for several weeks, forming a large consolidation pattern, likely a falling wedge or a descending triangle. A breakout above this pattern is a classic technical indicator of a potential trend reversal to the upside and a continuation of the larger uptrend.
Bullish Momentum: The price is currently trading above all key moving averages. The shorter-term moving averages are also positioned above the longer-term ones, which confirms the building bullish momentum in the market.
Key Price Levels & Targets:
The first major target is the horizontal resistance level at approximately 123K.
Should the bullish momentum sustain and break through the $123k resistance, the next logical target would be to challenge previous highs and push into price discovery. Based on the strength and structure of this pattern, a move towards the $128,000 - $130,000 range is a strong possibility.
Risk Management:
The illustrated trade setup shows a clear entry point just after the breakout.
A tight stop-loss is placed around 118K, just below the recent price structure.
Conclusion:
The breakout from the multi-week descending pattern is a powerful bullish signal for Bitcoin. With momentum indicators aligned and a clear path to the next major resistance, the outlook is optimistic. If buyers maintain control, a rally to test the 123K level is imminent, with the ultimate potential to forge a new all-time high in the 128K to 130K zone. Traders should watch for sustained volume to confirm the breakout's strength.

Bitcoin - Strategic Coil Within the Arcane Band.⊢
⟁ BTC/USD - BINANCE - (CHART: 4H) - (July 27, 2025).
◇ Analysis Price: $118.309,59.
⊣
⨀ I. Temporal Axis - Strategic Interval - (4H):
▦ TEMA9 - ($118.338,48):
∴ Price is currently below TEMA9, indicating near-term resistance;
∴ Curve is upward-sloping but flattening, suggesting fading acceleration;
∴ Acts as reactive signal line; minor rejection occurred on contact.
✴️ Conclusion: Momentum fading as price struggles to hold above dynamic resistance.
⊢
▦ HMA21 - ($118.324,83):
∴ Smooth curvature maintaining upward bias;
∴ Close proximity to TEMA9 shows compressed volatility regime;
∴ Price interacting with HMA without definitive breakout.
✴️ Conclusion: Tactical direction remains constructive, but confirmation is lacking.
⊢
▦ EMA50 - ($117.794,89):
∴ Strong medium-term support; price remains above it with clear respect;
∴ Acts as lower bound of the current compression channel;
∴ No bearish cross detected with TEMA or HMA.
✴️ Conclusion: Mid-term bullish support structure intact.
⊢
▦ EMA200 - ($113.979,81):
∴ Structure well below active price; rising and stable;
∴ Indicates long-term bullish posture is unbroken;
∴ No signs of major breakdown or transition to bear structure.
✴️ Conclusion: Structural uptrend remains unthreatened.
⊢
▦ SuperTrend Arcanvm - (ATR 10, 1.5 - $117.640,25):
∴ Price trades above the SuperTrend line, indicating continuation zone;
∴ Support zone lifted slightly, confirming minor trend maintenance;
∴ No signal reversal or close below since last shift.
✴️ Conclusion: Tactical upward bias protected by volatility-based support.
⊢
⨀ II. Momentum & Pressure Indicators:
▦ Stochastic RSI (3,3,21,9) - (%K: 88.23 / %D: 88.27):
∴ Deep into overbought zone; potential reversal region;
∴ Minor negative crossover forming (%K < %D);
∴ Pattern shows repeated false breaks from high zone.
✴️ Conclusion: Overextended with local fatigue building.
⊢
▦ MACD (9,21,9)- (Line: 164.40 / Signal: 106.94 / Histogram: +57.47):
∴ Bullish crossover confirmed and holding; histogram positive;
∴ Increasing MACD separation suggests underlying momentum;
∴ No divergence yet; consistent short-term upside energy.
✴️ Conclusion: Momentum favors bulls but remains immature.
⊢
▦ MFI (14) - (68.20):
∴ Trending toward overbought zone without breach;
∴ Steady increase reflects sustained volume-backed inflows;
∴ Not yet extreme; still has energy potential to fuel move.
✴️ Conclusion: Volume pressure supports bullish case with room left.
⊢
▦ Accumulation/Distribution + HMA21 - (74.89M):
∴ Line remains stable above short-term base; no outflow signals;
∴ Slight incline observed, confirming ongoing accumulation;
∴ No divergence with price; consistent flow.
✴️ Conclusion: Capital positioning remains supportive of continuation.
⊢
🜎 Strategic Insight - Technical Oracle:
∴ The current 4H structure on BTC/USD exhibits a compressed upward bias where dynamic resistance (TEMA + HMA) is being tested persistently but without explosive breakout;
∴ Momentum indicators (MACD, MFI) confirm early-stage bullish pressure, while structural supports (EMA50, SuperTrend) remain intact and responsive;
∴ However, Stoch RSI is saturated, suggesting that any continuation would likely require a cooling cycle or shallow retracement before sustainable thrust;
∴ This configuration aligns with a “Pre-Break Range Staging” - a technical limbo where buyers are present but cautious, and sellers are absorbed without significant follow-through.
✴️ Strategic Focus: Watch for confirmation above ($118.600) with volume expansion and MACD histogram follow-through, or a soft retest toward ($117.640/117.800) as reloading zone.
∴ Logic sealed. Tactical silence until resolution.
⊢
𓂀 Stoic-Structural Interpretation:
▦ Structurally Bullish - (Tactically Fragile Continuation):
∴ The long-term structure (EMA 200 rising, unbroken) confirms a preserved bullish frame;
∴ Mid-term support (EMA 50 + SuperTrend) is active and functioning as a technical base;
∴ However, price struggles to sustain above dynamic resistance (TEMA/HMA), and Stoch RSI signals short-term exhaustion.
✴️ Conclusion: The structure is upward, but the current tactical zone is sensitive. Any bullish continuation demands confirmation and discipline - no chasing.
⊢
▦ Tactical Range Caution:
∴ Support Zone - (Defensive): $117,640 / $117,800;
∴ Resistance Ceiling - (Breakout Trigger): $118,600;
∴ Tactical Neutral Band: $118,000 / $118,300.
✴️ Conclusion: No trade zone expands if compression persists. Breakout or breakdown must be decisive and accompanied by volume/momentum synchrony.
⊢
◩ Codicillus Silentii - Strategic Note:
∴ In moments of compressed structure near resistance, the market does not reveal itself through price - but through how it refuses to move. Silence becomes signal;
∴ What is observed here is not a lack of momentum - but deliberate withholding of directional intent;
∴ The system is balanced between emergent buy pressure (MACD, MFI, Accum/Dist) and short-term saturation (Stoch RSI), forming a strategic standoff:
No major actors are retreating, but none are charging forward either.
The candle bodies shrink while oscillators extend - a classic sign of non-confirmed bullish bias.
Emotional traders will chase; initiated ones will wait for the candle that breaks the silence, not the one that whispers hope.
✴️ Final Seal: The stoic operator does not react to pressure - he reacts to structure.
Tactical inaction is a move; Watching is positioning; Discipline is participation.
⊢
⧉
· Cryptorvm Dominvs · MAGISTER ARCANVM · Vox Primordialis ·
⚜️ ⌬ - Silence precedes the next force. Structure is sacred - ⌬ ⚜️
⧉
⊢

BTC consolidating within the original ideas BTC consolidating within the original ideas formed on weekly cup/handle and daily patterns.
Weekly cup/handle measured move to 130.
Daily consolidation with another flag forming with the target of 140.
BTC #Bitcoin (BTC/USD) 30-minute chart shows a recent breakThis Bitcoin (BTC/USD) 30-minute chart shows a recent breakout above a descending trendline (red) and an ascending wedge pattern. Price has broken out of a rounding structure, indicating a potential bullish reversal. The breakout candle is strong, suggesting bullish momentum. Key resistance lies near 120,000 (blue horizontal line), while support is around 115,600. Watch for confirmation of the breakout with volume or a retest of the breakout level for sustained upward movement.
thanking you

BTCUSD 7/27/2025Just a nice pic update aligning to my last callout in my previous video.
New Video dropping later today...
_SnipeGoat_
_TheeCandleReadingGURU_
#PriceAction #MarketStructure #TechnicalAnalysis #Bearish #Bullish #Bitcoin #Crypto #BTCUSD #Forex #NakedChartReader #ZEROindicators #PreciseLevels #ProperTiming #PerfectDirection #ScalpingTrader #IntradayTrader #DayTrader #SwingTrader #PositionalTrader #HighLevelTrader #MambaMentality #GodMode #UltraInstinct #TheeBibleStrategy
1H & 4H RSI1H & 4H RSI showing possible Bull Div waiting for price to catch up to activate inverse head & Shoulders just my own thoughts .

Bitcoin Daily shows us that a HUGE Hurdle has been crossed
The question I will answer in this post is "What is the significance of that Blue line that BTC PA is now sitting on"
On the Daily chart, we can see it has been tested as support and Held.
Previously, it was resistance..
So what ? This has happened many times before.
Lets zoom out and look at the weekly.
So, we see that the Blue line was also the rejection zone in 2021.
Infact, if you look, it has rejected BTC PA 5 times since March 2021 and we have finaly managed to get over it and seem to be comfortable using ot as support now.
This leaves the door open to move higher once PA is ready
But there is WAY MORE to this
Lets look at the monthly chart
So now we see that that same Blue Arc has also been rejecting BTC PA since 2011.
That is nearly the entire life span of Bitcoin and it is certainly the entire life span of its current Bullish momentum since we entered the current channel we are in..
So, in many way, this could be seen as a new beginning, a New cycle.
We do need to remain cautious for now though. As we can see, we did get over this line in 2013 but fell back below......and of course, the possibility for this to happen again exists BUT we now have massive Corporate investment. This could stop that fall.
PA needed to get over this line or fall.
Should this fail to hold for now, we will return to lower lines of support, around 70K- 80K but I would anticipate a massive buying spree should that happen.
The next few months in Bitcoin are absolutely CRUCIAL.
We need to remain above this Arc.
And as I have shown months ago, this Arc is not just a line drawn freehand.
It is actually calculated and is part of a Fibonacci Arc.
The Monthly chart also shows us we are near the ATH Zone on a time span shown under PA on this chart.
We may not see the steep rise we have previously...but the Major Victory is remaining ABOVE this Blue Arc
Fingers Crossed

Time to Wait and Watch
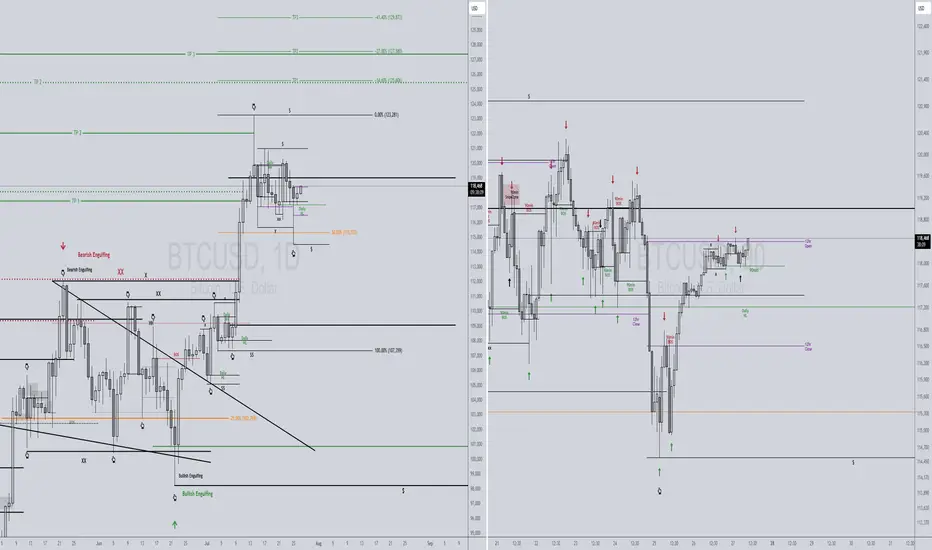
**"The $133K zone remains Bitcoin’s key resistance level.**
If Bitcoin fails to break this resistance for any reason and forms a **reversal candle** in this area,
I expect a **correction phase** to begin, with the market entering **panic sell mode.**
**First support** lies at **$110K.**
Further support levels are **$100K, $92K, and $88K** respectively.
If the price drops to the **$74K zone**, it’s time to **sell everything you’ve got** (yes, even your kidneys!) and **buy Bitcoin.**
However, if **$133K is broken to the upside**, we’re heading for **$140K, $150K, and $170K**… and **then** the real **panic selling** begins."
Bitcoin Who is buying and never taking profits?
The cycle are only cycles if the experience repetition.
Can we experience the full previous wave is the question.
Btcusd techinical analysis.Btcusd techinical analysis next move posibale at h2 time frame not finchinal advice.