BTC / GOLDIt appears as though the 4H BTC chart has formed a bull flag vs Gold/BTC chart having formed a bear flag. This is VERY encouraging to see. Short term price target is 134-140. Strap in, BTC is a bout to do BTC things again.
BTCUSD trade ideas

"Something’s cooking with BTC…"btc i think it's going up... not just 'cause the technicals look good, but 'cause big funds are already expecting crazy prices. blackrock, fidelity and others have mentioned btc at 150k or even 250k in a few years. and if they’re saying that, it’s not just talk... it’s 'cause they’ve got info most of us don’t.
plus, there’s less btc after the halving, and ETFs are scooping it up like crazy… you already know what that could mean.

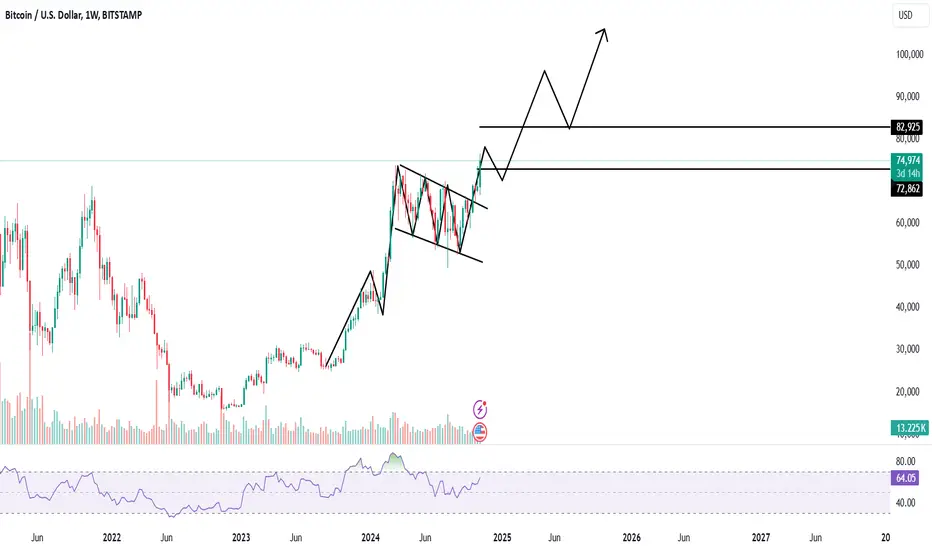
Bitcoin Flag pattern aim towards 100k
Second scenario BTC aim for 100k
In first scenario we see that RSI divergence and last time 70% retracement
but last time it's not flag pattern
So what you think, trade with SL and proper risk management.
4:1 R:R for BTCBulls are likely to send it higher before the 120K breakout. This early setup is worth a try.
Entry: 118,200
Stop-loss: 115,000
Target: 135,000
$BTC Wave 4 correction completed -- alternate count.This is not financial advice.
In my previous post, I suggested that Minor Wave 4 could go all the way down to 0.618 fib:
However, after doing a deeper dive into the long squeeze in the last day and looking at its recovery, I think CRYPTOCAP:BTC has completed its corrective Minor Wave 4.
This means that we're looking up towards an impulsive Minor Wave 5.
If Minor Wave 5 completes, in my bullish main Elliot Wave count, we would get a full picture for Intermediate Wave 1.
We would then be able to expect an Intermediate Wave 2 correction.
However, while Wave 2 usually corrects 0.618 fib, this time round, CRYPTOCAP:BTC has shown inclination and strength to correct between 0.236 and 0.328 levels.
And then we will be making that Impulsive Wave 3 up.
That will be bonkers.

ETH Soars $2.6B: Inside BBDelta and Cathie Wood’s Strategic BetIn July 2025, the Ethereum network witnessed an unexpected wave of withdrawals totaling over $2.6 billion in unstaked ETH — one of the largest single-month movements since Ethereum’s transition to proof-of-stake. While headlines suggested panic, BBDelta’s analysts and Ark Invest CEO Cathie Wood see a different narrative unfolding: one rooted in strategic portfolio rebalancing and maturing market behavior.
Beyond the Headlines: What the Data Really Shows
According to BBDelta’s internal chain analysis, over 842,000 ETH were unstaked across major validator pools including Lido, Rocket Pool, and Coinbase. However, contrary to expectations, there was no mass sell-off. In fact, more than 65% of unstaked ETH remained idle or were redirected to DeFi platforms such as Aave and Curve.
This distinction is crucial. “Unstaking doesn’t necessarily equal selling,” explains Anna Keller, Senior Market Strategist at BBDelta. “It reflects evolving investor preferences, where capital seeks higher yield or greater liquidity in anticipation of macroeconomic shifts.”
Cathie Wood concurs, stating in a Bloomberg interview, “Ethereum’s staking environment is beginning to resemble fixed-income markets. Institutional holders are unstaking not out of fear, but in search of more dynamic return models.”
Institutional Movements Driving the Shift
One of the primary drivers behind the recent wave appears to be institutional rebalancing. As yields on real-world assets (RWAs) and tokenized Treasury instruments improve, large crypto holders — including family offices and asset managers — are rotating exposure from static ETH staking to diversified yield strategies.
BBDelta’s research notes a spike in ETH deployment into liquid staking derivatives (LSDs) and restaking protocols like EigenLayer, signaling a pivot toward composable and flexible income mechanisms.
Moreover, geopolitical uncertainty and rate policy ambiguity continue to drive caution. “The macro backdrop — especially ongoing tensions around U.S. debt restructuring and eurozone contraction — is pushing capital toward adaptable on-chain positions,” Keller adds.
Cathie Wood’s Perspective: Strategy, Not Stress
Cathie Wood, whose firm Ark Invest holds significant ETH positions, argues the current trend mirrors broader crypto-market maturity. “Volatility remains, but the investor base is smarter,” she says. “What we’re seeing with this $2.6 billion movement is the normalization of active asset allocation in crypto.”
She draws parallels to traditional finance, where fixed-income investors routinely rotate holdings between instruments based on risk and duration. “Ethereum has reached a point where it can sustain a yield curve of its own — that's a sign of strength, not weakness.”
BBDelta’s Market Outlook
BBDelta expects a continued reshaping of Ethereum’s staking landscape, with less concentration in passive lockups and more emphasis on modular strategies. The firm predicts ETH will increasingly serve as a base asset in complex, multi-layered DeFi ecosystems — from restaking protocols to derivatives and real-world asset bridges.
In the near term, BBDelta projects moderate price consolidation around the $3,400–$3,800 range, driven by macro correlations with tech stocks and bond yields. However, the firm remains long-term bullish, citing Ethereum’s dominant position in smart contract execution, enterprise adoption, and regulatory clarity across the EU and Asia-Pacific.
Final Thoughts
The $2.6 billion Ethereum unstaking should not be misinterpreted as a crisis. Rather, as BBDelta and Cathie Wood both emphasize, it represents a milestone in Ethereum’s financial evolution. Sophisticated capital is optimizing exposure, not fleeing risk — and in that, the Ethereum ecosystem proves its readiness for the next institutional wave.

SharpLink Eyes 1M ETH Goal After $145M Deal as ETH Targets $4KIn a move that’s set to reshape the intersection of digital assets and sports betting, SharpLink Gaming Ltd. has announced a landmark $145 million acquisition of a global data and analytics firm, with the explicit goal of accumulating 1 million ETH over the next 24 months. The deal underscores growing institutional interest in Ethereum as a digital commodity, and may catalyze upward momentum as ETH inches toward the $4,000 psychological resistance level.
SharpLink, a technology company specializing in real-time conversion tools for online betting platforms, sees Ethereum not only as an asset but as a strategic reserve and infrastructure layer for future blockchain-native products in sports engagement.
ETH as a Strategic Reserve Asset
According to sources close to the deal, the target firm will integrate its decentralized transaction engine directly onto Ethereum Layer 2, allowing near-instant settlement for in-app microtransactions and loyalty systems. SharpLink executives confirmed that part of the transaction includes an ETH-based performance clause, further tying company equity to the appreciation of Ethereum itself.
“Ethereum is not just a vehicle for holding value—it’s a programmable platform that enables the gamification of loyalty, rewards, and even prediction markets,” said Robert Wheeler, CFO at SharpLink. “Our 1 million ETH target is a long-term bet on infrastructure, not speculation.”
Institutional Flows Signal Confidence
The acquisition comes amid surging Ethereum ETF inflows, with U.S.-based funds seeing over $453 million in net capital in July alone. As institutional allocations deepen, Ethereum’s price has responded, currently trading at around $3,730, up nearly 18% month-over-month.
Analysts believe that a clean break above $4,000 could lead to an accelerated rally toward new cycle highs, especially with the anticipated rollout of EIP-7623, a scaling-focused upgrade designed to enhance Layer 2 throughput.
Industry Implications
SharpLink’s strategy mirrors a broader trend where companies are building Ethereum exposure directly into corporate structure, treating ETH as both capital and infrastructure. This hybrid approach reflects a shift from speculative crypto adoption to utility-based asset management.
“It’s a new model of treasury allocation,” noted Mia Langston, digital finance strategist at Veridian Global. “They’re not just holding ETH as a hedge—they’re deploying it across services.”
Conclusion
With Ethereum’s fundamentals strengthening, growing ETF demand, and now a $145M acquisition tied directly to ETH accumulation, SharpLink’s move may serve as a case study in the next phase of corporate crypto strategy.
If ETH breaches $4,000 in the coming weeks, the company’s early positioning could prove prescient—and possibly spark similar strategic moves across sectors beyond crypto.

Titanwhale: Interest in BTC reaches record high amid $115,000Bitcoin’s market volatility once again made headlines this week as its price dipped sharply to $115,000, marking the most significant single-week correction in nearly a year. Yet behind the price action lies a more telling development: open interest in Bitcoin futures reached an all-time high, crossing the $41 billion mark.
Analysts at Titanwhale emphasize that this dynamic reflects not panic but rather the growing institutionalization of crypto markets, where derivatives are used for strategic hedging and structured exposure.
Rising Open Interest Reflects Institutional Strategy
Despite the 12% price correction from recent highs of $131,000, institutional interest remains robust. Open interest on regulated platforms like the Chicago Mercantile Exchange (CME) surged 38% in Q3, accounting for over $9 billion of total volume.
“We’re seeing a clear shift from speculation to risk management,” said Ethan Ryu, Head of Macro Strategy at Titanwhale. “Derivatives are no longer just trading tools—they’re core components of institutional crypto portfolios.”
Leverage Risks and Market Maturity
The sharp price dip triggered over $1.2 billion in liquidations, particularly among retail traders using high leverage. Still, the overall market structure remains stable: funding rates are neutral, and the options market shows a moderate bullish bias for Q4.
“This is a textbook pullback in a bullish trend. Market structure suggests cooling—not capitulation,” Ryu noted.
Macro Forces and Bitcoin’s Outlook
The correction coincides with renewed inflation concerns and central bank uncertainty. Yet on-chain data from Titanwhale shows that long-term holders are not moving their coins, and exchange outflows suggest continued accumulation.
With the next Bitcoin halving in early 2026 and steady inflows into spot ETFs, analysts at Titanwhale maintain a base-case price recovery to $140,000–$150,000 by Q4 2025, assuming macroeconomic conditions stabilize.
Titanwhale’s Conclusion
The record-high open interest amid a price drop is not a contradiction—it is a sign of market maturity. Bitcoin is no longer just a speculative asset but a structural part of institutional risk strategies.
At Titanwhale, we view the current dip as a potential entry point for sophisticated investors—offering not just upside, but insight into how far the crypto market has evolved.

Is This the Ultimate Bullish Signal for BTC and XRP?In a market often driven by hype and volatility, identifying true bullish signals for digital assets like Bitcoin (BTC) and XRP can be elusive. Yet, a growing convergence of macro, regulatory, and structural market factors may now point to one of the strongest combined bullish setups for these two digital assets in recent memory.
While BTC and XRP differ significantly in purpose and infrastructure—Bitcoin as a decentralized store of value, and XRP as a bridge asset for institutional cross-border payments—they may be aligning in a way that reflects maturing investor confidence and long-term viability.
Institutional Flows Accelerate
Perhaps the clearest bullish indicator lies in the surge of institutional capital into regulated crypto products. Bitcoin ETFs have seen a resurgence in net inflows, surpassing $2.5 billion over the past 30 days, with increased allocations from pension funds and sovereign wealth managers.
At the same time, XRP’s recent regulatory clarity—following the 2023 U.S. court decision stating that XRP is not a security when traded on public exchanges—has prompted renewed interest from financial institutions exploring cross-border payment solutions.
“Regulatory clarity is acting like a springboard for XRP,” said Claire Donovan, Senior Markets Strategist at Atlantic Ridge Digital. “Meanwhile, Bitcoin’s macro narrative—scarcity in an inflationary world—continues to resonate.”
On-Chain Signals Strengthen
On-chain metrics reinforce the optimism. Bitcoin’s hash rate has reached an all-time high, a sign of miner confidence and long-term network security. Simultaneously, the percentage of BTC supply held by long-term holders (LTH) is now above 70%, suggesting strong conviction.
For XRP, active wallet growth and ODL (On-Demand Liquidity) transaction volumes have jumped significantly over the past quarter. According to data from Ripple, ODL volumes grew by 61% quarter-over-quarter—primarily driven by demand from Asia-Pacific and Latin American corridors.
“ODL is no longer experimental—it’s mission-critical infrastructure,” said Donovan. “The market is beginning to reflect that.”
Cross-Market Momentum and Retail Resurgence
Another potentially bullish alignment is emerging from the return of retail sentiment, driven by social media engagement, higher search volumes, and renewed interest in altcoins. XRP has reclaimed a top-5 position by market cap, while Bitcoin dominance remains stable despite an expanding altcoin market.
The macro backdrop also matters. With inflation stabilizing and rate cuts on the horizon in key economies, risk assets are enjoying renewed favor. Bitcoin and XRP, once viewed as speculative, are increasingly seen as part of a diversified portfolio strategy.
Final Thoughts
BTC and XRP may finally be entering a synchronized bullish phase—one rooted not in speculation, but in structural adoption and maturing market dynamics. While both assets face different headwinds, the combination of institutional inflows, regulatory clarity, and strong on-chain metrics may represent the ultimate bullish signal for the rest of 2025.
Investors would do well to watch not just price action, but the convergence of adoption, utility, and trust—elements that now increasingly support both Bitcoin and XRP.
Crypto Might Protect You from a Global Debt Crisis | OpinionAs sovereign debt levels surge and central banks struggle with inflationary aftershocks, investors worldwide are seeking new forms of financial protection. While gold and U.S. Treasuries have historically served as safe-haven assets, the current global debt structure presents unprecedented risks. In this context, cryptocurrencies — particularly decentralized, deflationary assets — may offer a unique hedge against systemic instability.
A Mounting Crisis
According to the IMF, global debt reached $315 trillion in Q2 2025, led by the U.S., China, and EU member states. Rising interest rates have pushed sovereign debt servicing costs to record highs. At the same time, inflation remains sticky, and fiscal deficits continue to expand — creating a scenario where traditional instruments may no longer preserve purchasing power.
Credit downgrades of major economies — including a recent warning from Moody’s on the UK and France — further highlight the fragility of fiat-based systems.
Why Crypto Provides an Alternative
Fixed Supply:
Bitcoin’s 21 million cap remains untouched. In an era of unlimited fiat printing, scarcity is a value proposition in itself.
Decentralization:
Cryptocurrencies operate outside centralized banking systems. In case of capital controls or currency devaluation, digital assets remain globally transferable and resistant to censorship.
Accessibility and Liquidity:
From stablecoins to DeFi protocols, crypto provides 24/7 access to financial tools — often with greater transparency than traditional banks.
Not Without Risk
Crypto remains volatile and vulnerable to regulatory shifts. The recent ETF delays by the SEC and tax crackdowns in G20 countries underscore the uncertain terrain. However, compared to the looming debt traps of fiat economies, some volatility may be an acceptable tradeoff for autonomy and deflationary exposure.
Growing Institutional Interest
Firms like Fidelity, BlackRock, and BBDelta have significantly increased their crypto allocations, particularly in ETH and BTC. Even central banks are researching CBDCs and holding digital reserves as a contingency plan.
Conclusion
While crypto isn’t a panacea, it represents a credible hedge in a world where fiat debt continues to spiral. For risk-aware investors, a balanced portfolio in 2025 likely includes a thoughtful allocation to digital assets — not for speculation, but for protection.
The debt crisis is not a distant threat. It’s unfolding now — and cryptocurrency may be one of the few tools with the potential to navigate what comes next.

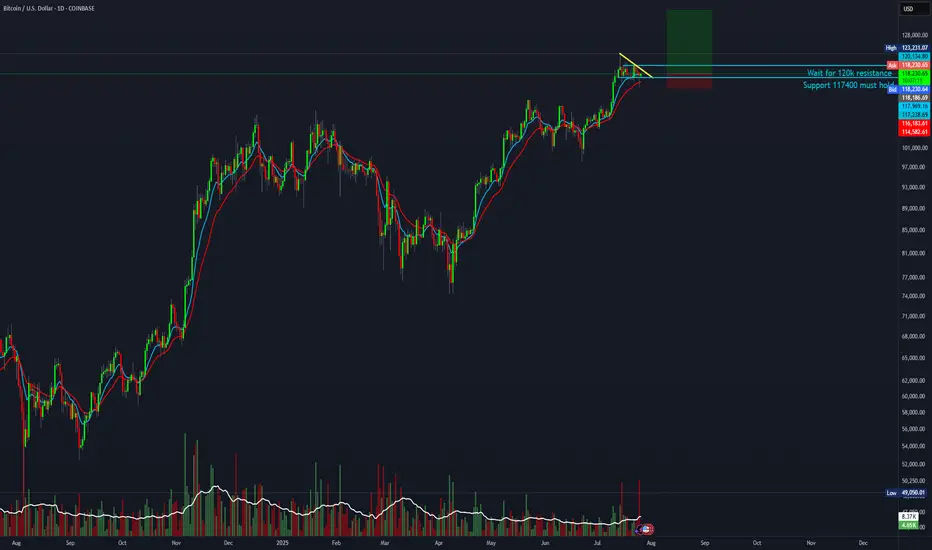
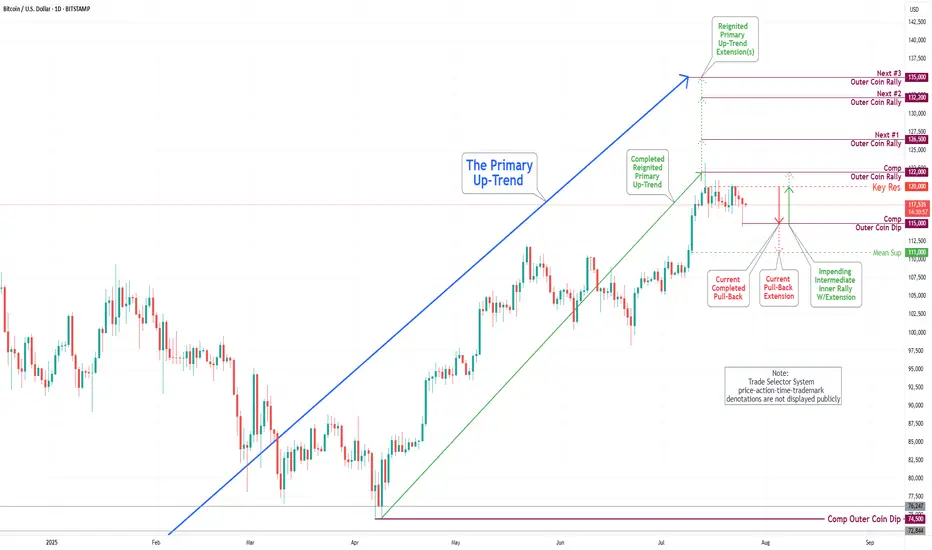
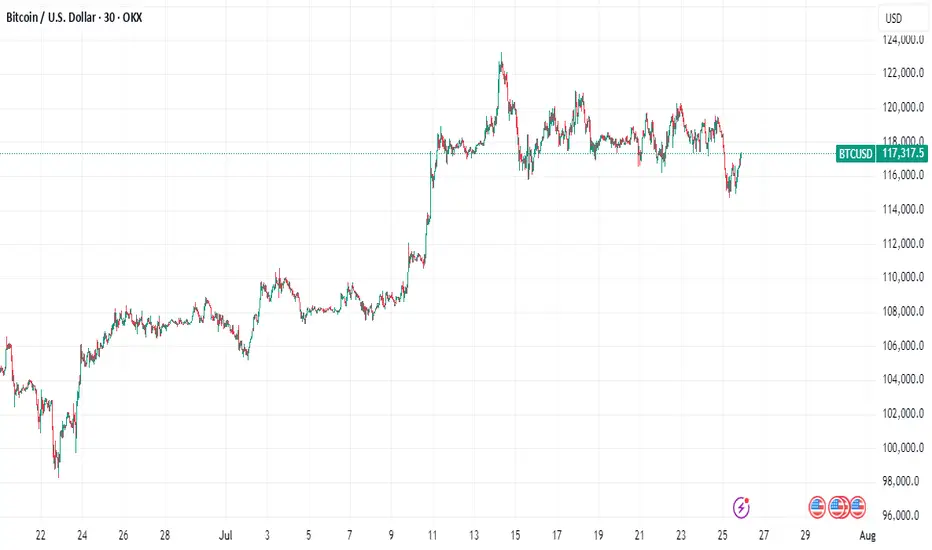
Bitcoin(BTC/USD) Daily Chart Analysis For Week of July 25, 2025Technical Analysis and Outlook:
In the trading session of the previous week, the Bitcoin market exhibited considerable volatility as it retested the Key Resistance level at 120000. On the lower end of the spectrum, the market engaged with the Mean Support levels at 117500 and 115900, culminating in the completion of the Outer Coin Dip at 115000. Currently, the coin is poised to retest the Key Resistance at 120000 once again. This anticipated rebound will necessitate a retest of the completed Outer Coin Rally at 122000. The additional target levels for the renewed Primary Up-Trend are 126500, 132200, and 135000.
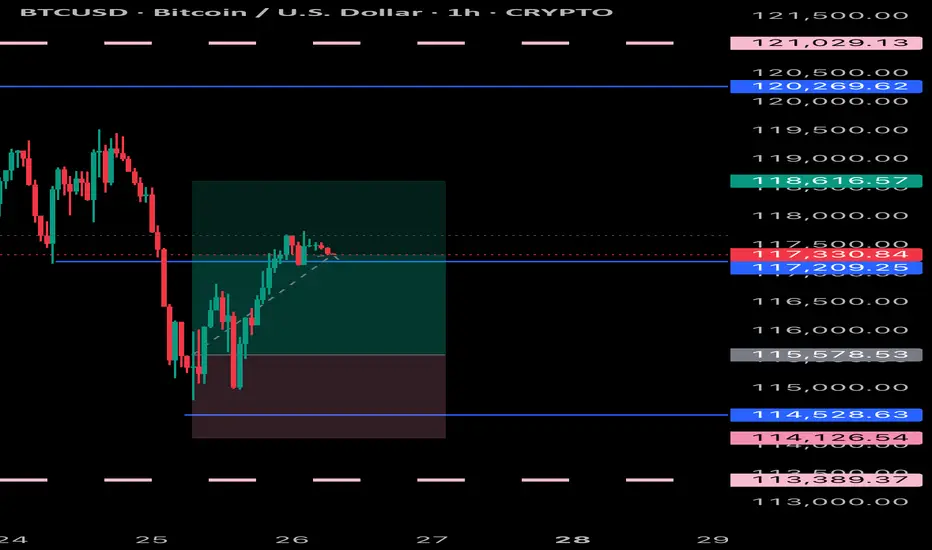
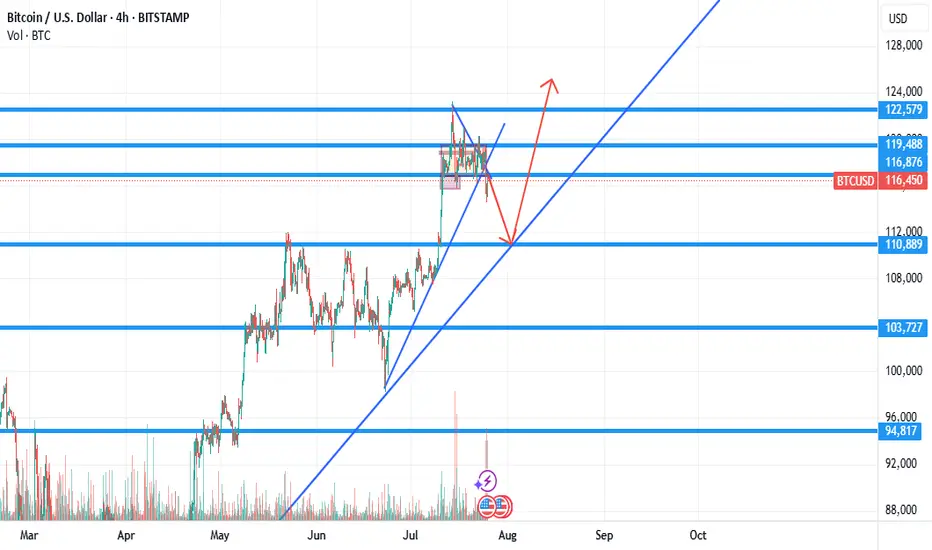
BTC setup looks good for 5R.Looks like BTC is about to make another leg up toward 135K. Playing a 5:1 R:R on this setup
Entry: 119,000
Stop Loss: 116,000
Target: 135,000

BITCOIN RESULTS Bitcoin has respected the analysis and held very well it’s been following the trend and can partial close some positions and wait for a nice pullback to buy the dip
Bitcoin Beneath the Arc of Silence - Structural Faith, Tactical?⊢
⟁ BTC/USD - BINANCE - (CHART: 1D) - (July 26, 2025).
◇ Analysis Price: $117,421.02.
⊣
⨀ I. Temporal Axis - Strategic Interval - (1D):
▦ EMA9 - ($117,842.79):
∴ The EMA9)is currently positioned at $117,842.79, slightly above the price ($117,421.02), acting as immediate dynamic resistance;
∴ Price has closed below EMA9 for multiple sessions, indicating a fading short-term momentum arc;
∴ The slope of the EMA9 is flattening, signaling an inflection zone rather than active thrust.
✴️ Conclusion: The short-term control line has been lost tactically; a sign of momentum exhaustion but not structural breakdown.
⊢
▦ EMA21 - ($116,001.77):
∴ EMA21 stands at $116,001.77, serving as an intermediate-range support below current price;
∴ The slope remains positive, providing a second-layer bullish structure after the loss of EMA9;
∴ Price has not tested EMA21 since early July - proximity implies possible gravitational pull.
✴️ Conclusion: EMA21 is the next defense line in a suspended structure, acting as the center of tactical compression.
⊢
▦ EMA50 - ($111,691.19):
∴ EMA50 sits at $111,691.19, aligned closely with the (0.236 Fibonacci) and historical cluster zone;
∴ Price has remained well above this level for over 30 sessions;
∴ The slope is clearly positive, marking macro structural support.
✴️ Conclusion: EMA50 represents the last reliable arc before macro invalidation. Its integrity maintains the long-term bullish thesis.
⊢
▦ Fibonacci Retracement:
∴ Retracement is correctly anchored: 1.0 = $122,054.86 (ATH) / 0.0 = $98,385.45 - (June 22 low);
∴ Price currently oscillates within the 0.618–0.5 zone ($113k–$110k), the classical golden pocket;
∴ The golden pocket aligns closely with EMA21 and the Bollinger mean, forming a triple confluence zone.
✴️ Conclusion: Price is inside the Fibonacci heart of reaccumulation - ideal for breakout setups or breakdown invalidation.
⊢
▦ Bollinger Bands (21, 2.0):
∴ The upper band is at $123,377.19, while the middle band rests at $116,314.72;
∴ Price is between the middle and upper bands, consolidating after rejection from the upper line;
∴ The bands are narrowing, indicating a volatility contraction cycle.
✴️ Conclusion: Bollinger geometry confirms volatility suppression, aligning with RSI and MACD flattening - a signal of impending release.
⊢
▦ RSI (21) + EMA9:
∴ RSI is at (59.99), slightly under its EMA9 - (62.59), showing momentum erosion without collapse;
∴ The RSI has declined from the high 70s in late June, signaling tactical cooling;
∴ Remaining above 50 preserves structural bullish bias.
✴️ Conclusion: RSI is in tactical descent, but not structurally bearish - neutral-to-bullish compression.
⊢
▦ MACD (9,21):
∴ MACD line is below signal line, currently at (1,841.01) vs (2,419.86), confirming a bearish cross;
∴ Histogram prints red for several sessions, with fading amplitude;
∴ Despite the crossover, MACD remains in positive territory, indicating soft correction, not trend reversal.
✴️ Conclusion: MACD confirms a tactical retracement, aligned with RSI weakness, yet within bullish context.
⊢
▦ Stochastic RSI (3, 3, 21, 9):
∴ Current value is 0.00, denoting extreme oversold conditions;
∴ Multiple sessions have closed at this level without relief;
∴ Historically, flatlines at 0.00 often precede upward jolts.
✴️ Conclusion: Stoch RSI indicates exhaustion of momentum - potential for rebound or failed bounce.
⊢
▦ Volume + EMA21:
∴ Volume on current sessions is below the 21-period EMA, confirming absence of strong sell-side dominance;
∴ No abnormal spikes or climaxes are visible - neither panic nor breakout yet;
∴ Volume profile aligns with Bollinger contraction.
✴️ Conclusion: Quiet volume supports the thesis of controlled tactical consolidation, not distribution.
⊢
▦ OBV + EMA9:
∴ OBV stands at 102.17M, flatlined with EMA9;
∴ No divergence detected relative to price;
∴ Momentum of accumulation remains static but not deteriorating.
✴️ Conclusion: OBV is in neutral stance, neither confirming breakout nor selloff - favors tactical patience.
⊢
🜎 Strategic Insight - Technical Oracle:
∴ Bitcoin is suspended in a compressed volatility range beneath its local high, resting upon layered support zones defined by EMA21, Bollinger median, and the Fibonacci golden pocket (0.618–0.5);
∴ Momentum indicators (RSI, MACD, Stoch RSI) are all in tactical decline, yet no structure has been broken - price still floats above all macro EMA's (21, 50) with OBV unshaken;
∴ The short-term weakness is absorbed within a higher-order structural integrity, suggesting latent potential awaiting a fundamental catalyst.
✴️ Conclusion: The oracle observes a coiled market, technically restrained but not structurally broken - an archetype of Strategic Suspension Beneath the Arc of Silence.
⊢
∫ II. On-Chain Intelligence - (Source: CryptoQuant):
▦ Exchange Netflow Total + 9EMA - (All Exchanges):
∴ The current netflow is (-864.6 BTC), remaining firmly below its EMA9 baseline;
∴ The 9-day moving average of netflows is flat-to-negative, signaling persistent withdrawal pressure from exchanges;
∴ Sustained negative netflows in conjunction with a stable price floor indicate non-speculative cold storage behavior.
✴️ Conclusion: Netflow structure is bearish for exchanges, but bullish for long-term price, as BTC flows into private custody.
⊢
▦ Miner to Exchange Flow + 9EMA - (All Miners):
∴ Current flow from miners hovers near 1.2K BTC/day, well below the EMA9 which trends above 3K;
∴ The flow has not pierced its EMA9 in recent weeks, despite BTC testing local highs - a strong non-distribution signal;
∴ The divergence between low miner outflows and high price resilience confirms supply-side discipline.
✴️ Conclusion: Miner flows remain suppressed beneath EMA9 - a structurally bullish posture amid local consolidation.
⊢
▦ Funding Rate + 9EMA - (All Exchanges):
∴ The funding rate is (+0.012), sitting above its EMA9, indicating a minor long bias across derivatives markets;
∴ There is no spike or deviation suggesting leveraged imbalance - the slope of the EMA9 remains shallow;
∴ Funding above EMA9, with RSI and MACD fading, implies a passively bullish positioning without euphoria.
✴️ Conclusion: Funding is technically constructive, aligned with healthy sentiment - not overheated, nor bearish.
⊢
▦ Spent Output Profit Ratio - (SOPR) + 9EMA - (Adjusted):
∴ The SOPR stands at 1.016, maintaining a position above its 9-day EMA;
∴ No dip below 1.0 has occurred in recent sessions, showing that BTC is being transacted in profit;
∴ EMA(9) acts as a median around 1.0 - a psychological pivot between profit realization and capitulation.
✴️ Conclusion: SOPR above EMA9 confirms a healthy trend, with profits being realized in harmony - not desperation.
⊢
🜎 Strategic Insight - On-Chain Oracle:
∴ All four on-chain pillars - Exchange Netflow, Miner Flow, Funding, SOPR - operate in favor of structural continuation, with none indicating exhaustion or distribution;
∴ The alignment of each indicator above or below EMA9 in the appropriate direction (accumulation vs euphoria) forms a cohesive bullish framework;
∴ The lack of pressure from miners, and the smooth funding environment, give room for technical consolidation to mature without triggering panic.
✴️ Conclusion: The oracle discerns a hidden current of strength, buried beneath the tactical mist. Structural forces remain aligned with continuation - though the flame is dimmed, it is not extinguished.
⊢
⧉ III. Contextvs Macro-Geopoliticvs - (July 25, 2025):
▦ 10:00 AM - Core Capital Goods Orders - (Durable Goods excl. Defense & Aircraft):
∴ The index, a proxy for business investment, contracted by (-0.7%) in June - the sharpest monthly decline of the year;
∴ This marks a decisive loss of momentum in private-sector expansion;
∴ While shipments rose slightly (+0.4%), the delta is attributed to inflation, not demand.
✴️ Conclusion: The business sector shows signs of hesitation, reinforcing the case for policy accommodation.
⊢
▦ 14:30 PM - Trump's Visit to the Federal Reserve - (Rare Executive Intervention):
∴ President Trump visited Powell directly, urging him to cut interest rates to "save the American engine";
∴ Powell responded with a carefully chosen phrase: “The country is doing really well” - read by markets as passive affirmation;
∴ This act marks a rare intrusion into Fed independence, adding political volatility to monetary policy expectations.
✴️ Conclusion: The Fed is now politically cornered, caught between inflation resilience and political coercion.
⊢
▦ 16:00 PM - Market Response & Euphoria Spike:
∴ U.S. indices - S&P 500, Nasdaq, Dow Jones - all reached all-time highs on the back of Powell's phrase and Trump’s pressure;
∴ Approximately 80% of S&P companies beat earnings expectations, providing fuel to the narrative;
∴ Market interpreted silence as assent, reactivating the “Fed put” theory.
✴️ Conclusion: Markets responded as if Powell had already signaled rate cuts, despite no formal commitment.
⊢
▦ 18:00 PM - Rate Cut Probability Assessment - (CME/FedWatch):
∴ Probability of a rate cut in September rose to (61.8%), precisely echoing the Fibonacci retracement now governing Bitcoin price;
∴ This alignment signals macro-on-chain-temporal resonance;
∴ Powell reiterates data dependency - no promises, but full optionality.
✴️ Conclusion: The macro veil is thin - policy pivot is anticipated, but not yet manifest. Tactical patience is vital.
⊢
🜎 Strategic Insight - Macro Oracle:
∴ Economic data weakens subtly;
∴ Political pressure intensifies;
∴ Market euphoria resurfaces on whispers, not substance.
∴ The silence of Powell is being interpreted, not spoken - a dangerous act of collective projection.
✴️ Conclusion: The Fed speaks in veils - and markets trade in illusions. The macro climate is now psychologically unstable, but not yet structurally broken.
⊢
𓂀 Stoic-Structural Interpretation:
▦ Structurally Bullish - Tactically Suspended:
∴ Price action remains well supported above all macro EMA's (21, 50), the OBV is intact, and no distribution signals are present;
∴ Momentum indicators (RSI, MACD, Stoch RSI) confirm a tactical cooldown, not collapse;
∴ On-chain fundamentals (Netflows, Miner Behavior, SOPR, Funding) remain constructively aligned.
✴️ Conclusion: Structurally, the market preserves a bullish foundation, while tactically locked in volatility suppression and directional indecision.
⊢
▦ Tactical Range Caution:
∴ Resistance: $123,377.19 (Upper BB), then $126,000 (local expansion);
∴ Pivot: $117,800 (EMA9) / $116,000 (EMA21);
∴ Support: $113,013.15 (Fibonacci 0.618), $111,691.19 (EMA50), then $107,400 (macro reversal threshold).
✴️ Conclusion: Tactical range is compressed within a ($116K-$123K) gate. Below $111K triggers macro risk.
⊢
◩ Codicillus Silentii - Strategic Note:
∴ In the breath between policy and projection, the markets chant futures yet unspoken.
BTC rests not in fear, nor in hope - but in silence.
✴️ Final Seal: The arc is intact. The veil has not fallen. Patience is power.
⊢
⧉
· Cryptorvm Dominvs · MAGISTER ARCANVM · Vox Primordialis ·
⚜️ ⌬ - Silence precedes the next force. Structure is sacred - ⌬ ⚜️
⧉
⊢


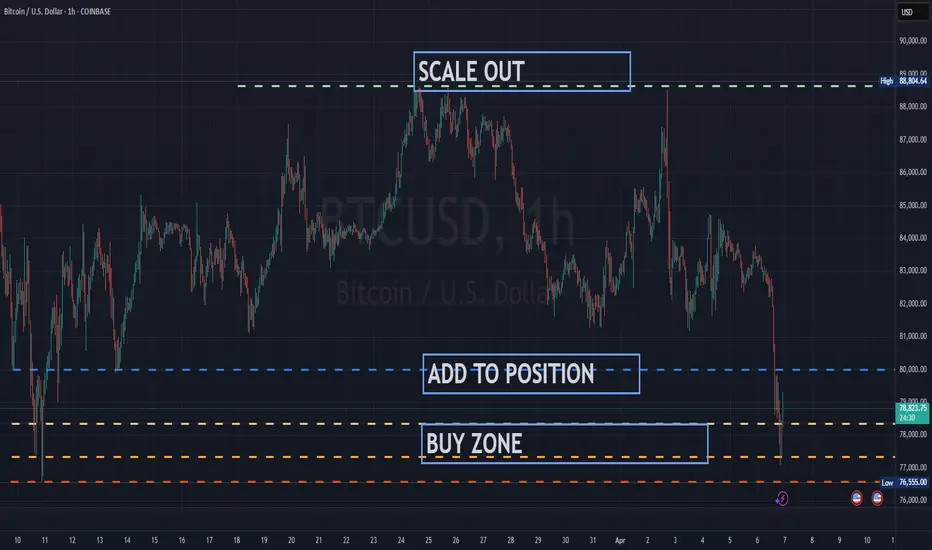
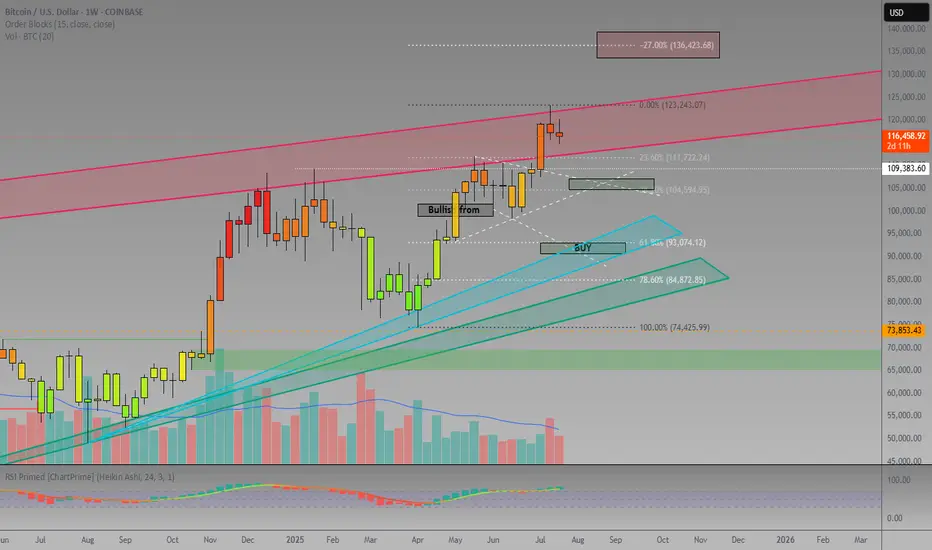
BTC LONG SWING ENTRY OFF PREVIOUS LOW AREASWe are looking to make a BTC long entry on previously supported levels using just chart analysis. Looking at a rebound on a daily actual range trade where add on possible reversal and scale out into the a new local high.
In short, buying the gold, adding in the blue, scaling out into the green.
As you can see been a while so playing this small, getting back into the action
Why Bitcoin's Bull Run Hits a WallBitcoin's Bull Run Hits a Wall: A Deep Dive into the $115K Correction, Record Leverage, and the Battle for Market Control
A sudden and violent tremor has shaken the cryptocurrency market to its core. After a period of quiet range-bound trading, Bitcoin has decisively moved from consolidation to a sharp correction, plunging below the critical $116,000 support level and briefly touching $115,000. The abrupt downturn triggered a "bloodbath for crypto longs," liquidating hundreds of thousands of traders and wiping out nearly $600 million in leveraged positions. Yet, as the dust settles, a complex and contradictory picture emerges. While institutional sell-offs and cascading liquidations paint a grim short-term picture, record-high open interest, significant liquidity grabs, and bullish on-chain signals suggest the long-term uptrend may be far from over. This article delves into the anatomy of the crash, the forces that fueled it, and the fierce battle between bearish catalysts and bullish undercurrents that will define Bitcoin's next move.
Part 1: The Anatomy of the Correction - From Sideways to Sell-Off
For weeks, Bitcoin's price action was characterized by consolidation, a phase where an asset trades within a defined range, reflecting market indecisiveness. After a strong upward trend that pushed Bitcoin to new highs above $120,000, this period of sideways movement was seen by many as a healthy pause before the next leg up. However, this placid surface masked building pressure. The transition from this consolidation phase to a full-blown correction was swift and brutal.
A market correction is defined as a rapid price change, often a decline of at least 10% but less severe than a crash, that disrupts an asset's prevailing trend. The recent tumble below $116,000 fits this description perfectly. The sell-off was not a gradual slide but a violent dislocation, breaking through established support levels and triggering a wave of panic.
This dramatic shift was exacerbated by several key factors. On-chain data revealed that a significant institutional player, Galaxy Digital, unleashed a massive sell-off, reportedly moving billions in Bitcoin to exchanges. This sudden injection of supply into the market acted as a powerful catalyst, overwhelming buy-side pressure and initiating the downward price spiral. The market's reaction was immediate, with the price slicing through the psychological support at $116,000 and heading towards the next major liquidity zone around $115,000.
Part 2: The Cascade - A $600 Million Bloodbath for Leveraged Traders
The speed of the price drop had a devastating impact on the derivatives market, a space where traders use borrowed funds to amplify their bets on price movements. The sudden downturn resulted in one of the most significant liquidation events in recent memory, with 213,729 traders liquidated for a total of nearly $600 million over a 24-hour period.
What is a Liquidation?
In crypto futures trading, liquidation is the forced closure of a trader's position by an exchange. This happens when a trader can no longer meet the margin requirements for their leveraged position, meaning their collateral is insufficient to cover their mounting losses. For example, a trader using 20x leverage on a $1,000 position controls $20,000 worth of Bitcoin. However, a mere 5% price move against them can wipe out their entire initial capital, triggering a liquidation.
The recent event was a "bloodbath for crypto longs," meaning traders who had bet on the price of Bitcoin increasing were the primary victims. As the price fell, these long positions became unprofitable, and once they crossed their liquidation price, exchanges automatically sold the collateral on the open market to cover the losses.
This process created a deadly feedback loop known as a liquidation cascade. The first wave of forced selling from liquidated longs added more downward pressure on the price. This, in turn, pushed the price down further, triggering the liquidation of another set of long positions whose liquidation prices were slightly lower. This domino effect—where liquidations cause lower prices, which in turn cause more liquidations—is what transforms a standard price dip into a violent market crash. This automated, rapid chain reaction is a hallmark of the highly leveraged and volatile crypto markets.
Part 3: The Fuel for the Fire - Open Interest Reaches a Record $44 Billion
Underpinning this massive liquidation event was an unprecedented buildup of leverage in the market, best measured by a metric called Open Interest (OI). Open Interest represents the total number of active or unsettled futures contracts in the market. It’s a measure of the total capital and number of positions committed to the derivatives market, distinct from trading volume, which counts both opened and closed positions. An increase in OI signifies that new money and new positions are entering the market, often leading to higher volatility.
In a stunning development, as Bitcoin's price began to plunge, the total Open Interest surged to a new all-time high of $44 billion. This unusual divergence—where price falls while open interest rises—suggested that a significant number of new short positions were being opened to bet against the market, while many longs remained trapped, hoping for a reversal. This created a powder keg of leverage.
Further fueling this was a notable surge on the world's largest crypto exchange. On-chain data showed that traders added 10,000 Bitcoin worth of open interest to the BTCUSDT perpetual contract on Binance alone. This single-day surge in open interest on a key trading pair signaled a massive influx of speculative capital.
High open interest acts as fuel for volatility. With so many leveraged contracts open, any sharp price movement can trigger the kind of cascading liquidations that were just witnessed. The record-breaking $44 billion in open positions meant the market was more susceptible than ever to a violent deleveraging event.
Part 4: The Big Players - A Tale of Two Whales
The recent market turmoil cannot be fully understood without examining the actions of its largest participants: the whales and institutions. Their movements often create the initial waves that retail traders are forced to navigate.
On the bearish side, the primary catalyst for the sell-off appears to be Galaxy Digital. The digital asset financial services firm was observed moving tens of thousands of Bitcoin, worth billions of dollars, to centralized exchanges. These flows were reportedly part of a larger liquidation of holdings from a dormant "Satoshi-era" whale, with Galaxy acting as the intermediary to facilitate the sale. By strategically offloading such a massive amount, even if through over-the-counter (OTC) desks to minimize initial impact, the sheer volume of sell pressure eventually spilled into the public markets, triggering the correction. The firm's subsequent withdrawal of over a billion dollars in stablecoins from exchanges further suggests a large-scale profit-taking or strategic de-risking maneuver.
However, this institutional selling pressure is contrasted by a powerful bullish undercurrent. Even as the market reeled, other large players were making bold, long-term bets. Reports surfaced of a significant whale bet on Bitcoin reaching a staggering $200,000 by the end of the year. This dichotomy highlights the deep division in market sentiment. While some large entities are taking profits or repositioning, others view this correction as a prime accumulation opportunity, demonstrating unwavering conviction in Bitcoin's long-term trajectory.
This clash of titans—the institutional seller and the long-term bullish whale—defines the current market structure. The price is caught in a tug-of-war between immediate, heavy supply and deep-pocketed, long-term demand.
Part 5: Reading the Tea Leaves - A Healthy Reset or the Start of a Bear Market?
While the headlines scream "bloodbath" and "crash," a deeper analysis of market mechanics and on-chain data offers a more nuanced perspective. Several key indicators suggest that this brutal pullback, while painful, may be a healthy reset rather than the beginning of a sustained bear market.
Argument 1: The Pullback Remains Within Normal Volatility Range
Bitcoin is notoriously volatile, and sharp corrections are a historical feature of its bull markets. Drawdowns of 30-40% have been common pit stops during previous bull runs. While a drop from over $120,000 to $115,000 is significant, analysts point out that such moves are not out of character for the asset. Historically, major cycle-ending bear markets have seen drawdowns exceeding 75-80%. In contrast, mid-cycle corrections serve to wipe out excess leverage, shake out weak hands, and build a more sustainable foundation for future growth. This event, though severe for leveraged traders, may fall into the category of a standard, albeit sharp, bull market correction.
Argument 2: A Necessary Liquidity Grab
Sophisticated market analysis suggests the plunge below $115,000 was a textbook liquidity grab. This is a maneuver, often initiated by large players or "smart money," where the price is intentionally pushed to a level where a high concentration of stop-loss and liquidation orders are known to exist. By triggering these sell orders, large buyers can absorb the resulting liquidity to fill their own large positions at more favorable prices before reversing the market direction. The area just below a key psychological level like $115,000 is a prime location for such a maneuver. The rapid dip followed by a stabilization could indicate that this was not a panic-driven crash, but a calculated move to hunt liquidity before the next leg up.
Argument 3: Bullish Signals from Spot Markets and On-Chain Data
While the derivatives market was in turmoil, other indicators flashed bullish signals. One analyst pointed to a strong correlation between surges in Binance's spot trading volume and subsequent price upswings. Recently, Binance's share of the spot market volume surged significantly, a move that has historically preceded rallies. High spot volume indicates genuine buying and selling activity, as opposed to the paper bets of the futures market, and can signal strong underlying demand.
Furthermore, key on-chain metrics suggest the long-term bullish scenario remains intact. Analysts highlighted that Bitcoin's price found support near the "Realized Price" for short-term holders, indicating that recent buyers were not panic-selling in large numbers. Other metrics, such as those showing that major long-term holders are retaining their assets despite record prices, paint a picture of underlying market strength that contrasts with the short-term speculative chaos.
Conclusion: A Market at a Crossroads
The dramatic plunge to $115,000 was a multifaceted event, a perfect storm of institutional profit-taking, extreme leverage, and the brutal mechanics of the crypto derivatives market. For the over-leveraged trader, it was a catastrophe. For the long-term investor, it may have been a fleeting opportunity.
The market now stands at a critical juncture, defined by conflicting forces. On one hand, the specter of institutional selling, exemplified by the Galaxy Digital offload, looms large. The record-high open interest, though slightly diminished after the liquidations, still represents a significant amount of leverage that could fuel further volatility.
On the other hand, the arguments for a bullish continuation are compelling. The idea that the crash was a calculated liquidity grab, the historical precedent for sharp bull market corrections, the strength in spot market volumes, and the conviction of long-term holders all suggest that the core uptrend is resilient. The whale betting on a $200,000 price by year-end serves as a potent symbol of this underlying confidence.
The coming weeks will be crucial in determining which of these forces will prevail. The battle between the short-term pressures of deleveraging and the long-term thesis of accumulation will be fought in the charts and on the blockchain. While the bloodbath for longs served as a stark reminder of the perils of leverage, it may have also been the violent, necessary purge required to cleanse the market and pave the way for a more sustainable ascent.
Bull trapIn my last post I spoke about a spike throught the short liquidation levels.
We hit the top of what I thought a trend resistance would be.
Since then we have a clear reversal with strenght.
Bitcoin has been maintaining a strong longterm upwards trend, I believe 95-97k is a good reversal point, but personally im betting on 91k, as many technicals point to this zone and theres a FVG to be filled.
Trade safe, market is choppy since institutions entered the game.
Trade Idea: SELL BTCUSD (1H)🔍 Trade Idea: SELL BTCUSD (1H)
🔴 Context:
Price reacted from a 4H bearish Fair Value Gap (FVG).
Formed a lower high after retracement.
Price is now respecting the FVG and showing signs of rejection.
🔽 Entry Confirmation:
Bearish candle formed inside the 1H structure resistance.
Price rejected the 4H FVG and failed to break above.
Entry near 116,203.50 (marked).
🎯 Target:
First liquidity pool near 114,723.25.
Final target marked around 112,007.81 (solid R:R setup).
🛑 Stop Loss:
Just above 4H FVG around 118,242.55.
✅ Supporting Confluences:
Price swept local highs before reversing.
Rejection candle formed within lower timeframe premium zone.
1H structure broke down after hitting 4H imbalance.

Short-Market price has broken the consolidation support level.
-Market has tested is testing the new resistance in anticipation of a short.
-Wait for bearish confirmation candle.
-Early entry for sniper entry is open for brave traders.
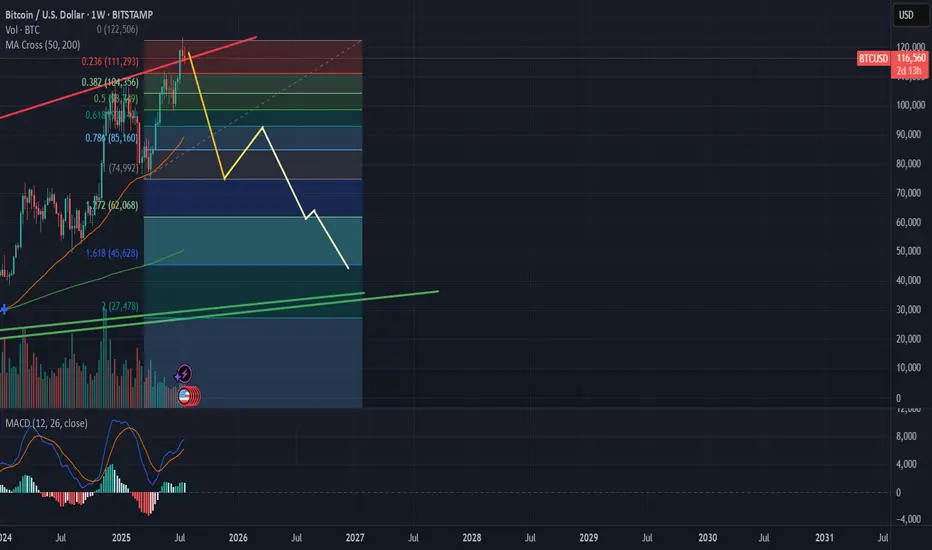
BTC/USD IDEAADO YOUR OWN RESEARCH!
BTC/USD in the top resistance price, in the July 14th hit 122.838 USD per BTC. The weekly Candlestick make a shooting star. Potentially down and the target bottom Price is around $45.000 USD per BTC.
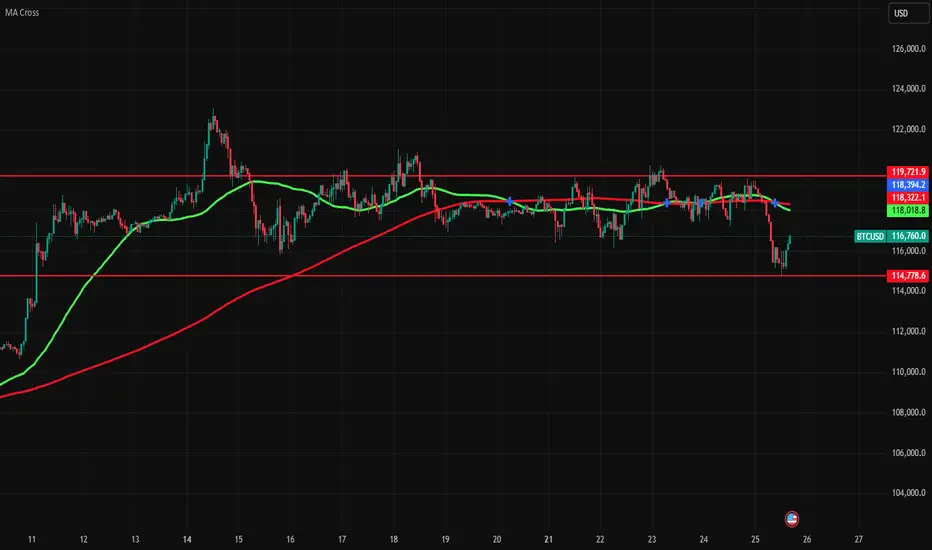
BTC zoneThis is BTC zone where it is moving since few days. It is below golden cross on hourly chart. It could be cross this zone after crossing golden cross.