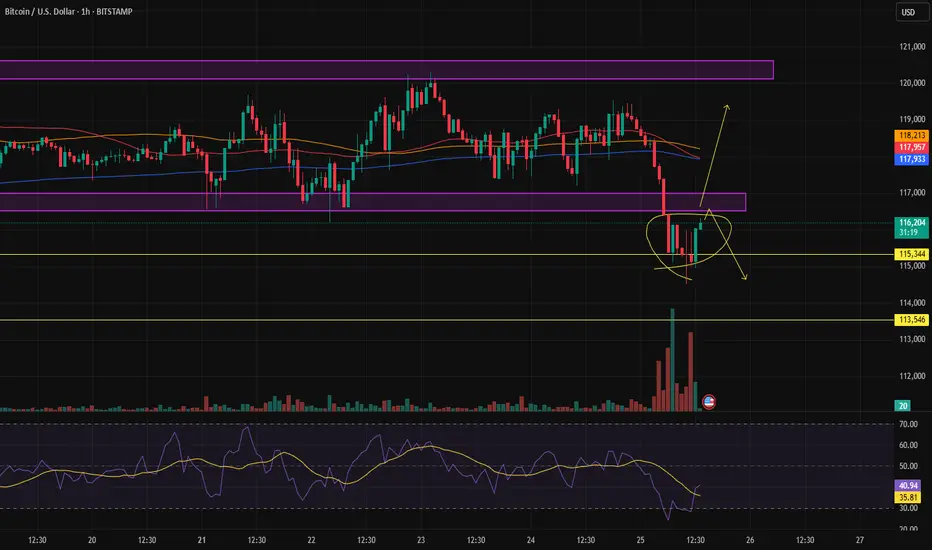
Fakeout or pullback?In my opinion, even though the trend is bullish, short positions are easier to take right now. That’s because on the way up, the price keeps hitting the EMAs, which makes upward movement harder — but on the way down, there’s nothing in its path.
BTCUSD trade ideas
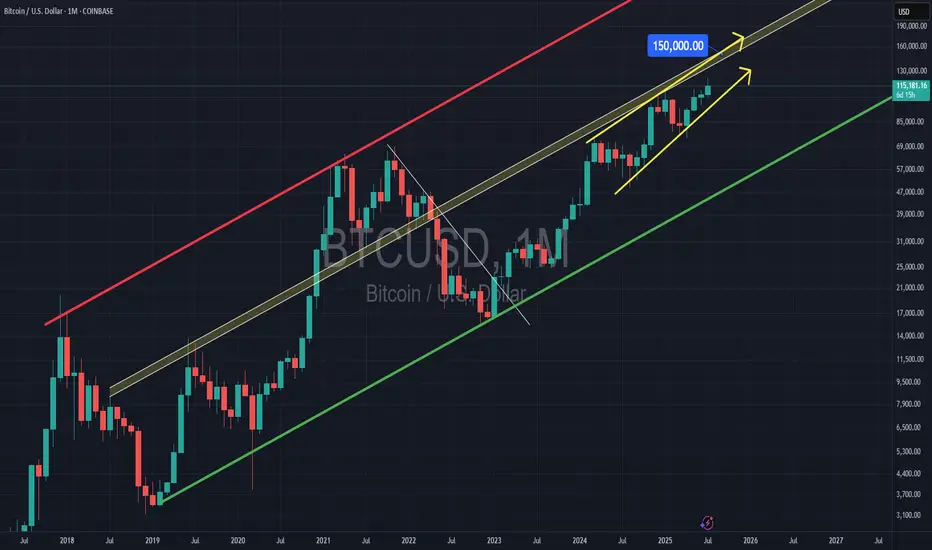
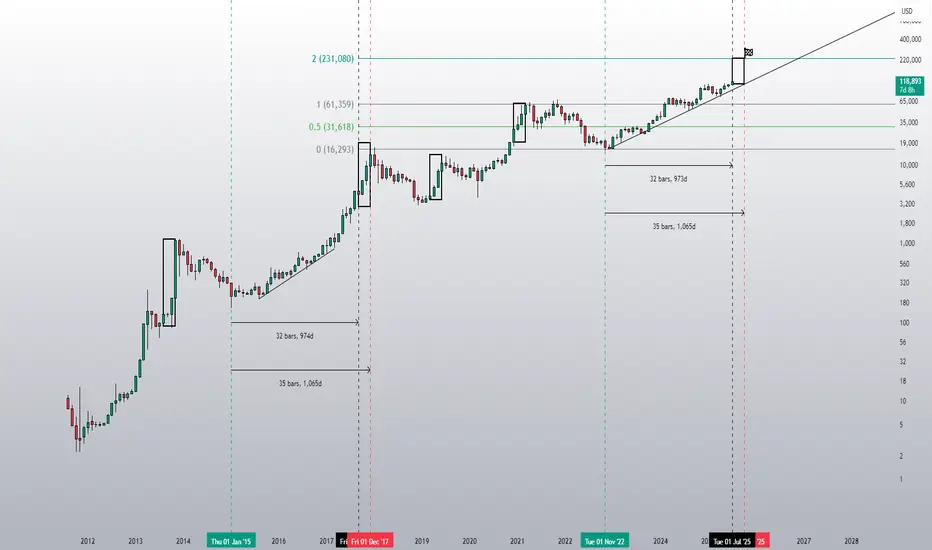
Bitcoin & 150k TOPBitcoin has been trading within a rising channel for a long time, with resistance at $150,000. The middle support/resistance line also indicates $150,000, suggesting a potential significant rejection at this level.
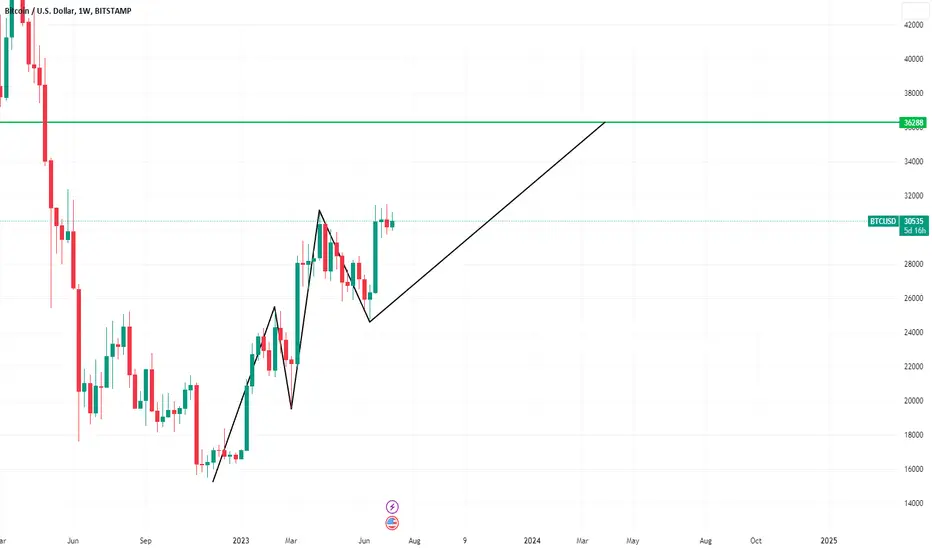
Buy BTCUSD now up trendBuy BTCUSD now up trend and now third swing going on, so expected slow move. but target will reach surely
No title!Strong sells on Bitcoin. I want to see price fill more of the 1W BISI. There's a lot of selling pressure on the 4-hour chart.

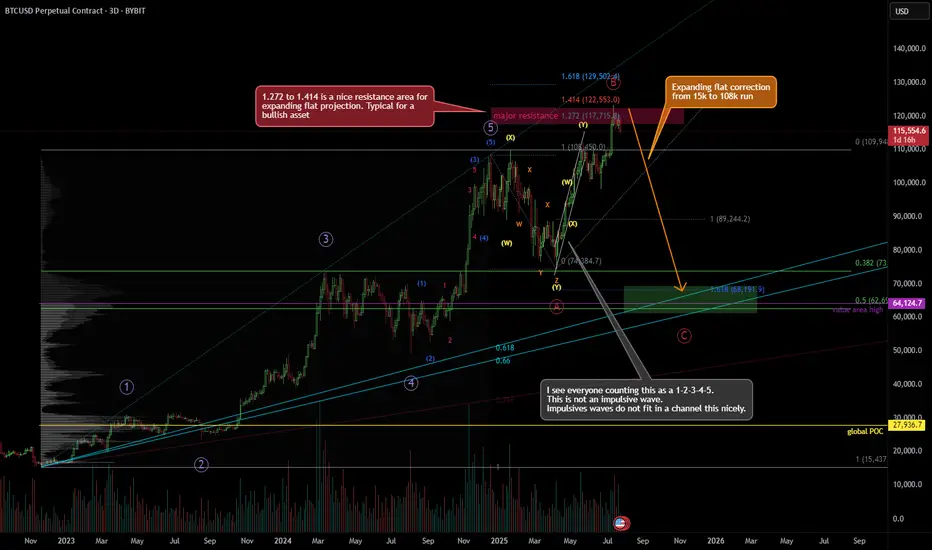
Looking for a correction, bearish Elliott Wave countThere's a probability that the Jan 25' high was the true 5-wave top, and not the Dec 24' top shown here, but because the price difference is barely 1%, the projections don't differ much.
I've long counted the April 25' to June 25' run as a very nice looking WXY. Almost perfect channel correction. A very bullish correction, sure, but still a correction.
And, we're forming an expanding flat from 109k region, down to 74k, then to 123k, and likely down to around 68k.
There's just too many confluences around 67-68k region.
(1) Huge volume node
(2) 1.618 fib projection
(3) 0.5 retracement from 15k to 109k run (2022-2025 run)
(4) Fib fan 0.618 to 0.66 (golden zone)
(5) Value area high of the 15k to 109k run
It's 7/25/25 as of posting this. Locally, in a 15min time-frame, I don't actually see this coming down right away. It's likely to spend few more weeks up here before it starts to make its movement.
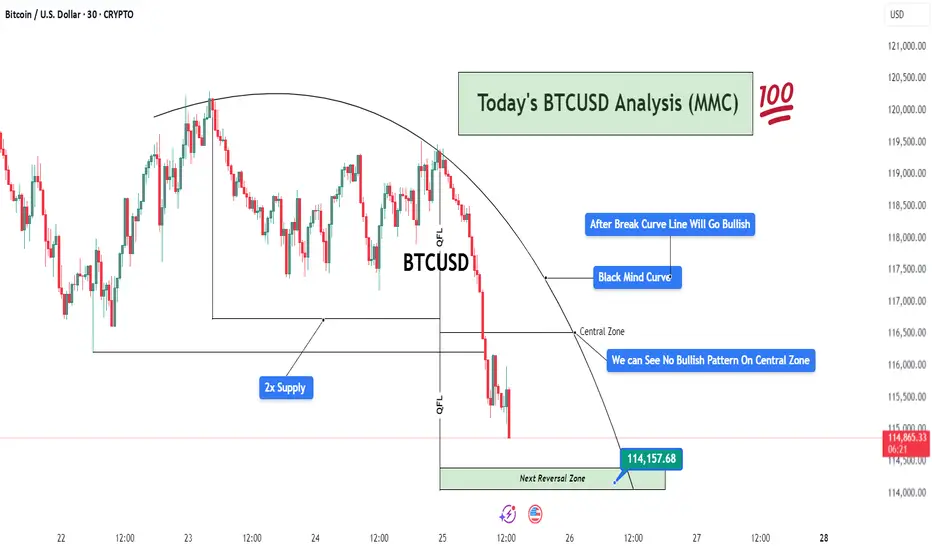
BTCUSD Analysis (MMC) – Bearish Flow Toward Reversal ZoneThis 30-minute BTCUSD chart highlights a well-structured bearish movement following the MMC (Mirror Market Concepts) framework. The analysis centers around the Black Mind Curve, multiple QFL drops, and supply/demand imbalances, presenting a professional outlook on current price action and potential reversals.
🧠 Black Mind Curve – Mapping Market Psychology
The Black Mind Curve is a visual representation of the market’s psychological behavior and serves as a dynamic resistance throughout this structure. Price respected the curvature, slowly losing bullish strength while forming lower highs.
This curve mirrors a distribution phase, where smart money unloads long positions before initiating a downside move.
Your annotation: “After Break Curve Line Will Go Bullish” implies that unless the curve is cleanly broken with strong bullish conviction, the bias remains bearish.
So far, the price is respecting the curve, reinforcing sellers’ control.
🔵 2x Supply Zone – Aggressive Selling Region
The supply zone is tested twice, confirming the presence of institutional-level sellers. This zone becomes critical because:
First touch: Minor reaction, but no follow-through.
Second touch: Strong rejection with extended downside move.
The double rejection clearly shows that buyers are trapped, fueling bearish momentum.
From an MMC view, this confirms the beginning of the “Mirror Market Shift” — where smart money rotates out of longs and traps retail longs near resistance.
📉 QFL (Quick Flip Liquidity) Events – Momentum Crashes
Two major QFL-based breakdowns appear in the chart after price consolidated within ranges. These drops are essential to understand:
QFL reflects market structure breaks where liquidity is engineered, and a sharp sell-off follows.
The first QFL drop occurs after the curve-resistance rejection, and the second confirms continuation.
These are liquidity runs, used to clear stop-losses and maintain bearish pressure.
This creates a domino effect — each QFL level becomes a signal of deeper imbalance.
⚠️ Central Zone – No Bullish Pattern Detected
The Central Zone marks a temporary support or midpoint level — a place where price might find footing if buyers show up.
However, as you noted:
“We Can See No Bullish Pattern On Central Zone”
No bullish engulfing candle.
No pin bar rejection.
No spike in volume.
No market structure shift.
This confirms that buyers are either weak or absent in this zone. MMC traders use this info to stay with the dominant trend (bearish) until proven otherwise.
🟩 Next Reversal Zone – 114,157.68 (Critical Demand Zone)
The green zone marked as “Next Reversal Zone” is a key level to monitor:
This area aligns with historical demand, where BTC previously reversed or slowed down.
Price is likely to hunt liquidity below recent lows before a potential bullish reaction.
It’s a Smart Money zone — designed to trap breakout sellers and absorb volume for a reversal.
Traders should watch for:
Bullish engulfing patterns
Break of structure to the upside
Divergence with RSI/volume
Sweep and reclaim setup
Once the price enters this zone, MMC reversal tactics come into play — buyers may step in aggressively here.
📅 Fundamentals & Timing
At the bottom of the chart, we see upcoming U.S. economic news events, which can act as volatility catalysts. Price could reach the reversal zone just before or during high-impact news, which aligns perfectly with smart money manipulation.
Be cautious of fakeouts around news time.
Confirmation is key before entry.
🧭 Final Outlook & MMC Strategy
Trend Direction: Bearish until 114,157.68 zone is hit.
Momentum Drivers: QFL drops, strong rejection from 2x supply, absence of bullish signals.
Key Watch Level: 114,157.68 – wait for MMC reversal pattern here.
Invalidation: If price breaks and closes above the Black Mind Curve with volume.
📌 Trade Idea Summary (For Caption Use):
BTCUSD respecting MMC Black Mind Curve. 2x Supply Zone triggered QFL breakdowns. No bullish confirmation at Central Zone. Eyes on Next Reversal Block near 114,157.68. Watch for reaction and potential reversal setup. #SmartMoneyMoves
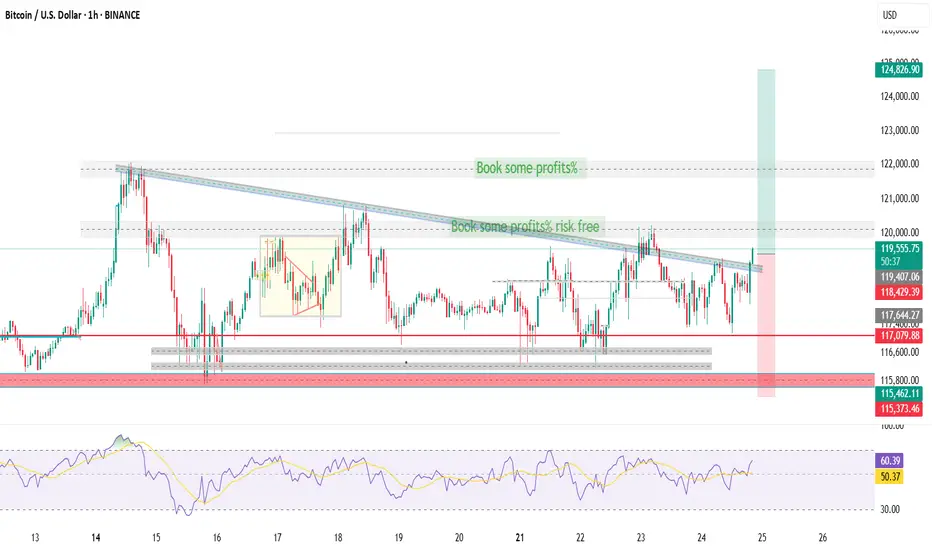
BTCUSD Sell Plan – 1H Chart📉 BTCUSD Sell Plan – 1H Chart
Previous Day High (PDH) has been swept.
A Bearish Fair Value Gap (FVG) has already formed on the H4 timeframe, signaling potential reversal.
Price has been struggling to push higher for several days, indicating exhaustion in bullish momentum.
A Weekly Bullish FVG lies below, acting as a strong magnet—drawing price toward it.
If a pullback occurs, there’s no need to panic. It’s just the market seeking fresh liquidity.
Liquidity is sitting below, making it a high-probability area for the next move down.
🧲 Let the magnet do its job.

BTCUSD: Who caught the bottom of the previous wave?BTCUSD: Who caught the bottom of the previous wave?
.
I’ve said it before, the market only has a few familiar patterns, repeating them over and over to the point of boredom.
.
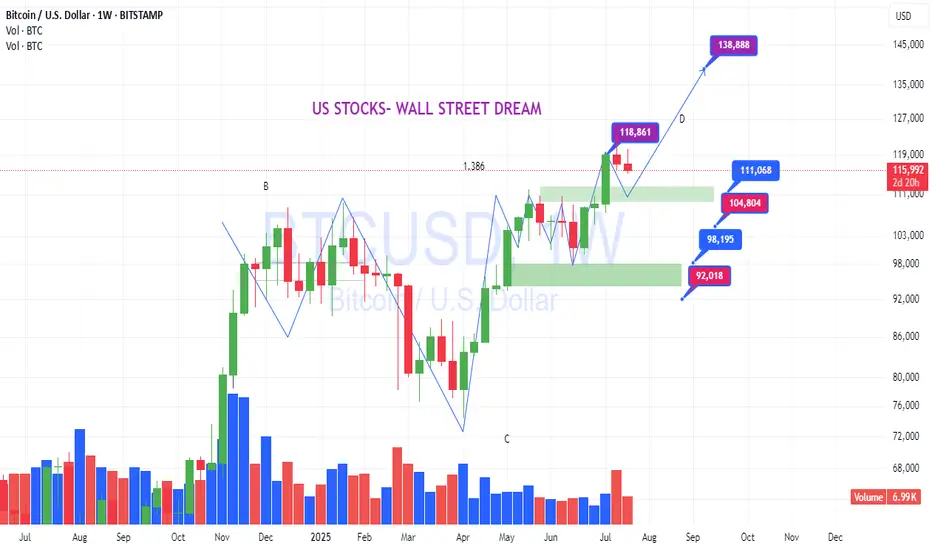
US STOCKS- WALL STREET DREAM- LET'S THE MARKET SPEAK!
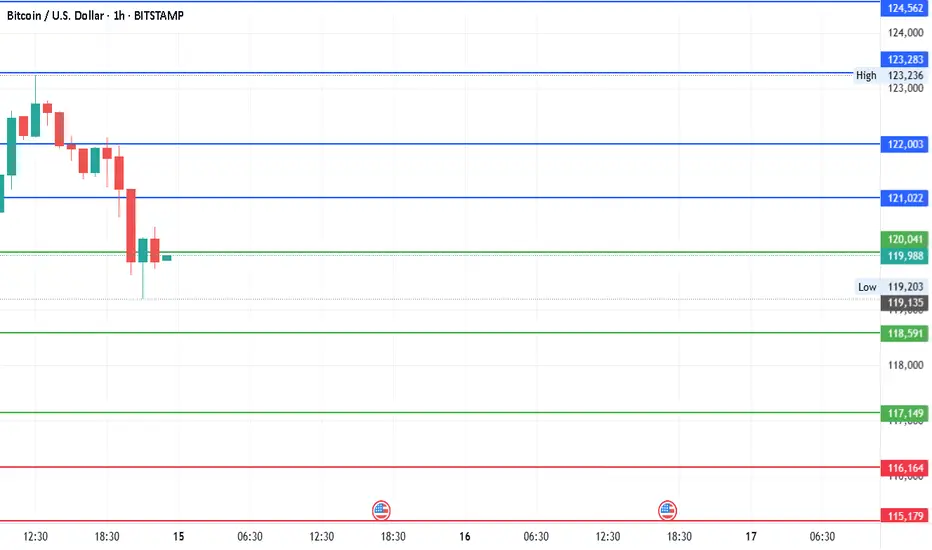
#Bitcoin - Levels to watchDate: 14-07-2025
#Bitcoin
Current Price: 119900
Pivot Point: 118591.00 Support: 117149.31 Resistance: 120041.22
Upside Targets:
Target 1: 121022.11
Target 2: 122003.00
Target 3: 123282.50
Target 4: 124562.00
Downside Targets:
Target 1: 116164.16
Target 2: 115179.00
Target 3: 113899.50
Target 4: 112620.00
#Crypto #Bitcoin #BTC #CryptoTA #TradingView #PivotPoints #SupportResistance
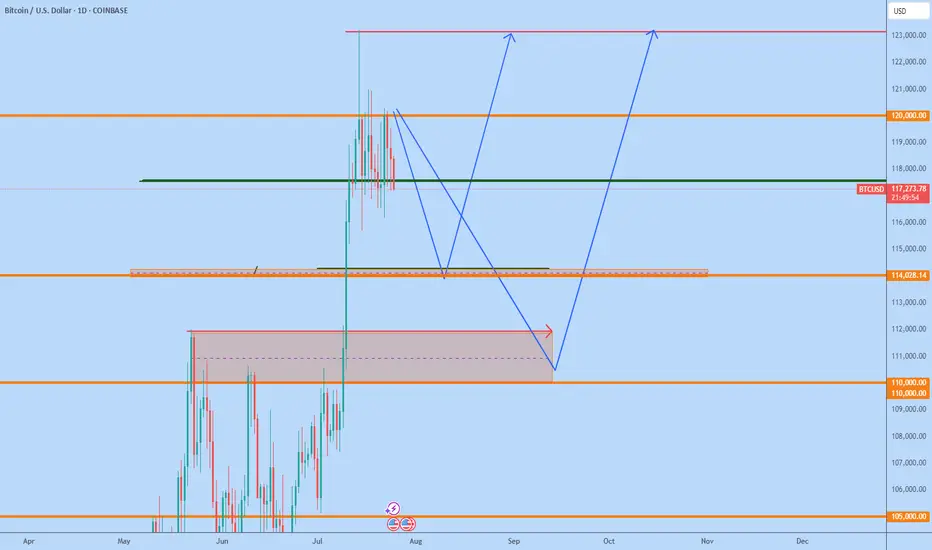
BTC Pullback113,500 and 110,800 are the next two levels to watch for and line up with the .382 and the .5 fib level.
I think there will be more downside before another push to a new ATH.
NFA, do your own DD.
Thanks for viewing.

BTC SETUPBTC is currently on a sell retracement and after this retracement we are expecting a bullish run but before then we will be currently bearish till we see sell exhaustions.
BTCUSD Bullish engulfing
Buy from current price or wait for retest
Bullshlish momentum observed
Mangae risk book partially as metioned or as per your capital
BTCUSD 7/24/2025Come Tap into the mind of SnipeGoat as he gives you a Full Top-Down Analysis of Bitcoins Price Action from the Monthly down to the 30min. To keep you align & aware of what's REALLY going on in the market. Don't believe the hype, we read Candles over here!
_SnipeGoat_
_TheeCandleReadingGURU_
#PriceAction #MarketStructure #TechnicalAnalysis #Bearish #Bullish #Bitcoin #Crypto #BTCUSD #Forex #NakedChartReader #ZEROindicators #PreciseLevels #ProperTiming #PerfectDirection #ScalpingTrader #IntradayTrader #DayTrader #SwingTrader #PositionalTrader #HighLevelTrader #MambaMentality #GodMode #UltraInstinct #TheeBibleStrategy

Wealtris: Ethereum Demand Surges 32x — Price Set to Explode?According to a recent market analysis by Bitwise, Ethereum’s demand now exceeds supply by 32 times—a rare market condition that could lead to a major price breakout. Institutional interest, combined with Ethereum’s deflationary structure, is creating a perfect storm for growth.
At Wealtris, we treat this not just as market news, but as a strategic window to help our investors profit from a fundamentally bullish setup.
The imbalance is driven by several forces: over 27 million ETH are locked in staking, taking supply out of circulation; the upcoming wave of Ethereum spot ETFs is attracting pre-approval accumulation; and Ethereum’s fee-burning mechanism continues to deflate the token’s total supply. Simultaneously, its role as the backbone of DeFi, NFT infrastructure, and Layer 2 chains keeps demand elevated.
While traders speculate, institutions prepare. Whales and funds are quietly accumulating ETH in anticipation of regulatory clarity and ETF launches. Bitwise compares this setup to Bitcoin’s trajectory before its 2020 bull run, when a similar supply crunch triggered explosive gains.
Wealtris is already positioned for this moment. Our investment strategies offer smart exposure to Ethereum via staking platforms, ETH-indexed instruments, and Layer 2 ecosystem tokens. We provide our clients with risk-managed access to the Ethereum upside—without the need to self-manage wallets or guess market timing.
In addition, we monitor on-chain data and ETF progress in real time, adjusting exposure as signals shift. Our hybrid strategy—balancing yield generation and price exposure—helps clients benefit from both sides of the Ethereum equation.
For forward-looking investors, the 32:1 demand ratio isn’t just an interesting metric—it’s a signal. Wealtris uses that signal to generate structured growth through precise capital allocation and macro-responsive rebalancing.
With regulatory developments, staking innovation, and ETF momentum building, Ethereum appears poised for an institutional era. At Wealtris, we ensure our clients are prepared—early, efficiently, and profitably.

Best Meme Coins Live News Today: Latest Opportunities & UpdatesIn the fast-paced world of meme coins, today’s market presents fresh opportunities for both new and seasoned investors. With community-driven narratives dominating, identifying the best meme coins means staying updated on project fundamentals, social sentiment, and tokenomics. Here’s a detailed overview of the live scene and emerging opportunities shaping the meme coin landscape in 2025.
1. ShibaX (SHIBX): Riding the Dog-Themed Wave
Why it’s trending:
ShibaX combines the beloved Shiba Inu dog theme with practical features—NFT integration, staking, and cross-chain bridges. These elements have reignited investor interest.
Latest updates:
New staking platform launched on Ethereum and BNB Chain, offering up to 20% APY.
Roadmap reveal includes “ShibaX Arcade,” a gaming platform with meme lore-based mini-games.
DeFi integrations allowing SHIBX to be used as collateral in lending protocols.
Investor take: Strong branding with concrete utility upgrades could offer both hype-driven spikes and sustained growth.
2. BabyDoge Gold (BABYG): Rising from Origins
Why it’s trending:
A spin-off from the original Baby Doge Coin, BabyDoge Gold aims to redefine tokenomics with enhanced burn mechanisms and community engagement.
Latest updates:
Fix for liquidity token bug was addressed within 24 hours—boosting retail confidence.
Marketing campaign “Golden Paw” launched, expanding reach via YouTube and local crypto meetups.
25% token burn event announced to reduce supply and strengthen price over time.
Investor take: While still early-stage, BABYG’s quick fixes and supply-control measures are positive indicators—though caution remains necessary.
3. Floki EDU (FLOKIEDU): Meme Coin with Purpose
Why it’s trending:
Floki EDU differentiates with a strong emphasis on educational initiatives, publishing free courses about token fundamentals, security, and blockchain literacy.
Latest updates:
Partnership with a blockchain academy in India, enabling FLOKIEDU use in classrooms.
Interactive Telegram quiz bots reward users with tokens.
Pending centralized exchange listings, subject to community votes.
Investor take: Combining mission-driven goals with token utility adds long-term resilience beyond hype.
4. ElonDoge (ELDOGE): Fan-Focused Franchise
Why it’s trending:
Capitalizing on Elon Musk’s Dogecoin fandom, ElonDoge remains a cult favorite with its viral campaigns and high-yield staking pools.
Latest updates:
Limited-time pools with 150% APY to attract quick inflows.
Merchandise integration includes NFTs and apparel tied to Elon-themed meme culture.
"Space Chatter" Telegram community holds frequent AMAs, enhancing engagement.
Investor take: High-risk, high-reward dynamics—suitable for short-term momentum traders rather than long-term holders.
Final Thoughts
Despite the chaotic nature of meme coins, coherence between community strength and utility can spell significant returns. Coins like ShibaX and Floki EDU have moved beyond mere novelty, offering real functionality. Meanwhile, BabyDoge Gold and ElonDoge are high-volatility assets rooted in meme culture.
For traders, blending these project types can hedge risks. Stay vigilant, track updates, and always manage positions with discipline—this approach ensures readiness for the next meme market surge.
BREAKING – US to Unveil Key Crypto Report: Crucial Moment for BiIn what could be a watershed moment for the digital asset industry, the U.S. government is expected to release a major crypto policy report in the coming days. Sources suggest the report will outline a framework for regulating digital assets, including Bitcoin, stablecoins, and DeFi—potentially defining how crypto will be governed in the world's largest economy.
Why This Report Matters Now
Amid rising political and economic pressure, the U.S. is being forced to take a firmer stance on crypto. With the 2024 elections behind and growing institutional participation, Washington is no longer able to delay key decisions.
Expected highlights of the report include:
Clarification on whether certain crypto assets are securities
Guidelines for stablecoin regulation
A potential roadmap for central bank digital currency (CBDC) development
Recommendations on DeFi and wallet service compliance
The report comes at a time when market volatility and fragmented oversight have led to investor uncertainty and inconsistent enforcement across states and agencies.
Possible Scenarios: Boom or Bust
Pro-Bitcoin Outlook
If the report favors clear rules, supports innovation, and endorses Bitcoin as a commodity (as the CFTC suggests), it could trigger a strong market rally. Institutional players sitting on the sidelines may finally enter.
Harsh Regulation
On the other hand, if the report leans toward heavy-handed enforcement—especially targeting self-custody, privacy, or DeFi—it could stifle innovation and lead to capital flight to offshore markets.
Neutral-but-Positive
A middle-ground report offering regulatory clarity without immediate enforcement could calm markets and lay the foundation for measured growth.
What’s at Stake for Bitcoin?
Bitcoin’s status in U.S. law remains technically undefined, though it’s generally viewed as a commodity. A clear statement reaffirming this status could fuel renewed institutional demand, ETF expansions, and deeper integration with traditional finance.
Conversely, if Bitcoin is lumped into broader regulatory restrictions, especially around AML or taxation, it could face new compliance burdens—dampening short-term momentum.
How the Market Is Reacting
Ahead of the report, Bitcoin has shown elevated volatility. Whales appear to be repositioning, with increased activity across derivatives markets and stablecoin inflows—indicating expectation of major movement.
Traders are watching key support at $56,000 and resistance near $60,000. A clear policy win could break this ceiling fast.
Conclusion
The upcoming U.S. crypto report could mark a historic regulatory pivot. For Bitcoin and the broader industry, the stakes are high: legitimacy, liquidity, and long-term growth—or repression and stagnation. One thing is certain—the days of regulatory limbo in the U.S. are numbered.

BTC my notes for generalas long as it stays above 102k i see no problem for new aths
but there are too much liq pos at 95-97k
resistances are 122 - 137 - 145 - 161k
not financial advices, notes for myself
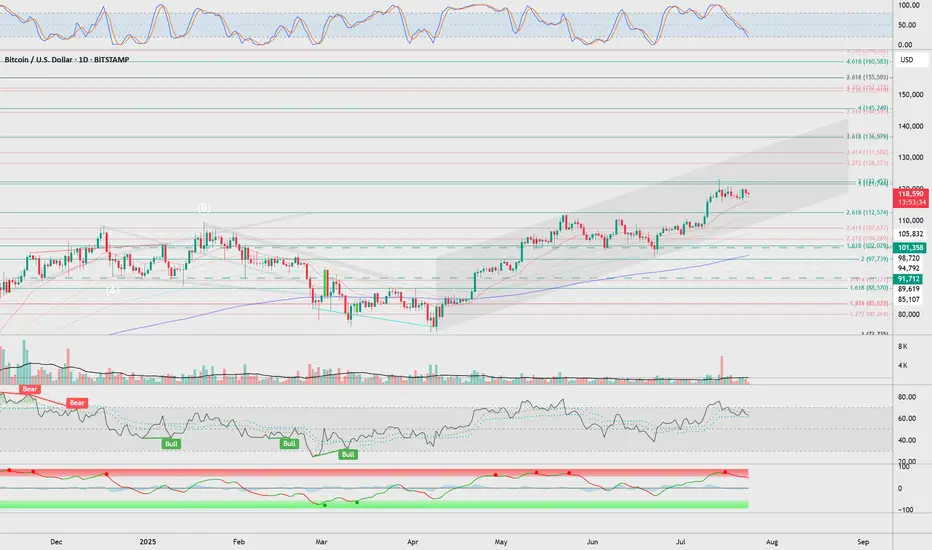
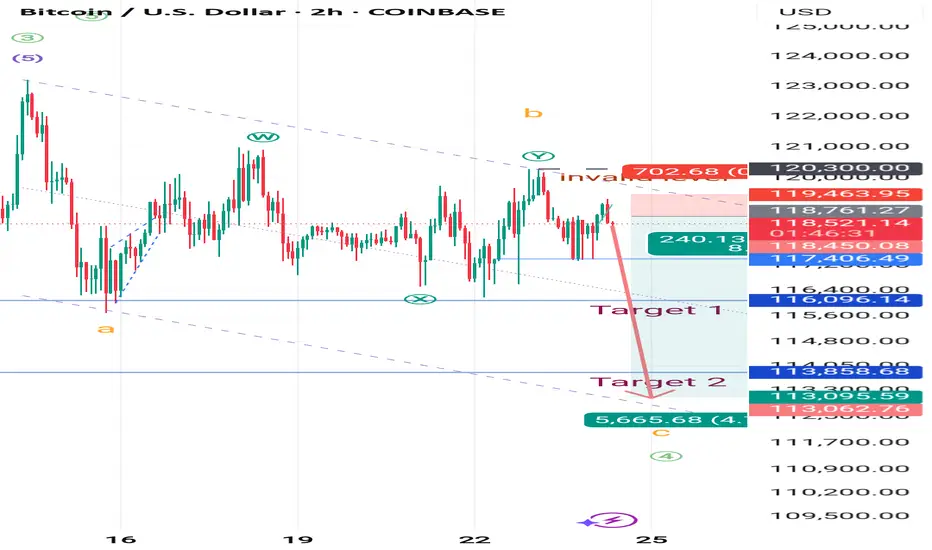
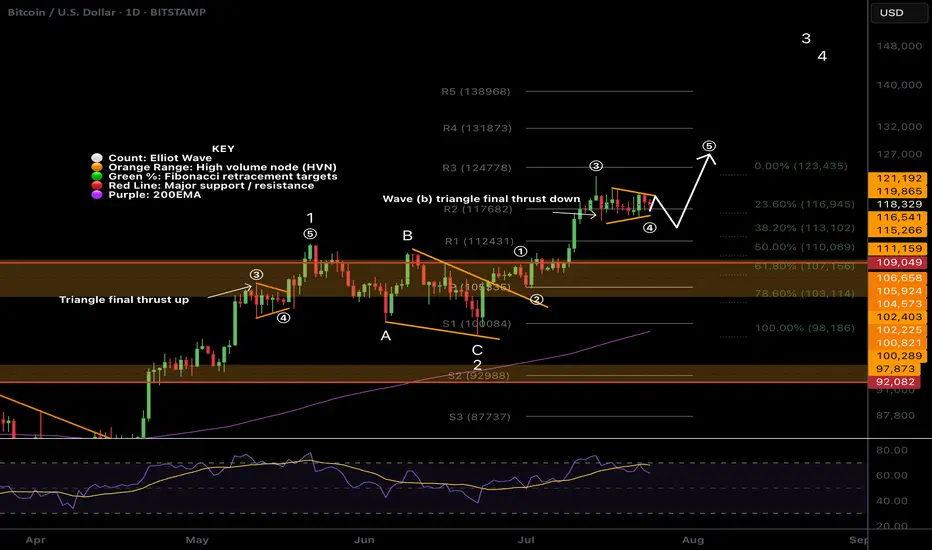
$BTC Wave (b) triangle?CRYPTOCAP:BTC Bitcoin appears to have competed wave 3 up, wave (a) down and now finishing a triangle in wave (b) which would result in a thrust down to around $113k before continuing to the upside in wave (5).
There is slight bullish divergence on daily RSI and wave (4) meets the Fibonacci retracement rules of between 0.236 - 0.382 adding confluence.
Previous all time high is expected to be tested as support on a larger correction, perhaps when the ascending daily 200EMA creeps up to the same level after we blow off.
Safe trading
BTC #15-minute Bitcoin (BTC/USD) chartThis 15-minute Bitcoin (BTC/USD) chart shows a recent bullish reversal from a strong demand zone (highlighted in grey near $117,400). Price broke above a minor resistance (grey zone around $118,000) and is currently following an upward trendline. The next key resistance is around $118,600 (blue horizontal line), which may act as a target or reversal point. Bulls are currently in control as long as price respects the trendline and holds above the broken resistance.
thanking you

Bitcoin Awaits the Federal Voice - The Threshold of Compression.⊢
⟁ BTC/USD - BINANCE - (CHART: 1H) - (July 24, 2025).
◇ Analysis Price: $117.830,17.
⊣
⨀ I. Temporal Axis - Strategic Interval - (1H):
▦ EMA9 - ($118.267,48):
∴ The 9-period Exponential Moving Average (EMA9) was serving as immediate microstructural support until July 23rd, when a full-bodied bearish candle broke through it with volume below average but directionally firm;
∴ Post-break, EMA9 began to flatten, then bend downward, reflecting a tactical loss of bullish momentum within the intraday range structure;
∴ Price has attempted multiple recoveries toward EMA9 but has been consistently rejected at or below it, confirming its transition into resistance status.
✴️ Conclusion: EMA9 has transitioned from a dynamic support to tactical resistance, indicating a short-term trend deterioration and weakening of upward initiative.
⊢
▦ EMA21 - ($118.396,85):
∴ The 21-period EMA functions as the median layer of microstructure and has held relatively flat for several days, suggesting a compressed momentum environment;
∴ As of the latest price action, the EMA9 has definitively crossed below EMA21 - a classic tactical signal of microtrend exhaustion, especially when paired with lateral volume and a suppressed RSI;
∴ EMA21 remains unbroken since July 21st, reinforcing its role as an anchor level for short-term rejections and as a ceiling against breakout attempts.
✴️ Conclusion: EMA21 maintains structural weight as resistance, and the confirmed cross-under by EMA9 introduces a tactical shift into intraday bearish flow.
⊢
▦ EMA50 - ($118.434,93):
∴ The 50-period EMA, long considered the “defensive perimeter” of bullish short-term structure, had been flattening with slight upward bias since July 19th;
∴ However, in the last two sessions, it has shown the first measurable downward curvature, marking the decay of medium-term intraday bullish control;
∴ Price remains significantly below the EMA50, and multiple upside attempts have failed before even reaching it, reflecting market hesitation and lack of participation.
✴️ Conclusion: EMA50 has begun its first bearish slope since July 16th, indicating an eroded tactical bias and confirming loss of momentum from the bulls' side.
⊢
▦ Bollinger Bands (21, 2) - (Upper: $119.254,34 / Lower: $117.398,28):
∴ The Bollinger Bands have narrowed continuously over the last three sessions, forming a visible compression channel - a prelude to volatility expansion;
∴ Price rejected cleanly from the upper band on July 23rd and traveled to the lower band without support, closing two candles consecutively near the lower range;
∴ The Bollinger Median is aligned with the EMA21, reinforcing its status as the core compression axis and tactical gravity point.
✴️ Conclusion: Bollinger structure suggests imminent breakout scenario; current price behavior signals bearish volatility bias unless structure is broken with strong volume.
⊢
▦ Volume + EMA 21 - (Current: 13 BTC):
∴ Volume has declined steadily throughout the last five trading sessions, as seen in the downward-sloping EMA21 overlaid on the volume histogram;
∴ Recent bearish moves occurred on lower volume compared to previous weeks, indicating low conviction and possible manipulation-prone liquidity zones;
∴ There is no expansion in volume accompanying the most recent directional candles, confirming this as a phase of tactical disinterest rather than distribution.
✴️ Conclusion: Market participants are not committing capital - the tape is flat, silent, and manipulable, increasing the risk of abrupt fakeouts or shadow breakouts.
⊢
▦ RSI (21) + EMA 9 - (Current RSI: 45.55):
∴ The Relative Strength Index has remained below the 50-neutral mark for three sessions, with a confirmed downward slope and rejection from its 9-period EMA overlay;
∴ There is no sign of divergence, bullish or bearish, suggesting that price action is neither exhausted nor ready to reverse;
∴ RSI’s current position confirms momentum is negative but controlled - an environment of inertia rather than acceleration.
✴️ Conclusion: RSI confirms tactical weakness - directional force is absent, and momentum favors sellers in a low-intensity regime.
⊢
▦ Stochastic RSI (3, 3, 21, 9) - (Current: 4.32):
∴ The Stoch RSI has fallen into extreme oversold territory after failing to sustain a double-top formation near the 80-level earlier this week;
∴ The plunge occurred with speed and depth, signaling loss of buying initiative - often a precursor to passive rebounds without follow-through;
∴ Current readings near zero indicate the potential for technical retracement, but no reversal confirmation is present without RSI and MACD alignment.
✴️ Conclusion: The oscillator signals oversold status, but the context suggests any bounce would be corrective, not impulsive - a trap for premature long entries.
⊢
▦ MACD (9, 21) - (MACD: -95.69 / Signal: -129.37):
∴ MACD histogram shows initial contraction of bearish momentum, but remains submerged below the zero-line and far from a clean crossover;
∴ MACD line is attempting to turn up, but the signal line remains significantly below it, indicating lack of consensus between short and medium-term momentum;
∴ Previous fake signals from MACD in this range suggest caution divergence is visible, but -structure is weak.
✴️ Conclusion: MACD shows early signs of momentum divergence, but without structure or volume, the setup remains fragile and unconfirmed.
⊢
▦ OBV + EMA9 - (OBV: 26.69K):
∴ On-Balance Volume has entered a horizontal band with no structural incline or decline for three consecutive days;
∴ OBV's 9-period EMA is now perfectly flat, reflecting market indecision and a symmetrical distribution of volume over time;
∴ No bullish or bearish divergence is visible, indicating that volume flow is passive and non-directional.
✴️ Conclusion: OBV confirms tactical silence in the order book - structure lacks engagement, and accumulation or distribution is absent.
⊢
🜎 Strategic Insight - Technical Oracle:
∴ All indicators on the H1 chart converge toward a single message: tactical drift within a structurally neutral, low-volume regime;
∴ The EMA's are aligned downward, RSI is slipping without exhaustion, MACD offers unconfirmed divergence, and Stoch RSI is oversold without structure;
∴ This constellation presents a dangerous battlefield - one where silence reigns louder than signal;
∴ Breakouts are possible, but not probable without macro ignition.
⊢
∫ II. On-Chain Intelligence - (Source: CryptoQuant):
▦ Exchange Reserves + 9EMA - (All Exchanges):
∴ Bitcoin reserves on centralized exchanges have decreased from (~2.46M) to 2.41M Bitcoin over the past 30 days, but the decline halted on July 21st and entered a horizontal range;
∴ This plateau indicates a pause in the long-term outflow trend, suggesting that neither accumulation nor distribution is dominating;
∴ Exchange reserves are a key liquidity gauge, and flatlining implies equilibrium between withdrawal behavior and deposit pressure.
✴️ Conclusion: No liquidity threat from centralized exchange reserves - a neutral signal in an inert market.
⊢
▦ Funding Rate + 9EMA - (All Exchanges):
∴ The funding rate remains mildly positive across perpetual contracts, indicating a slight long bias - (+0.008);
∴ However, the rate is far from extremes that would signify either overleveraging or liquidation risk;
∴ Historical context shows that a funding rate near zero during price stagnation often precedes volatility expansion.
✴️ Conclusion: Cautious optimism present among derivatives traders, but not enough to drive trend - latent energy, directionless.
⊢
▦ Stablecoin Ratio + 9EMA - (All Exchanges):
∴ The ratio of stablecoins to Bitcoin on exchanges remains at all-time lows, signaling an environment with reduced buying power;
∴ This lack of fresh capital severely limits the capacity for breakout rallies, especially when combined with poor volume and flat OBV;
∴ No stablecoin inflows = no fuel for upward movement.
✴️ Conclusion: The market is liquidity-starved - stablecoin ratio confirms lack of bullish firepower.
⊢
▦ Realized Cap + 9EMA:
∴ Realized Cap has surpassed the $1 trillion mark for the first time, suggesting robust conviction among holders and long-term participants;
∴ This metric rises only when coins move at a profit, indicating that active participants are not capitulating but rather holding or consolidating;
∴ The Realized Cap trajectory diverges from flat spot price - an arcane sign of underlying strength.
✴️ Conclusion: Structural confidence remains intact at the macro level - price inertia belies silent conviction.
⊢
🜎 Strategic Insight - On-Chain Oracle:
∴ On-chain metrics whisper stability;
∴ No excessive optimism, no panic, just a dry and frozen battlefield;
∴ Exchange reserves are flat, stablecoin ratio is weak, but Realized Cap shows unwavering belief; ∴ If the market breaks, it will be macro-induced - not on-chain triggered.
⊢
✴️ Codicillus Silentii - Strategic Note:
∴ The gatekeepers are at the threshold:
Jerome Powell’s speech: July 25;
U.S. GDP Q2 (Preliminary): July 26.
∴ Both are macro-keystones that will either ignite movement or deepen compression. The tape is silent because the world awaits signal.
⊢
𓂀 Stoic-Structural Interpretation:
▦ Structurally Neutral - Tactically Bearish Drift.
∴ EMA's aligned downward, RSI below midline, OBV stagnant - no strength, no collapse;
∴ Bearish drift, but no conviction.
▦ Tactical Range Caution:
∴ Support: $117.400 - (lower Bollinger limit);
∴ Resistance: $118.900 - (EMA cluster + BB midline).
✴️ Final Seal: Bitcoin rests under the veil of compression. Eyes turn to Powell. Silence prepares the break.
⊢
✴️ Final Codex Interpretation:
∴ The chart speaks not in fire nor fury - but in breathless tension:
Each line, curved and silent, awaits the tremor of a greater voice;
The market is not weak - it is listening. And what it hears may not be price, but power.
∴ The candles drift beneath their own gravity:
The EMA's now form a declining constellation, dimming the tactical skies;
No reversal, no collapse - only weightless time.
∴ Volume is not a storm. It is absence:
And absence in markets is not peace - it is preparation.
∴ On-chain, conviction stands with sealed lips:
Reserves unmoved, stablecoins withdrawn, but Realized Cap ascends - as if the soul of Bitcoin advances, while the flesh waits behind.
∴ And above all - the macro sphere:
Two seals remain locked: Powell’s speech and GDP;
One whispers interest rates. The other shouts reality.
⊢
✶ This is not a trend. It is a pause in fate;
✶ This is not weakness. It is breath before the chant.
⊢
✴️ Conclusion Codex Interpretation:
∴ Bitcoin is in deliberate suspension - structurally stoic, tactically inert;
∴ A sovereign asset waiting not for buyers, but for context;
∴ The gate opens July 25th. Until then: silence reigns.
⊢
⧉
· Cryptorvm Dominvs · MAGISTER ARCANVM · Vox Primordialis ·
⚜️ ⌬ - Silence precedes the next force. Structure is sacred - ⌬ ⚜️
⧉
⊢

BTC SUPERBULLISHBTC is superbullish as presidentialship of Trump so this can be the view of BTC according to me in daily time frame which can take 1 month to complete this much travel.