BTC to $1,000,000 by End of 2025? 📈 BTC to $1,000,000 by End of 2025? Here's a Macro View No One’s Charting Yet
While most are targeting $100K–$250K, this model suggests $1M BTC is possible — briefly — before global markets adjust.
🔎 Why?
Post-halving supply crunch is just starting to kick in
Sovereign wealth funds may rotate out of gold quietly
AI-run financial systems could hard-code BTC as a digital reserve
Institutional ETF demand hasn’t peaked — it’s still forming a base
🧠 The Twist:
If Bitcoin hits $1M, it won’t be because of retail.
It’ll be because the global financial system is silently being rewritten.
At that level, BTC becomes the benchmark, not the outlier.
Not advice. Just the next layer deeper.
📊 Agree? Disagree? Let’s chart it.
#BTCUSD #Bitcoin #Crypto #LongTermView #MacroTrading #HalvingCycle #TradingView
L1NK 0N BI0
BTCUSD trade ideas

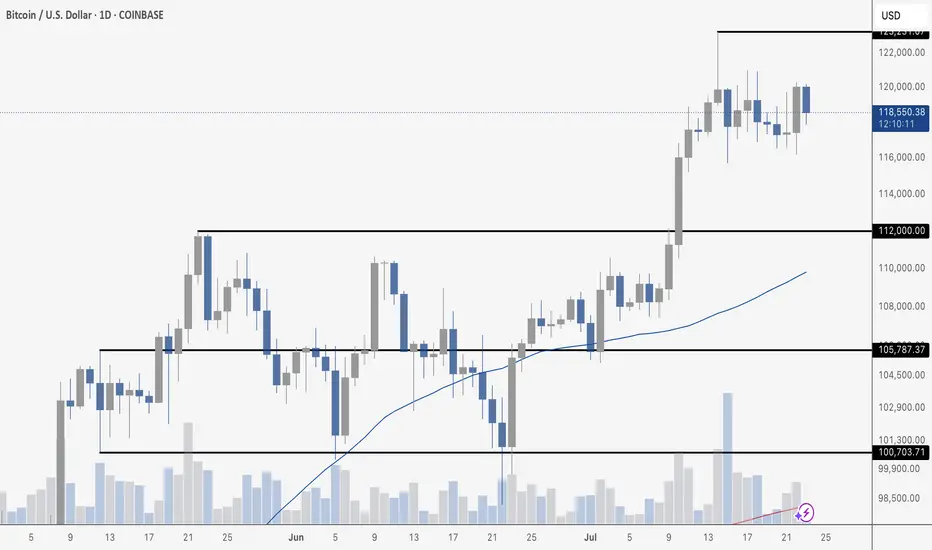
BTC / USD Daily ChartHello traders. Taking a look at the Daily on Bitcoin, I am watching for support to hold and for a break out above the $120k area. Leveraged traders need to be careful to not get smoked during any dips. Eventually we will need to retest that $111k area. Patience is key. We are just days / weeks away from Bitcoin going parabolic. Buckle up. All my thanks goes to Big G. Be well and trade the trend. Shout out to my crypto bro Josh. Happy Wednesday!!

BITCOIN UPDATE Bitcoin seems to be preparing to fix its lows so it’s time to target a trade to the up side because, it had dropped to a fair amount of lows
More confirmation!Classic ABCDE pattern has formed. Is this the catalyst we've been waiting for to spark the next aggressive leg up?

BTC Makes New Daily HighBitcoin is consolidating near its highs, and yesterday’s candle marked the **highest daily close in BTC’s history**, settling just below \$120,000. That’s a major technical milestone and a clear sign of strength in the ongoing trend.
While today’s price action has pulled back slightly – down about 1.19% at the time of writing – BTC remains firmly above the key support zone at \$112,000. This level, once resistance, has now flipped to support after a sharp breakout in mid-July. As long as BTC holds above it, the bullish structure remains intact.
Volume has cooled slightly since the breakout, but the recent candles show healthy consolidation rather than weakness. The 50-day moving average continues to trend upward, currently sitting just above \$108K – offering dynamic support for any deeper retracements.
The next key level to watch is the all-time high wick around **\$123,231**. A breakout above that zone would likely trigger another leg higher, possibly into price discovery. But even without immediate upside, the market appears to be digesting gains in a constructive way.
In short: **highest daily close ever**, bullish structure intact, consolidation healthy. Momentum is cooling, but the setup still favors the bulls.
$BTC / Bitcoin Update - The Bitcoin Awakes? 7/23Hello fellow gamblers,
BTC price action has probably pissed off a lot of you, but I believe we are getting close to a breakout.
If my theory is correct, we are forming a wyckoff re-accumulation pattern that will give us an explosive move towards ATH.
- Right now will be a great buying opportunity for those with those that have nothing to lose(super risky entry), but I am suspecting that we formed a spring and the breakout happens next.
- The pattern is still valid as long as we stay above 116k.
- If we lose 116k, we will go towards 110k.
- Levels to watch: 116.7k, 117.9k, 120.3k, 123.2k

update : BTC/USD : WATCH TIME
Bitcoin
7 minutes ago
BTC/USD: Phase 9 In Progress – Watch Time
0
7 minutes ago
BTC has completed its impulsive and correction phases. Now it’s deep into Phase 9, the distribution phase ...
🧭 Bias: Long
📆 Daily Cycle:
Phase 3: Apr 5 – May 26 (40 bars)
Phase 6: May 26 – Jul 2 (12 bars)
Phase 9: Jul 2 → Expected until Aug 6
Now forming 3 internal sub-cycles (1H chart) = as explained on the chart by green trend info lines.
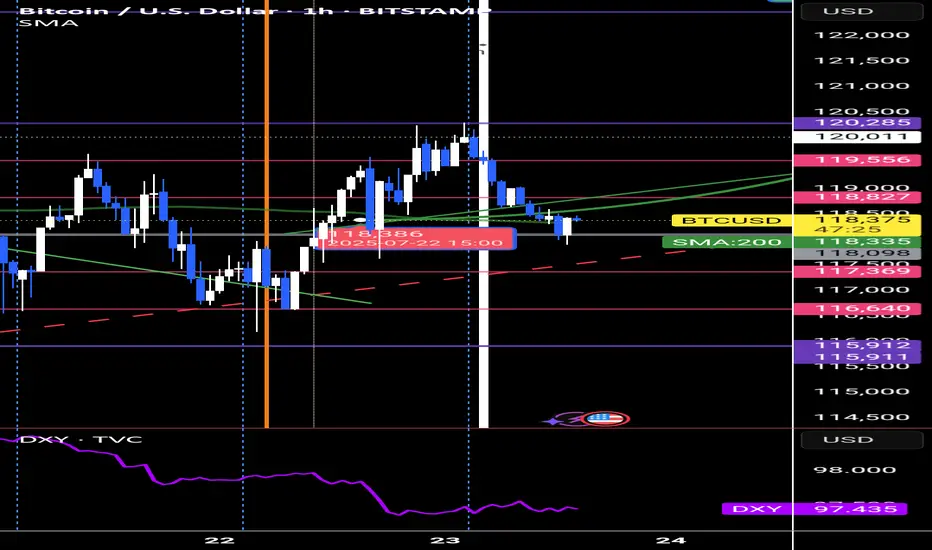
📍 Buy Zone: 118098 – 118827
🛡️ Stop Loss: 117369
🎯 Target: 120850
📅 Before Friday, July 25.
reason: this is the dip it shouldn't goback
The market doesn’t care what you “feel.”
It respects the clock.
BTC/USD: Phase 9 In Progress – Watch TimeBTC has completed its impulsive and correction phases. Now it’s deep into Phase 9, the distribution phase ...
🧭 Bias: Long
📆 Daily Cycle:
Phase 3: Apr 5 – May 26 (40 bars)
Phase 6: May 26 – Jul 2 (12 bars)
Phase 9: Jul 2 → Expected until Aug 6
Now forming 3 internal sub-cycles (1H chart) = as explained on the chart by green trend info lines.
📍 Buy Zone: 118098 – 118827
🛡️ Stop Loss: 117369
🎯 Target: 120850
📅 Before Friday, July 25.
reason: this is the dip it shouldn't goback
The market doesn’t care what you “feel.”
It respects the clock.

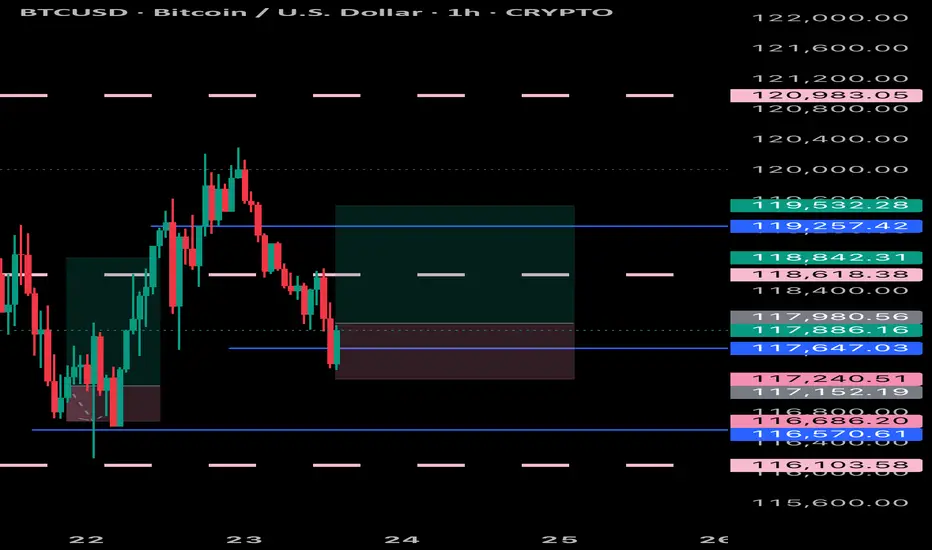
BTC Range-Bound Movement With Key Levels in SightBitcoin has largely traded sideways on the daily chart since reaching its all-time high of $122,054 on July 14. The current range is defined by a resistance level around $120,000 and a support floor around $116,000
With demand gradually weakening, BTC risks a breakdown below the current support. A close below $116,000 could open the path toward $114,000, marking a deeper short-term correction.
On the upside, renewed buying pressure could push BTC above the $120,000 resistance. A successful breakout may set the stage for another retest of the all-time high and potentially new highs if momentum follows through.

New highs for bitcoin but momentum lowerGenerally lower trade tension, ongoing expectations of two more cuts by the Fed this year and speculation about Jerome Powell’s possible replacement have been some of the main macro fundamental factors driving bitcoin recently. Sentiment in crypto markets generally is greedy but liquidity and volatility have been more limited. So far this movement starting in early July has been much more limited in scope compared to the frantic gains late in 2024.
The very obvious candidate for medium-term resistance would be the 161.8% weekly Fibonacci extension slightly below $140,000. It’s practically certain that the price will reach there sooner or later, but the challenge for traders of CFDs on bitcoin is how long that’s going to take and how far the price might retrace lower before then. Currently there’s no overbought signal from either Bollinger Bands (50) or the slow stochastic, but saturation generally isn’t a useful signal for cryptocurrencies anyway.
In the absence of any evidence of significant profit-taking after $120,000 was reached and amid seemingly high buying demand with an ongoing media frenzy, the price is likely to make a new high again soon unless fundamentals and sentiment shift dramatically. Timing the trade though is potentially very difficult.
This is my personal opinion, not the opinion of Exness. This is not a recommendation to trade.

Bitcoin ready for 144000After the trend line is broken and the pullback is ready to pump to the range of 138,000 to 140,000
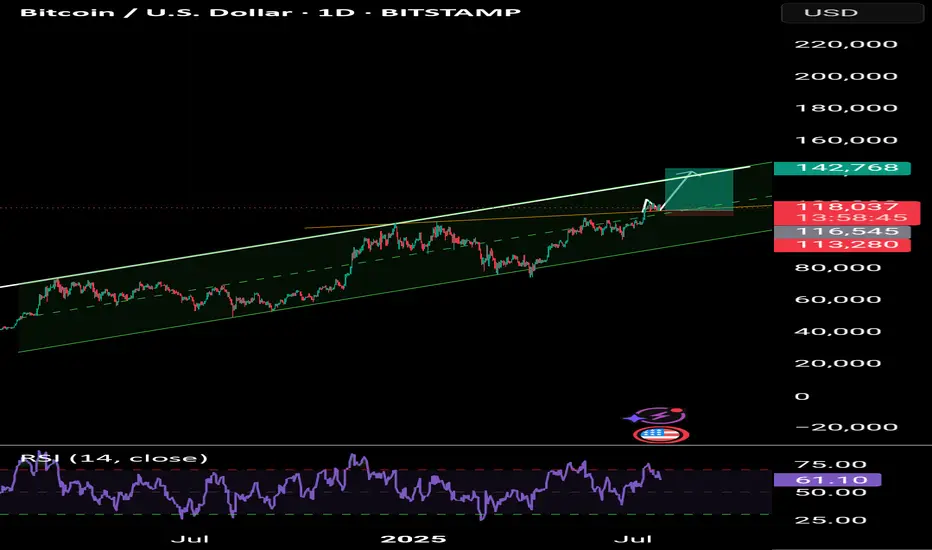
Bitcoin long Bitcoin After the trend line is broken and the pullback is ready to pump to the range of 138,000 to 140,000🤪🤪🤪

BITCOIN - Entry on basis of Internal CHOCH & (Demand/supply).1. Trade Prediction Breakdown
Current Price: ~117,967
Short-Term Bias (1H):
Expecting a minor pullback/retrace toward a small 1H supply (orange line), then a drop.
This internal structure sets up a CHOCH.
Mid-Term Setup:
Price is projected to dip into the 4H demand zone (~112,000–114,000), confirming a bullish mitigation zone.
After demand is tapped → Expect bullish BOS (Break of Structure) to resume higher timeframe uptrend.
Entry Logic:
Aggressive Entry: Sell from 1H supply (small RR setup).
Main Entry: Buy from 4H demand after price shows bullish internal structure (e.g., bullish CHOCH or BOS on LTF like 15M/30M).
🧠 Key Concepts Applied:
Concept How it's used in this chart
CHOCH Signals potential reversal in short-term structure
Supply Zone (1H) Short entry trigger area
Demand Zone (4H) Expected strong bounce area
Internal Structure Used to time entries and CHOCHs
External Structure Governs overall trend and swing direction
✅ Final Trade Idea Summary:
🔽 Short-Term Sell from 1H supply zone.
📉 Target = 4H Demand Zone (112k–114k).
🔼 Buy from 4H Demand after confirmation (expecting strong upward rally).
🎯 Final target = 122k+ area (based on external bullish structure).
Let me know if you want this turned into a trade journal

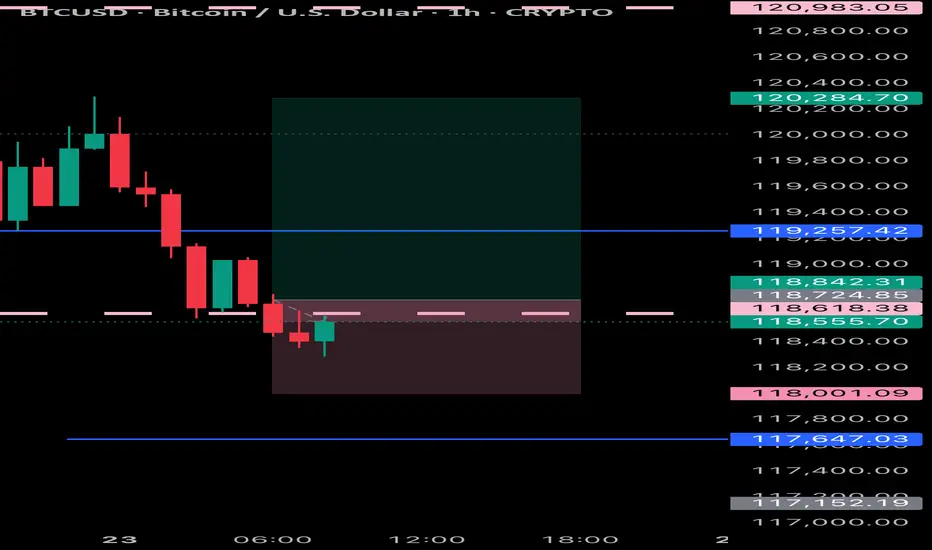
BTCAs analyzed, the short from 119,544.66 is playing out perfectly — current price is 17,964.33
Patience paying off. ✅

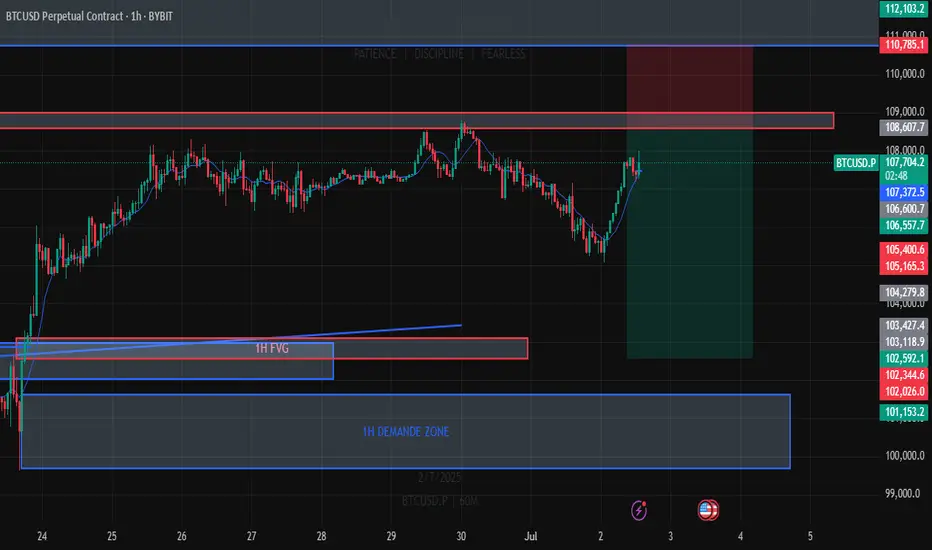
BitcoinBitcoin has fallen below the support area, resulting in the expected quick decline. The price is currently testing the resistance area and must reclaim this level; otherwise, we may see downward movement again. The key level to reclaim is between $106,800 and $107,000.
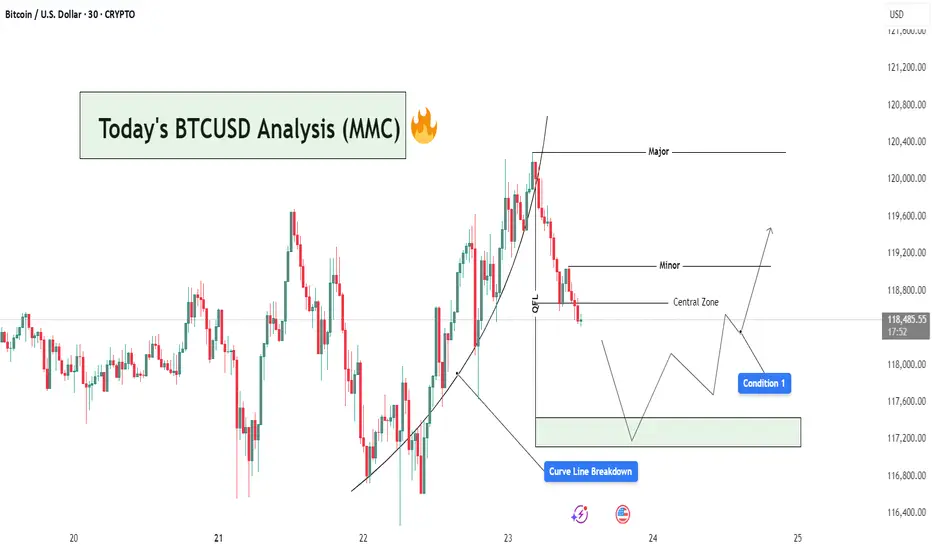
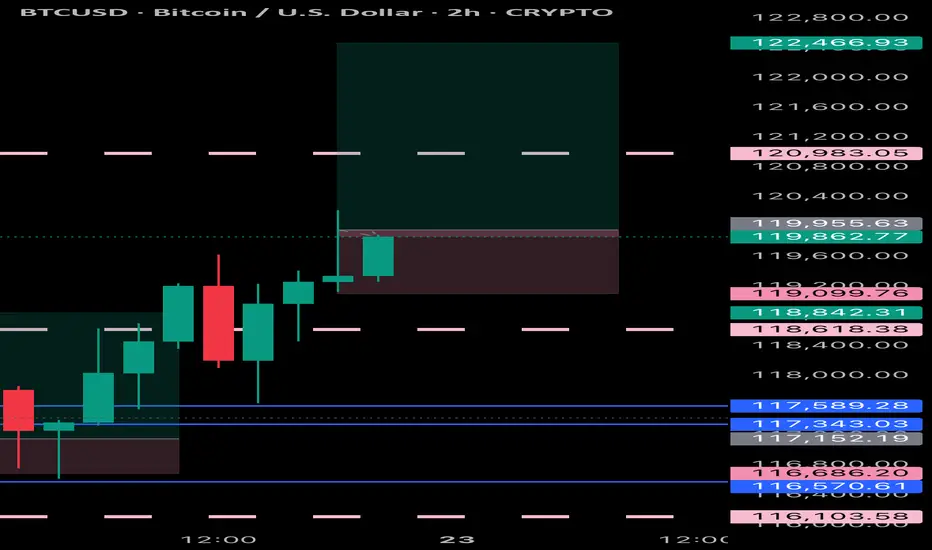
BTCUSD Analysis : Curve Line Breaked and Move Towards Target📊 Market Overview:
BTCUSD has recently completed a strong bullish leg, following a parabolic curve formation that led price into a Major Resistance Zone near the $120,400 level. This rally aligns with MMC principles where price forms momentum-driven structures before reaching high-liquidity zones (often ending in exhaustion).
📍 1. Curve Line Support & Breakdown – A Shift in Sentiment
Your chart shows a clear Curve Line that supported the bullish impulse. Price respected this dynamic support throughout the uptrend until a Curve Line Breakdown occurred—marking the first sign of bullish weakness.
In MMC strategy, this curve structure breakdown is critical:
It tells us the accumulation → expansion → exhaustion cycle is ending.
The market is likely entering retracement or distribution phase.
Price often seeks lower equilibrium, typically around the Central Zone.
🧠 2. QFL Zone (Quick Flip Level) – The Hidden Base
Immediately after the curve broke, price moved toward the QFL level, which represents a demand base from earlier structure. This zone acts as a short-term support and often produces a reactive bounce (but not always a reversal).
Watch closely:
If price respects this zone → temporary relief bounce
If it fails → we’ll likely see full test of Central Zone or lower demand levels
🟩 3. Central Zone – The MMC Decision Area
The Central Zone is a key horizontal level on your chart, defined between ~$117,300 and ~$118,200. This zone is marked based on:
Previous structure
Volume clusters
Demand imbalance
Why is this zone important?
It serves as the balance point between buyers and sellers.
A bullish reaction here could re-initiate a move toward Minor Resistance (~$119,200).
A failure to hold could open the door for deeper retracement toward the green demand box (~$117,200 or below).
🔄 4. Two Primary MMC-Based Conditions to Watch:
✅ Condition 1: Bounce from Central Zone
Price reacts from within the Central Zone
Forms bullish structure (double bottom, bullish engulfing, or reversal wick)
Short-term target becomes Minor Resistance (~$119,200)
If volume increases and price breaks above Minor, continuation toward Major is possible
❌ Condition 2: Breakdown & Bearish Continuation
Price fails to hold within Central Zone
Bearish structure forms (e.g. lower highs, breakdown candles)
Clean move expected toward next liquidity pocket at $117,200–$116,800
This would confirm market shifting into bearish control
📌 5. Minor vs Major Levels – Key Zones
Minor Resistance (~$119,200): Short-term target if bounce occurs
Major Resistance (~$120,400): Liquidity sweep zone, strong supply
Green Demand Box (~$117,200): If Central Zone fails, this becomes next bounce zone
📘 Final Thoughts:
This is a classic MMC setup in real-time:
Curve Formed → Broke
OFL + Central Zone → Now being tested
Next move depends on confirmation from buyers or sellers at Central Zone
Don’t trade emotionally — let price action give you confirmation before taking any positions. Watch the Central Zone behavior closely and manage risk based on scenario outcomes.
Price is approaching the bottom of the rangeAs mentioned in our previous analysis, the price had reached the top of the range. At that stage, we had two options: wait for a confirmed breakout to the upside, or take a reactive position anticipating a move toward the bottom. Now, we are seeing price action moving toward the lower boundary of the range.

Btcusdt techinical analysis.Btcusdt techinical analysis next move posibale at h1 time frame.not finchinal advice.

Bitcoin H4 | Crypto to remain elevated?Bitcoin (BTC/USD) is falling towards a multi-swing-low support and could potentially bounce off this level to climb higher.
Buy entry is at 116,242.45 which is a multi-swing-low support.
Stop loss is at 111,600.00 which is a level that lies underneath a pullback support.
Take profit is at 122,734.70 which is a swing-high resistance.
High Risk Investment Warning
Trading Forex/CFDs on margin carries a high level of risk and may not be suitable for all investors. Leverage can work against you.
Stratos Markets Limited (tradu.com ):
CFDs are complex instruments and come with a high risk of losing money rapidly due to leverage. 66% of retail investor accounts lose money when trading CFDs with this provider. You should consider whether you understand how CFDs work and whether you can afford to take the high risk of losing your money.
Stratos Europe Ltd (tradu.com ):
CFDs are complex instruments and come with a high risk of losing money rapidly due to leverage. 66% of retail investor accounts lose money when trading CFDs with this provider. You should consider whether you understand how CFDs work and whether you can afford to take the high risk of losing your money.
Stratos Global LLC (tradu.com ):
Losses can exceed deposits.
Please be advised that the information presented on TradingView is provided to Tradu (‘Company’, ‘we’) by a third-party provider (‘TFA Global Pte Ltd’). Please be reminded that you are solely responsible for the trading decisions on your account. There is a very high degree of risk involved in trading. Any information and/or content is intended entirely for research, educational and informational purposes only and does not constitute investment or consultation advice or investment strategy. The information is not tailored to the investment needs of any specific person and therefore does not involve a consideration of any of the investment objectives, financial situation or needs of any viewer that may receive it. Kindly also note that past performance is not a reliable indicator of future results. Actual results may differ materially from those anticipated in forward-looking or past performance statements. We assume no liability as to the accuracy or completeness of any of the information and/or content provided herein and the Company cannot be held responsible for any omission, mistake nor for any loss or damage including without limitation to any loss of profit which may arise from reliance on any information supplied by TFA Global Pte Ltd.
The speaker(s) is neither an employee, agent nor representative of Tradu and is therefore acting independently. The opinions given are their own, constitute general market commentary, and do not constitute the opinion or advice of Tradu or any form of personal or investment advice. Tradu neither endorses nor guarantees offerings of third-party speakers, nor is Tradu responsible for the content, veracity or opinions of third-party speakers, presenters or participants.

BTC SHORTAs expected the high was taken out.
I just took a low-probability sell on $BTC.
Join me if you can
➡️stop loss- 121,111.81
➡️enter now.
➡️manage your risk.

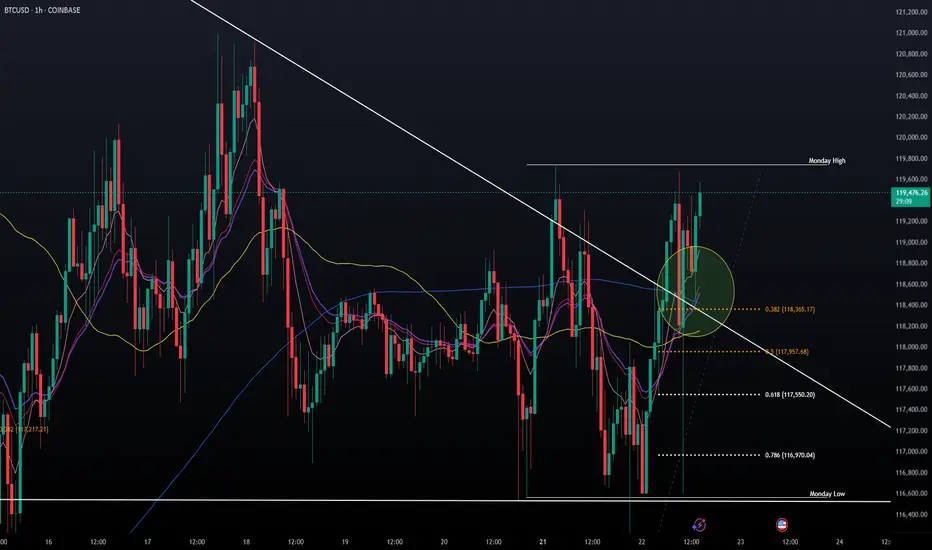
Confluent Factors much? Trending, Above EMA: 9,18,21 (angled up) + Above MA: 50,200 + Fib .382, Horizontal Support, Diagonal Support with triangle 70% completed. Was/is a great re-test to buy for the short term acct.