Confluent Factors much? Trending, Above EMA: 9,18,21 (angled up) + Above MA: 50,200 + Fib .382, Horizontal Support, Diagonal Support with triangle 70% completed. Was/is a great re-test to buy for the short term acct.
BTCUSD trade ideas
BTCUSD RECAPBITCOIN has preformed as expected in short period of time can continue even more to the up side but will wait for good entries

What do we need to know before investing?If you are thinking about investing money for the potential returns it offers, you should know that it may go well, but that there are always risks. That’s why we are going to give you some basic tips to bear in mind before making any investment decision.
How much money are you going to invest?
First of all, you need to decide how much money you want to put towards your financial investments.
The markets are subject to change
The financial markets are constantly fluctuating. The term volatility is the most commonused term to describe and measure the uncertainty provided by changes to theprices of financial assets.
Additionally, there are times in the market when the prices are more pronounced and every now and then there are crisis periods and asset prices fall dramatically.
Investing in financial markets means that we have to assume that our investments will always be subject to these types of fluctuations. If you are going to invest in the financial markets the money that you invest must be money that you will not need during the investment term.
That’s why, investing in order to obtain short term gains is inevitably associated with high risk. Furthermore, the larger our intended gains, the larger the associated risk. Always bear in mind that the greater the expected returns, the greater the assumed risk. Once again, be sure that you do not need the money that you are going to invest, as it may have losses.
The opposite can be said of long term investments, where the capacity to wait and overcome falls in the market means that you can assume more risk with your investments. With a long term vision you will avoid having to experience any possible losses with your investment period due to any eventual liquidity needs.
How much risk are you willing to take on?
Before investing it is important to know the risk you can assume. Every investor has their own risk tolerance level that they need to be aware of. Risks and returns go hand in hand, because for more returns you also need to take on more risk, and vice versa.
It is also good to know that just as with normal market conditions, those assets with a higher risk tend to suffer more fluctuations with their prices than those assets with less risk.
Therefore, in general terms:
When the forecasts for the financial markets are favourable and the market goes up, those assets with higher expected returns generally perform excellently.
Whenever the financial markets are going through uncertain times, those assets with higher expected returns, and therefore more risk, tend to perform worse.
You must start from a strong financial position
To invest you need to be at a point where your accounts are well under control, including your debts. We do not mean to say that if you have any outstanding credit you cannot invest, but it is essential that everything is in order and that you are in a situation where you can fulfil your financial obligations.
On the other hand, to build long term wealth, it is important that you assign part of your income to your savings, meaning that you have to invest with the money left over after making your payments while also saving part of what you earn.
It is important to keep a composed outlook
Now we know that investing bears its own risks and that the market is subject to change, it is essential to be composed when investing. When investing it is important to think positively, as if you don’t really believe that things will work out, why invest?
It is one thing to be cautious, and to know how much money to invest and what level of risk tolerance to assume, and another to think negatively each time there is a drop in the market. In reality, investing is a combination of caution and composure.
Diversification is the key to success
Somebody with less investment experience may make the mistake of putting all of their investment budget into just one thing. However, it is much better to have diverse investments, as while some investments may not quite work out as you would have liked them to, some do even better.
Losses are normal, and so are returns
We previously said that when investing it is important to stay calm, and that is true. In this regard, you also have to bear in mind that it is normal for some investments in your portfolio to not perform as well as you had expected.
We cannot predict the behaviour of the financial markets or of certain assets. We can also unexpectedly find ourselves with some assets that don’t perform as well as we had hoped. That is why we recommend, in addition to not risking more than you can invest, to diversify your investments well.
We have already said that investment involves risk, which is why it is good to know that if you are willing to invest, you are also willing to take on risks. If you are prepared to take on this risk, you can be successful in your investments.
Did you like it? Share with your friends
by HollyMontt
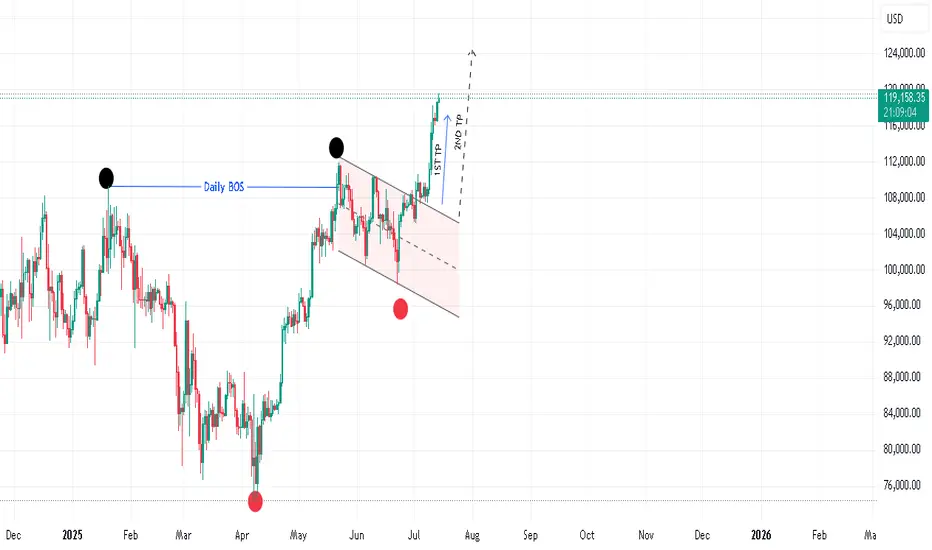
BTC/USD – Bullish Pennant Hints at Potential Continuation >$120KBitcoin remains in a strong uptrend, consolidating just below the $120,000 level after a powerful breakout from the $112K zone earlier this month. Price action has formed a classic bullish pennant pattern on the daily chart, characterized by converging trendlines and declining volume—a textbook setup for trend continuation.
The uptrend remains technically intact, with BTC well above its 50-day SMA ($108.7K) and 200-day SMA ($94.8K), both of which are rising and supportive of bullish momentum. The RSI at 63.2 reflects healthy, but not overbought, conditions, while the MACD maintains a positive crossover above the zero line, though it has started to flatten during the consolidation.
A breakout above the pennant resistance (~$119K) could trigger the next leg higher, potentially targeting a measured move toward the $128K–130K area. However, if sellers manage to push price below the lower pennant boundary and horizontal support at $112K, a deeper correction toward $100K cannot be ruled out.
Bias: Bullish continuation favored as long as price holds above $112K. Watch for a breakout to confirm upside momentum toward new highs.
Time frame: Medium-term (days to a few weeks)
-MW

Bitcoin at the Threshold of the Fibonacci Gate - Silent Strain.⊢
⟁ BTC/USD - BINANCE - (CHART: 1W) - (July 22, 2025).
◇ Analysis Price: $119.209,03.
⊣
⨀ I. Temporal Axis - Strategic Interval - (1W):
▦ EMA9 - ($111.083,72):
∴ Price remains well above the EMA9, with consistent bullish spacing;
∴ The weekly candle closes with strength and full-body integrity above it;
∴ EMA9 slope continues upward, supporting ongoing momentum.
✴️ Conclusion: Short-term structure remains decisively bullish, with trend-following support intact.
⊣
▦ EMA21 - ($103.417,42):
∴ EMA21 is sharply rising and holds significant historical support;
∴ Price remains distanced, but no vertical stretch detected;
∴ Not touched since early 2024 - the bullish cycle is intact.
✴️ Conclusion: Mid-cycle momentum remains strong. No structural weakness under current trajectory.
⊣
▦ WMA200 - ($62.496,26):
∴ Remains deep below current price action - untouched since breakout phase in 2023;
∴ Its angle is now slowly tilting upward - reflecting macro regime change;
∴ Long-term holders remain in command; no gravitational pull is active.
✴️ Conclusion: WMA200 is no longer relevant for tactical reaction, but serves as a structural floor of the cycle.
⊣
▦ Fibonacci Retracement - (Top: $122.056,95 / Bottom: $27.143,79):
✴️ Top: $122.056,95 - (07/14/2025) = 1 Fibo;
✴️ Bottom: $27.143,79 - (10/16/2023) = 0 Fibo.
∴ Price is now within 2.33% of the Fibonacci 1.0 extremity;
∴ Entire move from $27k to $122k retraced cleanly with structural respect to 0.382 ($63.400;62) and 0.618 ($85.800,12);
∴ Current pressure nears full extension, requiring caution;
✴️ Conclusion: Full retracement achieved. Continuation must now be fueled by external influx or will face rejection at golden gate.
⊣
▦ RSI (21) + EMA9 - (RSI: 66.65 / EMA9: 63.73):
∴ RSI remains below 70 - showing momentum without exuberance;
∴ RSI crossed above EMA9 with positive slope;
∴ No divergence present; momentum confirmation continues.
✴️ Conclusion: Silent bullish continuity. No signal of exhaustion.
🜏 ORACVLO ARCANE: (RSI = 66 - No Fibonacci/Guematria convergence).
⊣
▦ MACD (9,21) - (MACD: 7,666.30 / Signal: 5,976.56 / Histogram: +1,689.74):
∴ MACD lines widening - strong expansion phase;
∴ Histogram rising above prior week;
∴ Still in mid-cycle range - not overextended.
✴️ Conclusion: Momentum engine active. No current loss of acceleration.
🜏 ORACVLO ARCANE: (Histogram = 1,689.74 - No convergence).
⊣
▦ OBV + EMA9 - (OBV: 86.27K):
∴ OBV rising cleanly with price;
∴ No divergence detected on weekly timeframe;
∴ EMA9 supportive, confirming accumulation bias.
✴️ Conclusion: Volume structure confirms legitimacy of bullish move.
⊣
▦ Stochastic RSI - (3,3,21,9) - (K: 94.30 / D: 84.53):
∴ Both lines in extreme overbought zone;
∴ No bearish cross yet - but a turn may initiate in next 1-2 candles;
∴ Historical turning points often occur from this elevation.
✴️ Conclusion: Momentum peaking. Vigilance required for reversal trigger in next cycle.
⊣
🜎 Strategic Insight – Technical Oracle:
∴ Price is pressing against the final Fibonacci gate of $122K, with momentum indicators still aligned;
∴ However, overbought pressure is building, particularly on the Stoch RSI.
∴ Breakout will require force; otherwise, a pullback from the threshold is probable.
⊣
∫ II. On-Chain Intelligence – (Source: CryptoQuant):
▦ Exchange Netflow Total - (All Exchanges) - (+920 BTC):
∴ Influx into exchanges suggests potential distribution is being prepared.
⊣
▦ Funding Rates - (All Exchanges) - (+0.008):
∴ Mildly positive; no leverage overheating detected.
⊣
▦ Taker Buy Sell Ratio - (All Exchanges) - (0.959):
∴ Slight taker sell dominance - friction at high prices.
⊣
▦ Spent Output Profit Ratio - (SOPR) - (1.017):
∴ Profitable exits ongoing. Healthy, but could tilt if profit-taking accelerates.
⊣
▦ Realized Cap + (EMA9) - (Rising):
∴ Network is revaluing BTC upward - structurally healthy.
⊣
▦ MVRV Z-Score + (EMA9) - (2.32):
∴ Elevated. Historically a zone where caution is warranted.
⊣
▦ Miner Reserve - (All Miners) - (1.809M BTC declining):
∴ Long-term miner outflows continue - no sudden spike detected.
⊣
🜎 Strategic Insight - On-Chain Oracle:
∴ On-chain data supports the current trend, but with visible friction. Exchange inflow and profit-taking are warning signs that price is now dependent on sustained demand;
∴ This is a zone of silent strain: structurally sound, but tactically stretched. While the broader framework supports continuation, there is no buffer left for error;
∴ Weakness will be exploited if new inflows fail to materialize.
⊣
𓂀 Stoic-Structural Interpretation:
∴ Structurally Bullish - Tactically Suspended;
∴ Tactical Range Caution: ($114.000 / $122.056).
⊣
▦ Codicillus Silentii - Strategic Note:
∴ The CME gap and the proximity to Fibonacci 1.0 have formed a psychological and technical ceiling;
∴ If unbroken this week, the next cycle may revert to (0.786) as reversion.
⊣
▦ Momentum-wise:
∴ RSI remains in the bullish zone (66.65) without entering overbought - a sign of discipline in the ascent;
∴ MACD shows expansion with a growing histogram - no curvature loss;
∴ Stochastic RSI is in extreme overbought (K = 94.30), signaling elevated tension.
✴️ Conclusion: Momentum is intact but strained. A breakout is possible, but failure to continue will invite a flush.
⊢
✴️ Final Codex Interpretation:
∴ Bitcoin stands at the edge of the Fibonacci Gate, within breath of the 1.0 threshold ($122,056); ∴ While structure, momentum, and on-chain flows permit a push higher, the presence of inflows to exchanges, elevated MVRV, and extreme oscillator positioning suggest that the threshold is sacred - and only silence or strength may break it;
∴ Rejection here would not be collapse, but strategic regression to gather force beneath the gate.
⊢
⧉
· Cryptorvm Dominvs · MAGISTER ARCANVM · Vox Primordialis ·
⚜️ ⌬ - Silence precedes the next force. Structure is sacred - ⌬ ⚜️
⧉
⊢

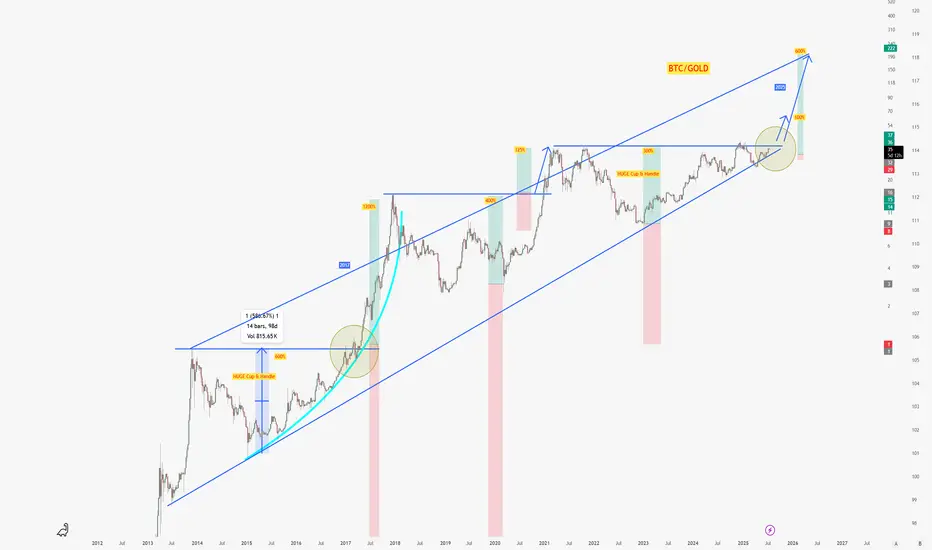
HUGE Cup & Handle On BTC/GOLDAre we in the same situation as in 2017? At that time, BTC followed with a 500% rally. Do you think history is repeating itself?
If we use the same percentages, we'll have a BTC/GOLD rally of 600%. This would mean that BTC could make 250%.
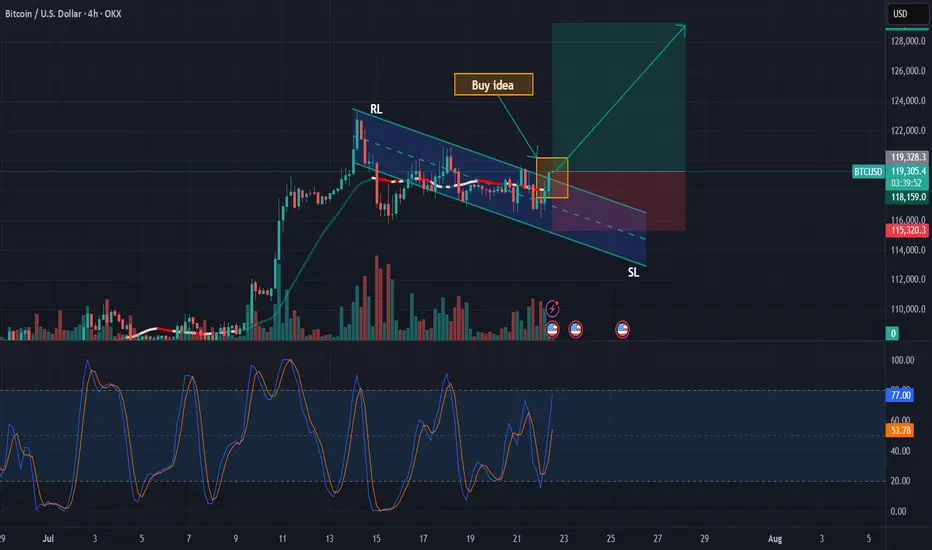
BTCUSD: Buy ideaBuy idea on BTCUSD as you can see on the chart because we have the breakout with force the vwap and the RL by the buyers.
BTCUSDPrice has broken out from the external trendline which has signify for a momentum to move up at this point the overall trend is bullish while we will be expecting sell as retracement for us to reenter to the upside. in this trend we will be targeting a R:R OF 1;3

Range in BitcoinBitcoin has been ranging for nearly 12 days, and based on range-trading strategies, it's now possible to take a position. There's a high probability that the price will move toward the top of the range. For taking positions near the bottom of the range, we need to wait for a trigger since we're trading against the current direction. In case of a breakout above the range, we should be cautious of fakeouts.

BTC USD LONG RESULTPrice had held been in a narrow falling wedge before breaking out with strong volume and held the support order block at the 0.6fib level and expecting to retest before going to the supply zone where TP zone was set.
Price did move as I predicted just missing and leaving our entry behind.
Better Setups ahead 💪💯
_THE_KLASSIC_TRADER_.
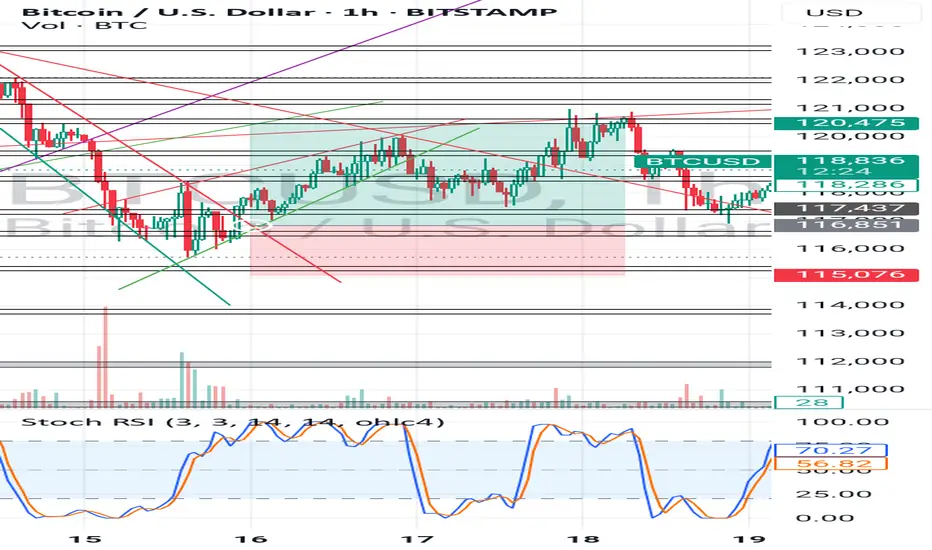


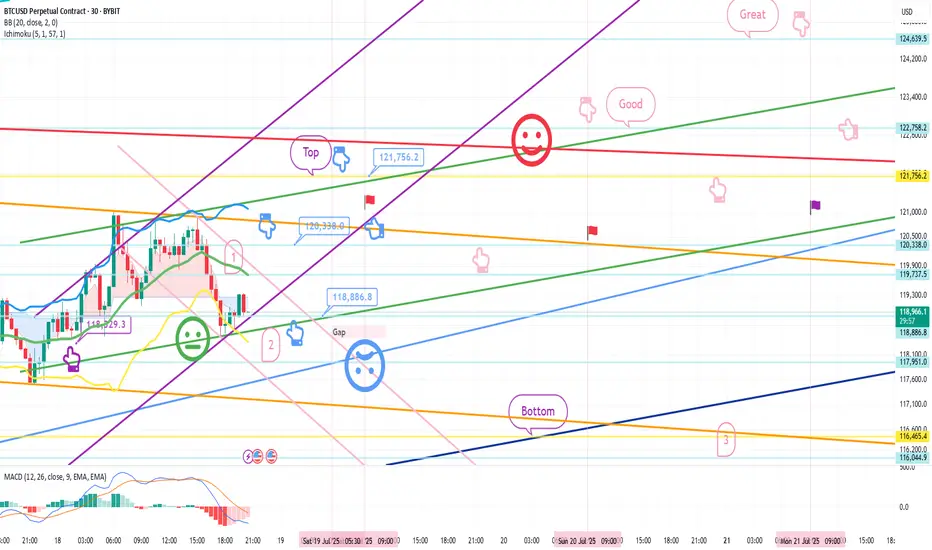
July 18 Bitcoin Bybit chart analysisHello
It's a Bitcoin Guide.
If you "follow"
You can receive real-time movement paths and comment notifications on major sections.
If my analysis was helpful,
Please click the booster button at the bottom.
Bitcoin 30-minute chart.
There is no Nasdaq indicator announcement today.
The mid-term pattern was broken in the morning wave,
but I proceeded as safely as possible.
At the bottom left, I connected the final long position switching section in the analysis article on the 15th with a purple finger.
*When the blue finger moves,
Bidirectional neutral
Short->Long or long waiting strategy
1. Short position entry section of $120,338 / Stop loss price when orange resistance line is broken
2. Long position switching of $118,886.8 / Stop loss price when blue support line is broken
3. Long position 1st target of $121,756.2 -> Target price in the order of Good and Great
If it falls immediately from the current position or
touches the top once and falls, it is a vertical decline condition.
If it falls immediately, it is the final long waiting in section 2.
(When the sky blue support line breaks, the stop loss price is the same)
From the sky blue support line break, the 6+12 section is where the mid-term pattern is restored,
and it is roughly the bottom section.
If the strategy is successful, I have left a simulation with a pink finger on the right,
so please check the switching and profit-taking section,
and operate safely in each position, long, short, and no position, based on whether the purple support line breaks from the current position.
From the green support line break, the low point of today's daily candle is broken,
so it would not be good for a long position, right?
Up to this point, please use my analysis article only for reference and use,
and operate safely with principle trading and stop loss price.
Thank you.
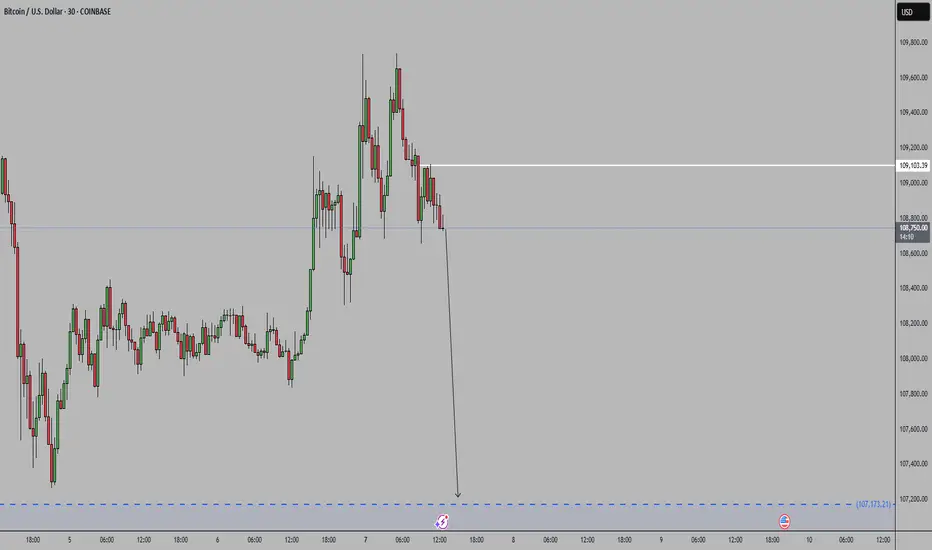
BITCOINBTC is showing strong bearish momentum. Price has broken below key support and is forming lower highs and lower lows, indicating continuation of the downtrend.
Until we see a clear reversal pattern or reclaim of resistance levels, I expect further downside.
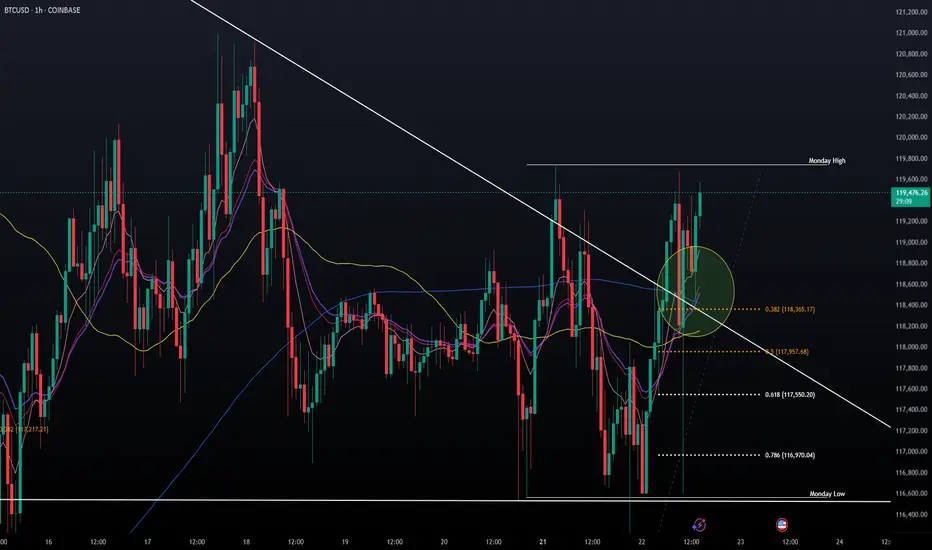
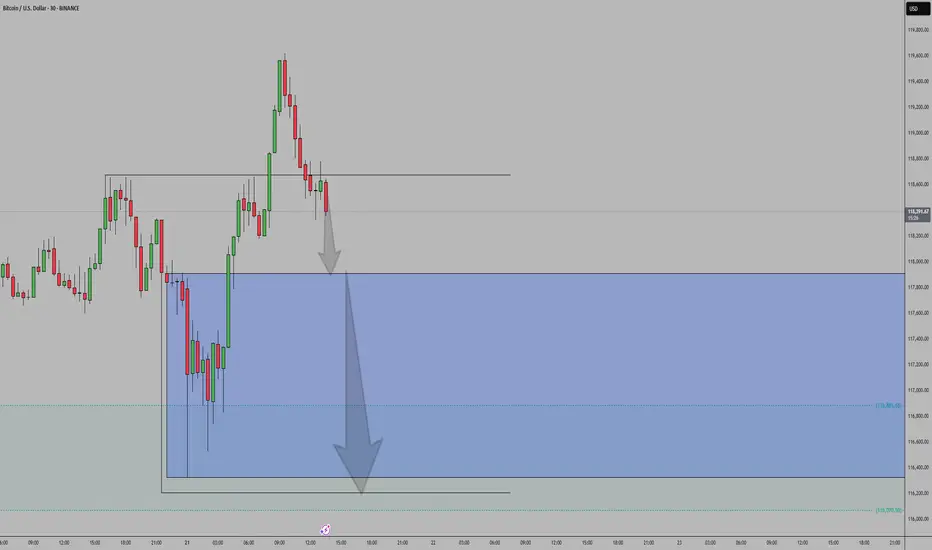
BTCUSD Analysis – Supply Pressure vs Demand Rejection 📊 Overview:
This BTCUSD 2-hour chart is giving us a clear structure of how price is currently reacting between a strong demand base and a descending trendline supply. We're at a critical decision point, where both buyers and sellers are gearing up for a potential breakout or breakdown. Let’s break it down level by level.
🟢 Demand Zone – Major Support Holding Firm
The Major Support Zone marked at the bottom of the chart is not just any random area—it has been tested multiple times and acted as a launchpad for bullish moves previously. This is also aligned with the Previous Reversal Zone, which adds confluence to this demand base.
Price dipped into this zone and immediately rejected with strong bullish candles, showing aggressive buyer interest.
This is a high-probability area for long setups as long as price stays above it.
You’ve noted on the chart: “If market closes this supply, we will double it” – that makes sense because a confirmed hold above this base increases the probability of upside continuation.
🔻 Trendline & Supply Zone – The Wall Ahead
Moving up the chart, price is being pressured by a descending trendline, acting as dynamic resistance. This trendline is not just drawn for decoration—it has rejected price at least twice already, and is also intersecting with a minor horizontal resistance zone.
This creates a confluence of resistance, making it a tough wall for buyers to break through without strong volume.
You’ve labeled it as “Evidence 1”, meaning the first confirmation of supply reacting here.
If BTC fails here again, we could easily see another pullback to the 116,800 – 116,400 range.
⚖️ QFL Pattern in Play
The QFL (Quick Flip Logic) is in action, where price aggressively dropped and formed a base, followed by a sharp move up. Price is now attempting to return to that base (demand zone) for a potential flip back upward.
If QFL holds and price breaks above the trendline, this will be a strong reversal confirmation.
This aligns with many institutional trading strategies which look for such formations near support zones.
📈 Potential Bullish Scenario:
Break above the descending trendline resistance
Price sustains above Minor Resistance Zone (around 118,800 – 119,600)
Next target: Major Resistance Zone between 120,800 – 121,200
This could create a higher-high structure and resume overall bullish trend
📉 Potential Bearish Scenario:
Failure to break the trendline
Rejection leads to price retesting the Major Support
If that zone breaks cleanly (especially below 116,400), price may drop toward 115,600 or lower
This opens up a possible short opportunity depending on price action and momentum
🎯 Conclusion:
This chart is a textbook example of consolidation between major zones. Bulls are defending hard at the bottom while bears are pushing down from the top. The direction of the breakout will dictate the next major move. Until then, wait for confirmation, avoid early entries, and let the market show its hand.
🧠 Patience = Profits.
🕒 Chart Timeframe: 2H
📌 Strategy in Focus: Supply & Demand Zones, Trendline Breakout, QFL Base Pattern
📍 Sentiment: Neutral-Bullish (Watching Trendline Reaction)

Final Push?In a previous analysis I used the range of the yellow triangle as grounds for suspicion that the bull run may be over. Now, thankfully, it appears to have formed a support on top of this triangle, instead.
I believe its possible for a big breakout here that will pop out of the red log zone, which would signal the top of this cycle/bubble.
However, for this we will need lots of volume, for which we need lots of euphoria.
$192,000 seems to be the target based on the target of the yellow triangle drawn, as well as the fib retrace. The fact that we are consolidating above $115,000 speaks to me that we still have plenty of juice, but moving the price at this market cap will require a lot of juice. Thus, I have ladder sells starting at $130,000

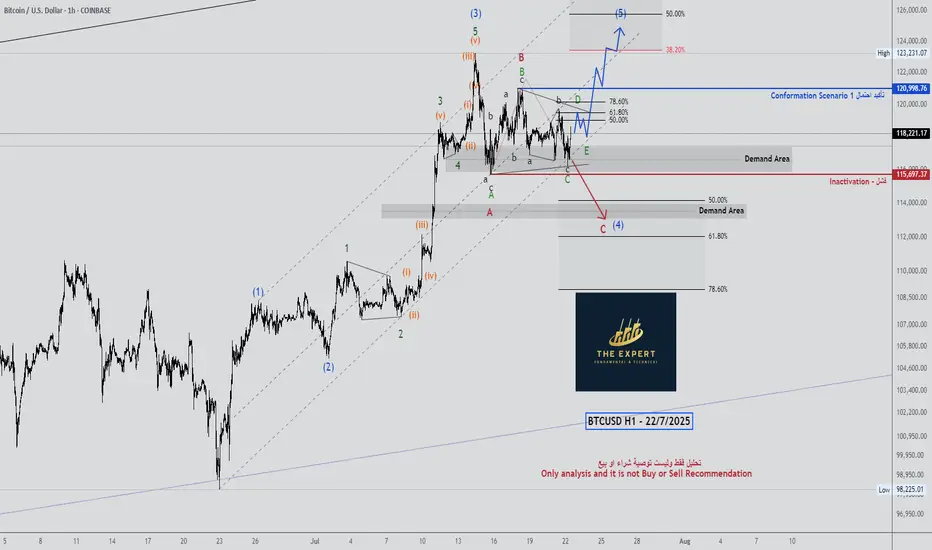
BTCUSD H1 - 22/7/2025BTCUSD H1
As shown, we are in wave 4 with 2 scenarios:
1- Wave 4 is triangle.
2- Wave 4 is Zigzag.
Thanks
Bitcoin BTC net -50 = mild bearish or neutral bias
Not strong enough alone to trade on — check price action, key levels, and other factors like ETF flows or macro news.
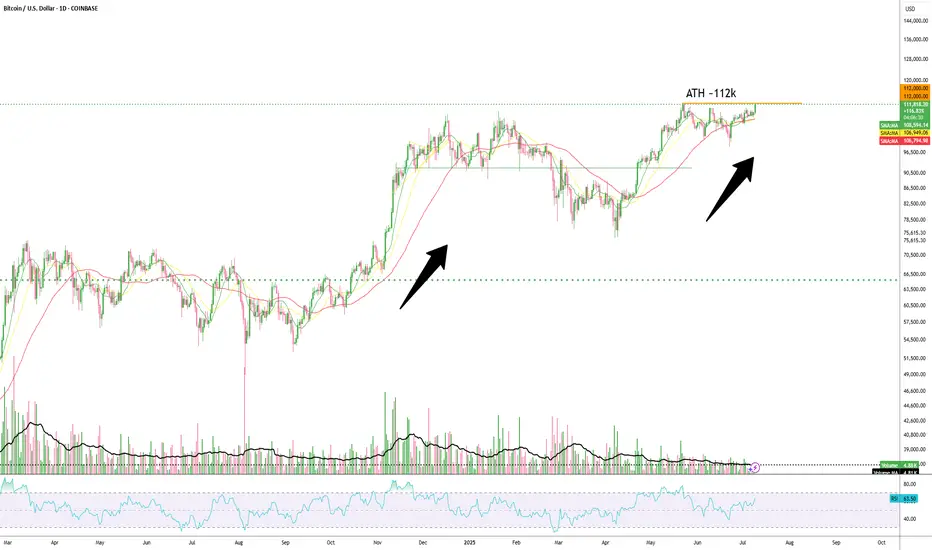
BITCOIN BREAKOUT IMMINENT (120K)The Trend is your Friend. Bitcoin’s current action is the kind of bull‐market digestion you want to see before the next big surge. We’ve powered up from roughly $50 K on the Trump‐election narrative to flirt with all‐time‐high territory around $112 K, and now we’re simply consolidating in a tight $100 K–$110 K range. What really grabs my attention is how volume has dried up inside that band: fewer sellers stepping up means less fuel for a deep pullback, and an ebb in liquidity often precedes the kind of compressed buildup that launches a sharp move. That liquidity squeeze tells me smart money is biding its time rather than panicking out, and that sets the stage for a clean breakout once a new catalyst arrives.
Technically, the setup could hardly be neater. The 10-, 21- and 50-period moving averages have converged, running almost in lockstep. When those averages come together like train tracks, it signals a market in “healthy pause” — neither exhausted by an overextended rally nor capitulating under bearish pressure. It’s the kind of feature you love to see: price has had its run, it’s caught its breath, and it’s ready to go again on fresh conviction. Meanwhile, the RSI sits squarely in the middle of its range, neither overbought nor oversold, meaning there’s plenty of room for buyers to step in without an immediate pullback risk from extreme readings. In other words, momentum indicators are calm, not frothy or fearful, which further supports the case for a measured upward thrust rather than a sudden crash.
On the macro side, fundamentals are lining up, too. Monthly passive inflows into Bitcoin ETPs and ETFs continue at a robust clip, with institutions quietly adding to their positions out of the spotlight. If the Fed pivots toward rate cuts later this year, capital that’s been chasing yield elsewhere could flow back into risk assets — and Bitcoin, with its “digital gold” narrative, stands to gain especially when you consider its roughly $2 trillion market cap versus gold’s $20 trillion. That leaves a lot of upside potential if institutional demand keeps accelerating. Even more compelling: real‐world use cases for blockchain—everything from proof‐of‐ownership to decentralized finance—continue to mature behind the scenes, reinforcing Bitcoin’s narrative as not just a speculative asset, but a foundational piece of tomorrow’s financial system.
Of course, we can’t ignore the risks. We’ve already seen Bitcoin price near $112 K once, and there’s always the chance it carves a frustrating double-top if it stalls again. External narratives—Middle‐East tensions, renewed Ukraine tensions, fresh tariff skirmishes—could throw cold water on the rally and trigger a quick sell-off. But given the current setup—low‐volume consolidation, converging moving averages, balanced RSI and steady capital flows—a 10 % push toward $120 K feels not just possible but probable. Keep your eye on $112 K as your breakout trigger, size your positions sensibly, and plan your stop-loss around the lower end of the range. If Bitcoin can clear that level on strong volume, we’re likely to see this bull market extend rather than roll over into a double-top scenario. Happy trading, stay disciplined, and let’s see where this market takes us next!
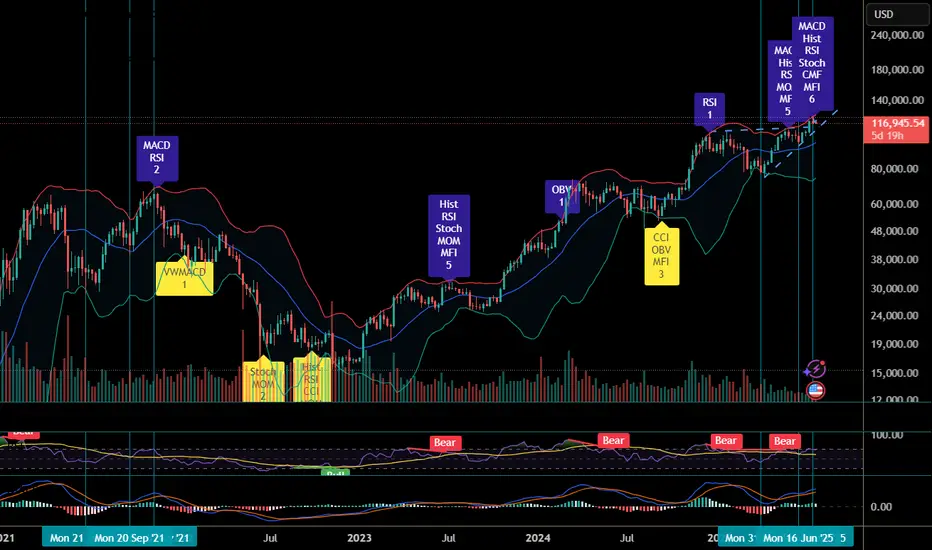
Comparison to 2021
I think the structure so far is quite similar to that of 2021.
1. Massive run up, piercing the upper BB and quickly falling down to the lower bound.
2. Double bottom on the lower BB.
3. Second run up, touching upper BB with a retracement to the midline.
4. Another run up higher, this time it seems it couldn't pierce the upper BB, but we already have some divergences and MACD is about to cross over, too.
If history rhymes, we should see next a drop to the midline, potentially overshooting it. The midline will then serve as an upper bound to the PA, before it drops to the lower bound and the ride continues.
Of course, it could also try to pierce the upper BB first, because of the sheer amount of trade deals (🌮)...
btc live or dieOne more leg up is what we re waiting for now so far . 130k+ is the main target for us after holding 118k for days. as long as 112k holds we re not in the end of cycle.

BTC Long and ShortFor chart pattern, TP1 Reahced , mostly will go TP 2.Target swing high (TP 2) and Counter for swing low,after reaching TP2. What do you think guys
BTCUSDThe market general trends sideways we haven't seen a major breakout to the upside or downside, so for this morning we will be favoring the upside b targeting 1:3, then we wait to see how price playout
