BTCUSDWe are favoring more of the sell sides to give us a better risk to reward while the buy side we will be risking a little on it.
BTCUSD trade ideas

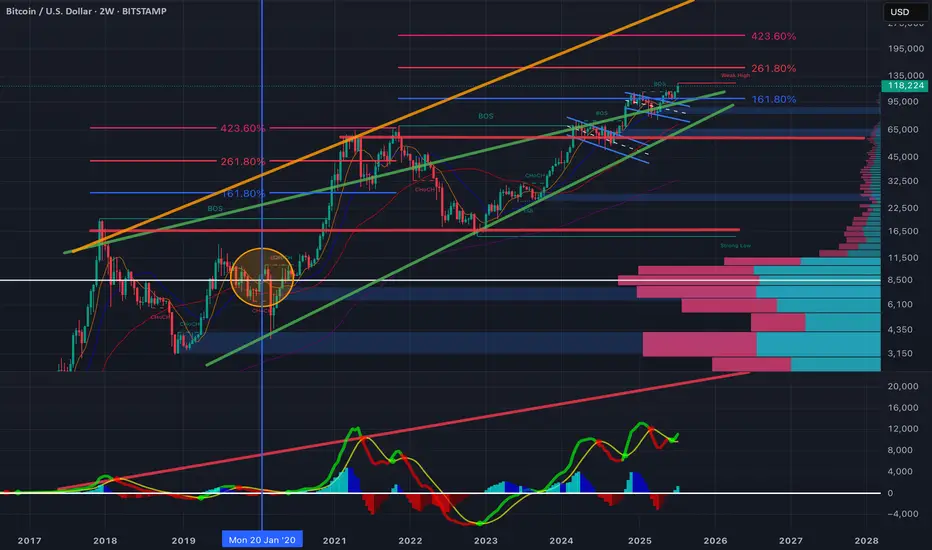
$BTC Is moving alongBTC‑USD | 2‑Week Chart – Quick Read
Structure & Trendlines
* Price continues to respect the 2019‑2025 rising green channel and has flipped the 2017‑2021 orange trendline from resistance to support.
* A fresh break‑of‑structure above the 2021 ATH confirms continuation. Invalidation sits near the channel base / 65‑70 k demand zone.
Fib Road‑Map
* 1.618 extension (\~90 k) was reclaimed and back‑tested.
* Next confluence levels are the 2.618 (\~180 k) and 4.236 (\~240 k) extensions, matching thin volume nodes on the VPVR.
Momentum
* Multi‑time‑frame RSIs have broken their downtrends and pushed firmly bullish, echoing the 2020 breakout posture.
* The 2‑week MACD histogram has flipped positive with a higher‑low signal—momentum rebuilding.
Volume Profile
* Highest historical volume sits 15‑35 k; above 120 k liquidity thins sharply until ~160 k.
Near‑term downside risk
* The last episode of aggressive Fed rate cuts (March 2020) triggered a sharp washout before the subsequent melt‑up.
* Cuts keep getting deferred because unemployment remains low and jobs data solid; if a sudden pivot arrives on weakening data, a risk‑off flush toward the mid‑channel zone (≈ 80‑90 k) is possible before higher targets re‑engage.
Macro uptrend intact; pullbacks to the channel centre are buy‑the‑dip territory while momentum and structure favour an eventual 161.8 → 261.8 push, but stay nimble for policy‑driven volatility.
bitcoin sell setup.price dropped below previous low and remain down there for a long time, this shows sellers strength and willingness to push down. we expect a sharp move from here

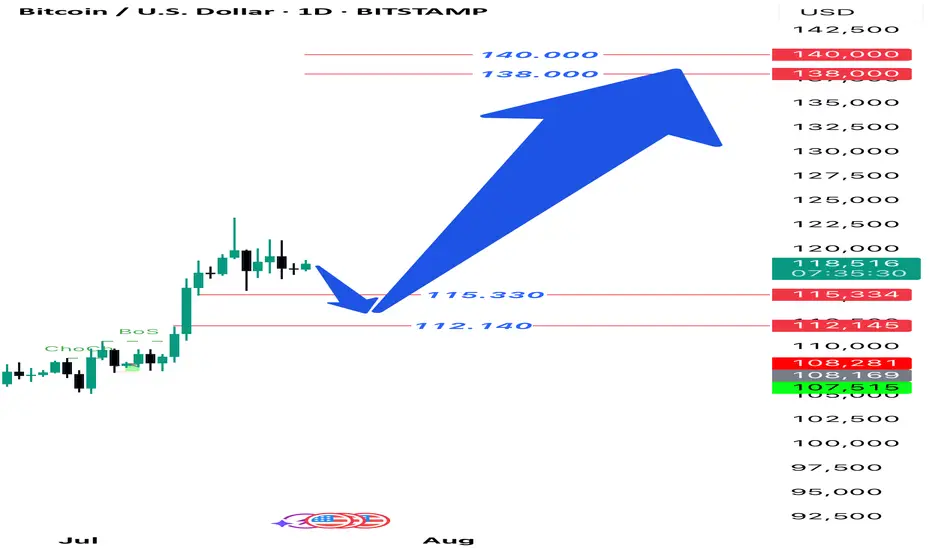
BTCUSD Daily Setup In the daily timeframe, Bitcoin is in an upward trend. We expect it to correct to the fvg of 115,330 to 112,140. If the daily candle does not close below this fvg, we expect Bitcoin to grow and rise to the range of 138,000 and 140,000. Then we will have a large correction and decline from the range.
#XAUUSD #ICT #OrderBlock #FundedTrader #TradingStrategy
Jul 20 | Crypto-market reviewNew Crypto-Sunday market review video, where I share my current analysis on the trend structures of BTC, ETH, SOL, XRP, HYPE and other alt- and mem-coins of interest to my, highlighting key support and resistance zones to watch in the coming sessions.
Charts featured in the video
BTC
ETH
XRP
(!) SOL
(!) HYPE
(!) TRUMP
BRETT
(!) FET
RENDER (Weekly)
(!) DOG
(!) MOG
Thank you for your attention and I wish you happy Sunday and great trading week!
If you’d like to hear my take on any other coin you’re tracking — feel free to ask in the comments (just don’t forget to boost the idea first 😉)

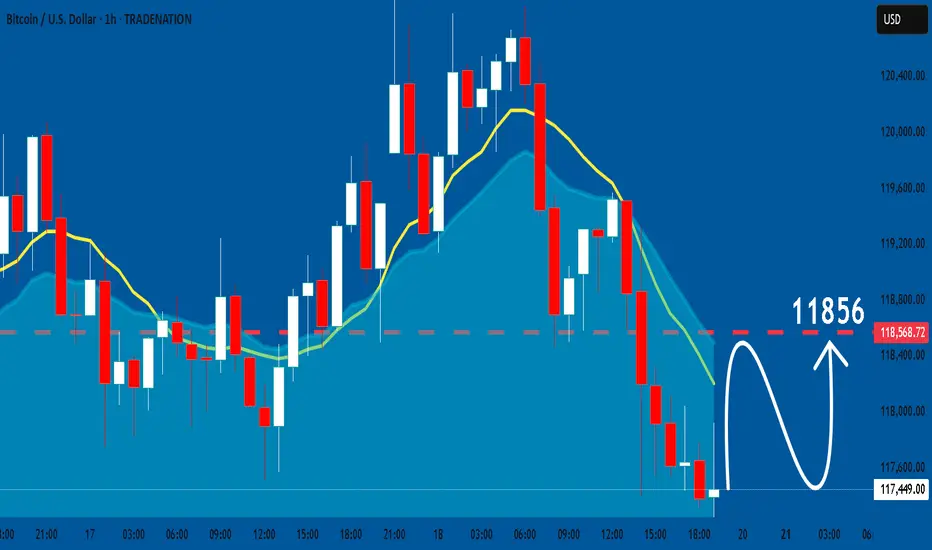
BTCUSD: Bullish Continuation
Looking at the chart of BTCUSD right now we are seeing some interesting price action on the lower timeframes. Thus a local move up seems to be quite likely.
Disclosure: I am part of Trade Nation's Influencer program and receive a monthly fee for using their TradingView charts in my analysis.
❤️ Please, support our work with like & comment! ❤️
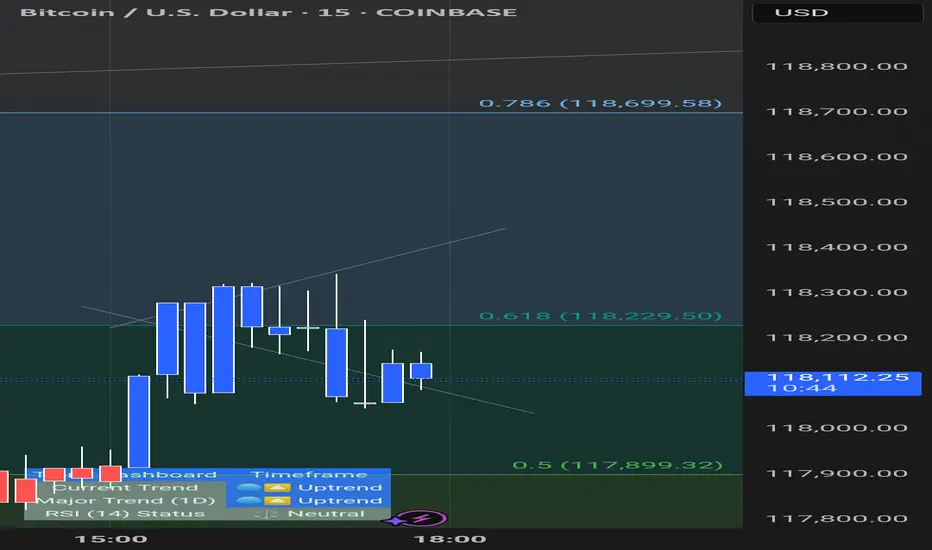
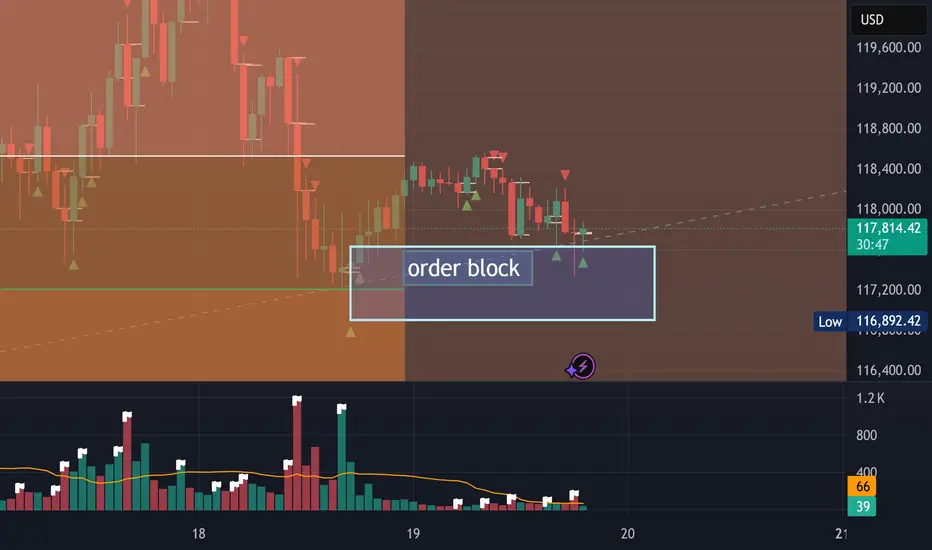
btc usd buy setupThis BTC/USD 1H setup is a Smart Money Concept (SMC) long trade, built on liquidity, market structure shift, and mitigation. Let’s break it down:
Setup Breakdown
1. Market Structure
Previous bearish leg created a deep selloff.
Price swept a low, broke above a structure (BoS = Break of Structure) → indicating possible reversal intent.
2. Liquidity Sweep
See the “x” mark near the top and the large wick that tapped above the previous high?
That was a buy-side liquidity grab.
Price then reversed aggressively, hinting it was a stop hunt, not genuine buying.
3. Break of Structure (BoS)
Confirmed bullish intent.
The BoS you marked shows that the last lower high was broken, turning structure bullish.
4. Entry
Price returned into a demand zone (pink box) after the BoS.
The area aligns with:
Demand zone (bullish OB)
Fair Value Gap (FVG) just above it.
The ascending triangle pattern in the recent candles added confluence of bullish pressure before breakout.
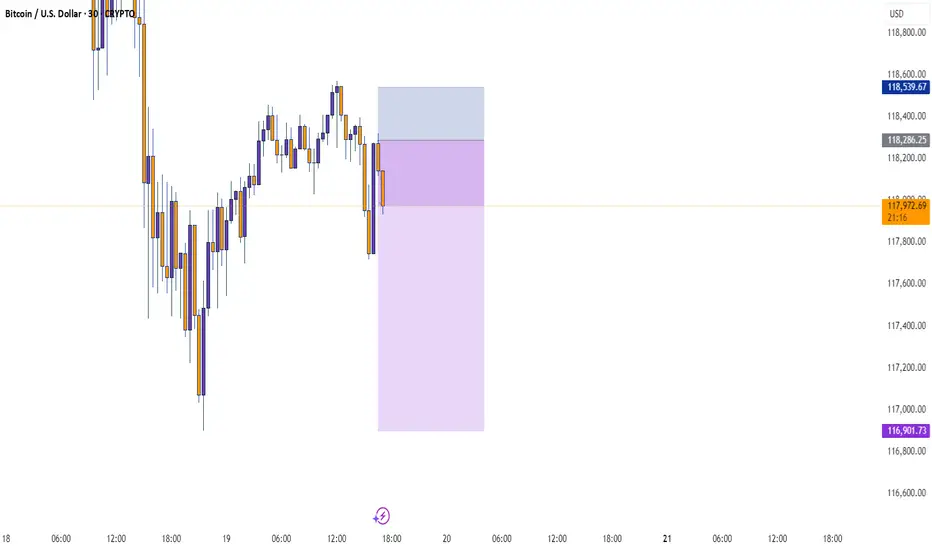
5. FVG & Target Zone
You're targeting the FVG + Supply Zone marked in light blue around 119,900–120,400.
It's aligned with:
Liquidity cluster
Previous supply structure
That’s a logical area where price might slow down or reverse.
Trade Plan
Entry: After price retests demand and shows bullish signs.
Stop Loss: Below the demand zone and recent swing low (~116,585).
Take Profit: Top of the FVG/supply zone (~120,400–121,250).
Risk-Reward: Solid R:R ~1:3 or higher.

BTC - Breakout, Fakeout… or Loading Zone?BTC is back inside the $116K–$117K demand zone — same level that launched the last breakout.
But this time? Consolidation. Stoch RSI stuck mid-range. Unclear momentum.
The Hull Suite Strategy nailed the previous breakout with clean stacked buys — but it’s showing hesitation now.
This is where strategy testing really matters. Not every system handles chop the same.
📊 We test these setups across multiple variations — especially in zones like this where most signals lose edge.
Support flip or breakdown brewing? Watching closely.
—
#BTCUSD #Bitcoin #HullSuite #StrategyTesting #BacktestBetter #QuantTradingPro #CryptoAnalysis #TradingView

Braxons Group: How Cryptocurrency Became Part of Everyday SpendiOver the past five years, cryptocurrency has gradually moved beyond the narrow confines of a speculative asset toward what it was meant to be from the start — a fully functional means of payment. In July 2025, a study by Bitget Wallet confirmed a significant shift in consumer behavior: millions of users worldwide now use digital assets to pay for goods, games, and travel.
Braxons Group analysts see this not just as a trend, but as a clear sign that crypto is entering a mass-adoption maturity phase.
Crypto in Shopping: From Enthusiasts to Households
According to the study, 35% of users now use cryptocurrency for everyday purchases — not only for digital goods, but also for paying for food, services, and essential products.
Braxons Group notes a sharp rise in crypto payment integration with POS terminals and online marketplaces, especially in Southeast Asia, where digital wallets often replace bank cards. The growth is driven by low fees, lack of bank control, and instant settlements — particularly via USDT and BUSD.
Gaming: The Key Engagement Driver
36% of users regularly use cryptocurrency for in-game purchases and Web3 applications. This comes as no surprise: NFT items, premium memberships, and tokenized game assets are now core components of most gaming economies.
Braxons Group highlights that Gen Z and millennials form the backbone of this new crypto audience. Their willingness to spend tokens on in-game content demonstrates high adaptability and low entry barriers.
This is an important investment signal: companies operating at the intersection of crypto and gaming will likely become dominant growth drivers over the next 3–5 years.
✈ Travel: Crypto Crosses Borders
Around 35% of respondents use cryptocurrency for booking tickets, hotels, and travel services. For Braxons Group, this validates the hypothesis that crypto is the ideal tool for global users — eliminating currency restrictions, reducing banking fees, and enabling direct bookings without intermediaries.
Among older demographics (Gen X), trust in crypto for high-value transactions is increasing. This marks a shift in the market: a sector once dominated by speculation is now becoming practically useful for everyday needs.
Regional Differences
The Bitget study revealed notable geographic patterns:
Southeast Asia — leader in everyday crypto payments (up to 41%)
Africa — active use for education payments
Latin America — strong e-commerce adoption (up to 38%)
Middle East — growing interest in high-ticket purchases (cars, tech, luxury goods)
For Braxons Group, this means the decentralized payments market is becoming multi-layered and globally fragmented, requiring region-specific solutions.
Braxons Group’s Conclusion
Our team concludes that cryptocurrency is evolving from an investment class into a transactional tool. It no longer makes sense to view digital assets solely as a store of value or speculative vehicle.
What was once an experiment is now daily reality:
Gamers buy NFTs and passes with tokens.
Households purchase groceries with stablecoins.
Travelers book accommodation with ETH.
The next step? Integrating cryptocurrency into banking and government systems. For businesses, this means embedding crypto infrastructure is now a must-have for digital competitiveness.

It will be bullish but a retest must happenBTC/USD Technical Forecast: A Structurally Mandated Retracement Before the Next Major Expansion
The current market structure on the BITSTAMP:BTCUSD 4-hour timeframe strongly suggests a high-probability corrective phase is imminent prior to a continuation of the macro bullish trend. Our analysis identifies a confluence of factors, primarily a pronounced momentum divergence and significant market inefficiency, that necessitate a retracement to key support zones before a new leg higher can be sustained. The overarching strategy is to anticipate this pullback as a high-value accumulation opportunity .
Confluence of Bearish Catalysts for the Short-Term Correction:
Class A Bearish Divergence: A clear Class A bearish divergence is present between price action and the Stochastic oscillator. While the price has forged higher highs, the oscillator has printed consecutively lower highs. This momentum decay is a classic leading indicator of trend exhaustion and signals an impending shift in order flow from bullish to bearish in the immediate term.
Market Structure & Liquidity Voids (Fair Value Gaps): The preceding impulsive leg-up, while aggressive, was inefficient. It left a significant Fair Value Gap (FVG) , or a liquidity void, in its wake. According to the Power of Three (PO3) framework (Accumulation, Manipulation, Distribution), the market is now in a consolidation/distribution phase post-expansion. To engineer the liquidity required for the next major mark-up (distribution), a " manipulation " leg downwards is structurally required. This move will serve to mitigate the FVG and sweep sell-side liquidity resting below the recent lows.
Projected Price Path & Key Levels of Interest:
The Trigger - "Bearish Gate": A definitive break and close below the level marked as the " Bearish Gate " will serve as the primary confirmation for the commencement of this corrective scenario.
Corrective Targets: The retracement is expected to navigate towards the Points of Interest (POIs) nested within the FVG, as marked on the chart (Target 1, Target 2, Target 3).
Primary POI (Target 3): The ultimate objective for this retracement lies within the $110,000 - $111,000 confluence zone . This area represents a powerful technical, a key Fibonacci extension, and the macro ascending trendline.
The Bullish Continuation Scenario:
Upon successful mitigation of the FVG and a confirmed bullish reaction from our primary POI, we anticipate the resumption of the primary bullish order flow. This corrective phase will have effectively cleared out weak hands and built the necessary liquidity for a sustained move. The price is then projected to trend upwards within the blue ascending channel, with the ultimate target being the buy-side liquidity resting at the major resistance block located in the $124,000 - $125,000 region.
Conclusion:
The current setup presents a classic counter-trend opportunity within a macro bullish framework. The confluence of momentum divergence and structural necessity for FVG mitigation provides a high-conviction thesis for a short-term sell-off.

Capital Doesnt Lie - The Energy ProblemPart 1: THE ENERGY PROBLEM
Everything we do produces energy, even prayer. If you have ever felt tired after praying for someone, that's because you spent energy and made an effort; let's call that energy 'capital' . Capital begins with effort, whether you see it or not.
The problem is: how do we use it or store it?
Imagine that energy as an invisible ball growing in front of your head. Every time you work and think, you're growing that invisible energy ball of capital. So, how do you get it in your hands? You can plant a cucumber, craft a chair, or clean your house. It's your order, attention, time- all energy made visible in the house, stored in the cucumber or the chair.
Genesis 3:19
'By the sweat of your face you shall eat bread…'
Verse Comment: It doesn't say 'by luck' or 'by inheritance.' It says by sweat. That's energy. That's effort. That's the value produced.
Proverbs 14:23
'All hard work brings a profit, but mere talk leads only to poverty.'
Verse Comment: Effort always creates something. Even spiritual labor, such as intercession, leadership, and parenting, is a form of value creation.
But here's the issue. That cucumber plant? It goes bad. That chair? It breaks. That clean house? Dirty again in 24 hours."
Everything we do has a cost; it's not free. Energy fades unless you can find a way to store it longer than the life of the thing you created.
So if everything fades, the big question becomes: How do you store the surplus of your energy, (the part you don't need today) so it doesn't fade by tomorrow?"
That's the foundation of all capital. Of all value. And of all wealth. And it starts with understanding where your energy is going, and what it's pouring into.

BITCOIN LOG UPDATESThis meaningful indicators on logarithmic, Since 2022- now I still used this on BITCOIN.
it works, some of my followers doubt this but its fine, we might see 170k per bitcoin by end of this year? This predictions base on the logarithmic , this indicator shows how the supply works with only 21M bitcoins, unlike other commodities. Bitcoin is the most followed commodities on this indicator I rarely used.
Youve come here so far to know bitcoin, here is my chart for this year. It will keep Bitcoin hard to buy until it reached a million per coin, then the public regret it.
Keep the word DCA. Goodluck.
Holding it is the key.

$BTC dominance still progresses !bitcoin rsi and macd still is very dominant. aswell as the reversal that just happened in the past few hours.
i look to see 120k BTC by tuesday afternoon. at 1pm est time. considering all chart indications that i use. stay tuned and follow for more.

Order Block reached looking for a breakout to our Target of 132KWe saw a bottom when we hit just below 116 and 117 has been showing good support. Bulls are building up for a push up to a new high again. I have targets of 128-132K and the energy in the Fibs show we are likely going to break 160k this summer in the next few weeks or months.
A small pull back for Btc A small pull back for Btc , in the weekly it will look like a fake out but it’s a wait and see

CRYPTO-BTCUSD-SHORT TERM- SELL-SCALP PREDICTIONThe market made an impulsive move to the downside Friday 7/18/25 starting at 2am, leaving a FVG on the hourly, Price has retraced back to the hourly FVG around 118,511, expecting the market to temporarily sell off before move back to the upside. First TP is 116,914.

SellRejection Level
Daily Volume
Market Structure Shift
London US Session
Trend Line Break
Untapped Order Point
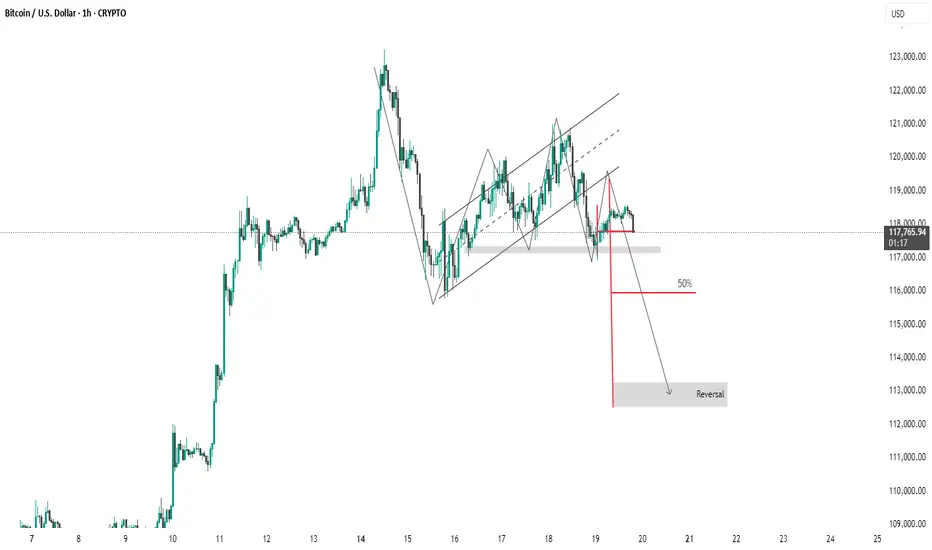
BTC #1-hour Bitcoin (BTC/USD) chartThis 1-hour Bitcoin (BTC/USD) chart shows a bearish setup following a breakdown from a rising channel. Price is currently testing a support zone around $117,000. A potential continuation move is projected down toward the $113,000–$114,000 area, where a reversal is anticipated. The red arrow indicates the expected bearish move, supported by prior structure and trend shift.
thanking you
Bitcoin in Tactical Suspension - Beneath the Compression Veil.⊣
⨀ BTC/USD – BINANCE – (CHART: H1) – (July 19, 2025).
◇ Analysis Price: $118,192.34.
⊣
⨀ I. Temporal Axis - Strategic Interval - (H1):
▦ EMA9 - (Exponential Moving Average - 9 Close):
∴ Price: $118,192.34 | EMA9: $118,176.07;
∴ EMA9 is currently being pierced by price - neither clearly above nor decisively rejected;
∴ The EMA9 has flattened - signaling short-term equilibrium tension, not momentum dominance;
∴ Price candles are compressing into the EMA9 without thrust - indecision at the microstructure.
✴️ Conclusion: Logic sealed - EMA9 reflects tactical stalling; energy coiled at surface level.
⊢
▦ EMA21 - (Exponential Moving Average - 21 Close):
∴ EMA21: $118,199.53 - now above current price, acting as immediate tactical resistance;
∴ A minor bearish slope is forming in EMA21, reflecting recent downside pressure;
∴ Price failed to sustain any candle close above this level in the last 5 sessions - confirming resistance activation.
✴️ Conclusion: Logic sealed - EMA21 has turned from guide to barrier; tactical trend favors compression below.
⊢
▦ EMA50 - (Exponential Moving Average - 50 Close):
∴ EMA50 stands at $118,400.31, well above both price and the shorter EMA's - defining a ceiling of short-term exhaustion;
∴ Its curve is turning sideways, indicating that dominant upward momentum has faded;
∴ The last time price touched EMA50 was during the failed attempt to reclaim the upper Bollinger band - sign of rejection.
✴️ Conclusion: Logic sealed - EMA50 confirms the upper boundary of compression; the short-term trend remains capped.
⊢
▦ Bollinger Bands - (21 SMA, 2 Standard Deviations):
∴ Current BB range:
• Upper Band: $118,586.19;
• Lower Band: $117,291.33;
• Midline - (SMA21): $117,938.76;
∴ Price sits marginally above the midline, but beneath the upper band - indicating a neutral stance within the envelope;
∴ Bands are in a state of mild contraction, reflecting reduced volatility and lack of decisive breakout pressure;
∴ Price has failed to close above the upper band on multiple attempts, suggesting exhaustion without thrust;
✦ Tactical Signal:
• The flattened curvature of the bands and the centering of price near the midline indicates that the market is in compression;
• This condition favors mean-reversion trades or breakout anticipation setups, but lacks directional conviction;
• No squeeze pattern is imminent - but energy is coiling slowly.
✴️ Conclusion: Logic sealed - Bollinger structure is balanced, with compression overtaking directional thrust; breakout not yet awakened.
⊢
▦ Volume + EMA21 - (Tactical Volume Profile H1):
∴ The latest H1 volume candle registers 9 (unit scale), significantly below the average trend of the prior days;
∴ There has been a consistent decline in volume since the spike observed near the $120k rejection zone - participation is fading;
∴ Volume EMA21 is now visibly above most recent volume bars, signaling that market energy has dropped beneath its tactical baseline;
✦ Tactical Diagnosis:
• A market with low volume near compression zones often reflects lack of initiative, not calm;
• The absence of sellers is not strength - it is hesitation;
• The lack of follow-through volume confirms that current price action is drifting, not being driven.
∴ No volume-led breakout is forming - the structure is floating within silence.
✴️ Conclusion: Logic sealed - tactical volume profile confirms stasis; market awaits external spark to ignite movement.
⊢
▦ RSI (21) + EMA9 - (Relative Strength Index – H1):
∴ RSI value: 48.13, EMA9 of RSI: 47.86 - both seated precisely on the neutral axis (50), indicating momentum equilibrium;
∴ RSI has been flatlining between 45/50 for several hours, reflecting a lack of directional force from both bulls and bears;
∴ The minor bullish crossover of RSI over its EMA9 is present, but lacks slope, strength, or historical reliability in the current formation;
✦ Interpretation Layer:
• This is a classic pause zone - RSI not weak enough to signal reversal, not strong enough to suggest advance;
• The close proximity of RSI and its EMA9 suggests a market suspended in technical indecision;
• No bullish or bearish divergence is visible - just momentum silence.
∴ Tactical RSI echoes the broader reading: structure without drive, energy held in restraint.
✴️ Conclusion: Logic sealed - RSI reflects equilibrium; momentum direction is undefined and dormant.
⊢
▦ MACD (9,21) - (Tactical Momentum Engine - H1):
∴ Current MACD Line: (+165.21), Signal Line: (+188.36) - forming a bearish crossover, with the MACD line now trailing the signal line for multiple candles;
∴ The histogram is negative and expanding, confirming that bearish momentum is actively growing, not stalling;
∴ The slope of the MACD line has turned definitively downward, with no flattening in sight - this indicates a sustained momentum bleed;
✦ Tactical Interpretation:
• The momentum crest occurred near $119,700, and since then, MACD has been fading consistently;
• Price has failed to reclaim the MACD highs despite proximity, suggesting a divergence in effort vs. energy;
• This is not a false cross - but a validated tactical downturn with histogram acceleration.
∴ The engine beneath the structure is declining in output - the wheels turn, but they no longer drive.
✴️ Conclusion: Logic sealed - MACD confirms tactical momentum decay; the engine is reversing beneath the surface.
⊢
▦ Stochastic RSI (3,3,21,9) - (Short-Term Momentum Oscillator - H1):
∴ %K: 51.29, %D: 68.32 - a confirmed bearish crossover has occurred, with %K now beneath %D and both values descending;
∴ The oscillator has recently exited the overbought region (>80) and is now transitioning through the mid-zone, reflecting short-term loss of thrust;
∴ Price has failed to respond to prior overbought readings with continuation — indicating momentum dissipation without execution;
✦ Microstructure Insight:
• The current descending arc of %K + %D shows that micro-traders are unwinding positions;
• The zone between 50/70 is a tactical fading region, not a place of strength;
• Absence of a rebound in %K suggests that short-term buyers are standing down.
∴ This oscillator confirms that momentum is not only absent - it is actively declining at the tactical level.
✴️ Conclusion: Logic sealed - short-term momentum cycle is unwinding; compression reigns over velocity.
⊢
▦ OBV + EMA9 - (On-Balance Volume with Tactical Smoothing - H1):
∴ Current OBV: (–89.21K, EMA9 of OBV: –89.02K) - OBV remains slightly below its moving average, indicating a net negative flow of volume;
∴ While price has drifted sideways, OBV has continued to tilt downward, reflecting silent capital outflow beneath surface price stability;
∴ There is no upward curvature or crossover attempt - the OBV line remains submissive, signaling passivity or tactical retreat from market participants;
✦ Strategic Implication:
• The sustained divergence between OBV and price implies that larger hands are not accumulating - rather, they are disengaged;
• This condition often precedes fake breakouts or downward drifts, especially when unconfirmed by volume or RSI;
• The EMA9 serving as a lid rather than support confirms that internal flow is structurally bearish at the H1 frame.
∴ The tactical OBV structure reveals the undercurrent: orderless and hollow, despite price still holding ground.
✴️ Conclusion: Logic sealed - OBV confirms quiet withdrawal of pressure; tactical structure lacks foundational support.
⊢
🜎 Strategic Insight - Technical Oracle:
∴ The H1 tactical frame reveals a market in constrained inertia - price floats between short-term EMA's, yet every major momentum engine (MACD, Stochastic RSI, OBV) confirms internal recession;
∴ EMA's no longer guide - they constrain;
∴ Bollinger Bands contract - but hold no breakout;
∴ Volume is absent - and OBV confirms retreat;
∴ The chart is alive in form, yet dead in force;
∴ No element acts as initiator - only sustainers remain;
∴ The next tactical move must emerge externally, not organically.
✴️ Conclusion: The Tactical Oracle speaks - market energy is sealed beneath compression; movement is possible, but currently unprovoked.
⊢
▦ Structurally (H1):
✴️ Structurally: Neutral.
∴ Price floats near EMA9, below EMA21 and EMA50 - without rejection or breakthrough;
∴ No directional dominance has been established in the current cycle;
∴ Compression prevails over construction - this is not collapse, but pause.
✴️ Conclusion: Logic sealed - the structure is balanced but unsustained; no active trend is in command.
⊢
▦ Tactically: Suspended under Soft Compression:
∴ Momentum indicators (MACD, Stoch RSI, OBV) are all aligned in tactical decay - no upside thrust is evident;
∴ Volume remains below threshold and fails to accompany price fluctuations - a sign of apathy, not conflict;
∴ Price is trapped between EMA's and centered within Bollinger range - with no pressure buildup for breakout.
✴️ Conclusion: Logic sealed - the market is in tactical suspension, drifting within a soft compression chamber; movement requires external ignition.
⊢
⧉
· Cryptorvm Dominvs · MAGISTER ARCANVM · Vox Primordialis ·
⚜️ ⌬ - Wisdom begins in silence. Precision unfolds in strategy - ⌬ ⚜️
⧉
⊢

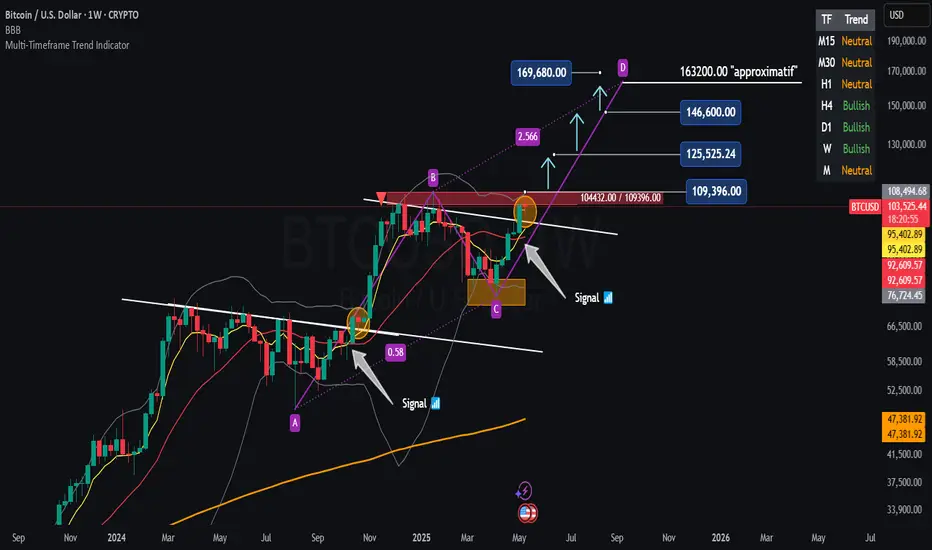
BTC: What if the real bull run is just beginning?🚀 BTC/USD – Weekly buy signal on the way?
📈 EMA 7 / SMA 20 crossover validated on a weekly basis
✅ Long-term bullish trend
⏸️ Short-term trend neutral
In my opinion, a bullish continuation in the long-term remains possible, particularly via an AB = CD structure for patient investors.
Of course, in small time frames, volatility will be present, but the underlying trend remains positive.
📌 Pivotal zone to break:
104,432 – 109,396 USD
➡️ A break of this resistance would provide a real boost to the bullish trend.
Next? Let's close our eyes... and let the position run.
⚠️ Analysis for educational purposes – not financial advice.
💬 Do you believe this weekly signal? Or are you staying on the sidelines for now?
Bitcoin at the Crest of Structure - The Silence of Momentum.⊢
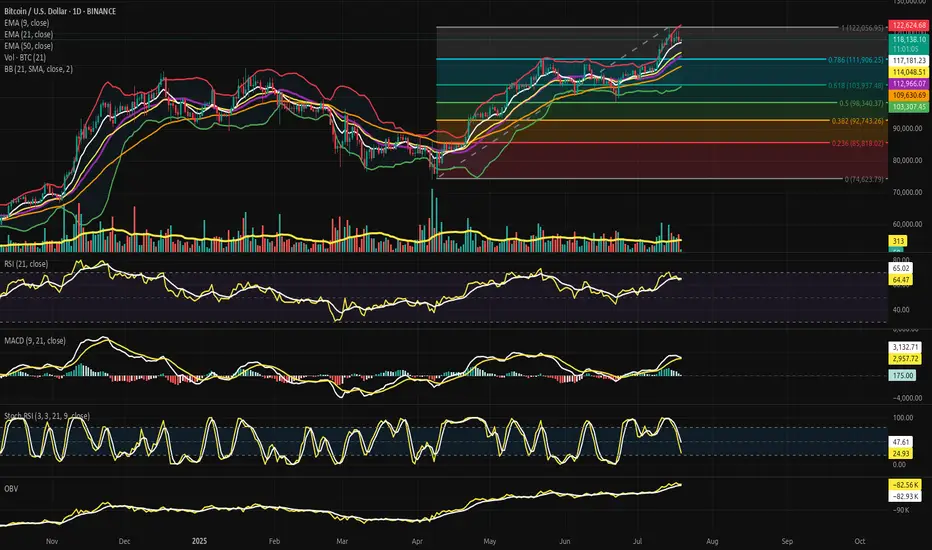
BTC/USD – BINANCE – (CHART: 1D) – (July 19, 2025).
◇ Analysis Price: $118,325.31
⊣
⨀ I. Temporal Axis - Strategic Interval - (1D):
▦ EMA9 - (Exponential Moving Average - 9 Close):
∴ Price is currently positioned above EMA9 at $117,218.67, confirming immediate bullish alignment;
∴ EMA9 is upward sloping and tightly hugging price candles, serving as the dominant intraday dynamic support;
∴ Every recent dip has been absorbed above or at EMA9, with no candle body close below it in the last 7 sessions.
✴️ Conclusion: Logic sealed - EMA9 holds command over short-term price structure; tactical momentum remains alive.
⊢
▦ EMA21 - (Exponential Moving Average - 21 Close):
∴ EMA21 currently rests at $114,658.53, forming the median layer of structural trend guidance;
∴ Price action remains significantly elevated above this level, showing that bulls retain medium-range control;
∴ EMA21 has not been tested since late June, reflecting a strong upside deviation from equilibrium.
✴️ Conclusion: Logic sealed - EMA21 serves as untested trend backbone; control remains firmly in favor of buyers.
⊢
▦ EMA50 - (Exponential Moving Average - 50 Close):
∴ EMA50 is currently located at $109,638.03, tracking long-range structural health;
∴ The moving average is gradually steepening, suggesting long-term strength and momentum acceleration;
∴ No violations or shadows have tested EMA50 since early May - reinforcing its strength as deep support.
✴️ Conclusion: Logic sealed - EMA50 anchors the structural uptrend; market remains far from long-term threat zone.
⊢
▦ Fibonacci Retracement – (1 = $122,056.95 / 0 = $74,623.79):
∴ The full Fibonacci range spans from the April low at $74,623.79 (0.0) to the July high at $122,056.95 (1.0) - anchoring the complete structure of the current macro move;
∴ Price is now positioned at $118,325.31, precisely above the 0.786 retracement level at $111,906.25, and beneath the 1.0 top - this zone represents the “golden upper quadrant,” a region where euphoria meets exhaustion;
∴ The 0.618 level ($103,937.45) remains untouched since early June, acting as the gravitational pull of equilibrium - its preservation confirms that no structural breakdown has occurred;
✦ Additional Level Mapping:
• 0.500 - $98,340.37: The neutral midpoint, remains far below - unchallenged;
• 0.382 - $92,743.26: The "warning belt" for medium-term trend decay;
• 0.236 - $85,818.02: A deep corrective zone, untouched and far from current price.
∴ Multiple zones of confluence exist between EMA21, BB midline, and 0.786, forming a strategic consolidation platform in the current price region;
∴ Failure to reclaim above 1.0 extension suggests bulls may be entering exhaustion while still structurally intact.
✴️ Conclusion: Logic sealed - price is trapped in the Fibonacci Gate (0.786 – 1.0); breakout requires decisive volume or reversion to golden support.
⊢
▦ Bollinger Bands - (SMA21 / 2 Standard Deviations):
∴ The current Bollinger structure shows band expansion, not contraction - upper band is at $122,653.00, lower band at $103,296.96, midline (SMA21) at $112,974.98;
∴ Price is moving above the midline, but no longer hugging the upper band - signaling that explosive momentum has waned while structure remains bullish;
∴ Last major push toward the upper band resulted in rejection near $122k, followed by sideways compression - implying the bands are preparing to resolve a volatility coil;
✦ Interpretative Observations:
• The midline (SMA21) is converging with the EMA21 and 0.786 Fib, forming a triple convergence layer - a key strategic battlefield;
• The distance between bands is approximately $19,356, indicating elevated volatility, but not chaos - directional tension remains unresolved;
• Band curvature suggests no imminent squeeze, but a potential for re-expansion if price reclaims upper territory.
∴ This structure shows a calm above chaos - volatility is present, but muted by the upper Fibonacci gate and internal exhaustion.
✴️ Conclusion: Logic sealed - volatility bands are wide and reactive, signaling buildup pressure; the next directional breach will likely define the next 30-day trend.
⊢
▦ Volume + EMA21 - (Volume Activity and Trend Average):
∴ The latest daily volume candle stands at 312 (unit scale), notably below the Volume EMA21, which trends around 418 - indicating waning participation post-breakout;
∴ The most recent breakout above $120k was accompanied by a singular spike in volume, followed by five consecutive days of volume decay - a typical exhaustion profile without follow-through;
∴ There has been no bullish volume expansion to defend price levels above $118k, suggesting that the upward move is unsupported by fresh demand;
✦ Tactical Observations:
• Volume is currently below the average trend line, which implies a lack of conviction on both sides - a vacuum state;
• The EMA21 of volume acts as a barometer of trend health - its breach to the downside indicates structural weakening beneath a seemingly bullish price;
• The low volume + high price condition signals silent divergence, often a precursor to compression, reversal, or manipulation.
∴ Price is elevated but unsupported, indicating the presence of “surface strength, internal fragility.”
✴️ Conclusion: Logic sealed - declining volume below trend average confirms demand fatigue; continuation is suspect without new influx.
⊢
▦ RSI (21) + EMA9 - (Relative Strength Index with Signal Smoothing):
∴ The RSI (21) reads at 64.72, having pulled back from a recent high near 74, suggesting a transition from euphoric thrust to reflective consolidation;
∴ The RSI line has dipped below its EMA9 signal, forming a soft negative crossover, typically interpreted as a waning of short-term momentum;
∴ Despite the loss of angle, RSI remains comfortably above the 50-line, which acts as the threshold between bullish continuation and structural deterioration;
✦ Interpretative Layers:
• The EMA9 of RSI functions here as a short-term momentum oscillator overlay - its breach confirms weakening, not reversal;
• RSI holding above 60 implies the presence of continued buy-side pressure - though fading;
• The divergence between price (near high range) and RSI (descending) establishes the groundwork for potential hidden weakness.
∴ RSI shows the archetype of a post-breakout exhaustion slope, yet refuses to break structurally - a signal of suspended momentum, not decay.
✴️ Conclusion: Logic sealed - momentum is cooling but not reversing; bulls remain structurally in control while energy dissipates.
⊢
▦ Stochastic RSI (3,3,21,9) - (Momentum Cycle Oscillator):
∴ The current values are: %K = 26.27, %D = 48.05 - showing a completed bearish crossover, with %K trailing beneath %D;
∴ The oscillator has already dipped into oversold (<20) and is now rebounding, yet fails to regain dominance over the signal line - this marks a failed bullish recovery pattern;
∴ Recent structure shows multiple failed attempts to reclaim high-band cycles, indicating that short-term traders are exiting, while major holders observe;
✦ Tactical Interpretations:
• The system has transitioned from bullish impulsive to corrective reflective - momentum is coiling instead of thrusting;
• The flattening of %D around the midline reflects indecision in micro-timeframe velocity;
• The double-rejection of %K near 80 last week forms a tactical top signal under stochastic doctrine.
∴ This oscillator, sensitive to short-term flows, declares the loss of tactical initiative by the bulls.
✴️ Conclusion: Logic sealed - short-term momentum cycle is decaying; the structure now favors consolidation or soft pullback.
⊢
▦ MACD (9,21) - (Moving Average Convergence Divergence):
∴ Current MACD line: (+2,961.80), Signal line: (+3,153.14) - indicating an active bearish crossover, as the MACD line has dropped below the signal;
∴ Histogram bars are negative and expanding, a key sign that downward momentum is growing, even as price remains elevated;
∴ This crossover has occurred at a relatively high amplitude, meaning the pullback potential is non-trivial - it is not a shallow fluctuation, but a structural transition;
✦ Structural Implications:
• The bearish crossover happened after divergence with price action - while Bitcoin reached new highs, MACD momentum did not, forming a classical bearish divergence;
• Momentum began decaying several sessions before price peaked - the indicator warned of exhaustion before price responded;
• The slope of the MACD line has steepened downward - a sign of gathering corrective force.
∴ This marks the first true warning from the momentum engine beneath the price - a shift from thrust to counter-pressure.
✴️ Conclusion: Logic sealed - MACD confirms structural momentum exhaustion; corrective forces are now in motion, though price has yet to reflect full impact.
⊢
▦ OBV + EMA9 - (On-Balance Volume with Trend Smoothing):
∴ Current OBV stands at (–82.93K), now below its EMA9, which reads (–82.57K) - indicating a loss of volume-weighted trend force from the buyers;
∴ While price remains elevated, OBV has been descending gradually, forming a clear bearish divergence between volume flow and price action;
∴ Over the last 7 daily sessions, OBV has failed to form any new high - even as BTC printed a new price peak - revealing that volume is silently exiting the market;
✦ Interpretative Reading:
• OBV below EMA9 confirms that cumulative volume pressure is negative - this undermines surface-level price strength;
• Divergence with price often precedes major pivot zones - the “hidden drain” effect;
• The OBV curve is now sloping downward with consistency, indicating that larger hands may be distributing while price remains deceptive.
∴ This structure carries the seal of silent distribution, a hallmark of late-cycle phases in bullish trends.
✴️ Conclusion: Logic sealed - OBV confirms internal outflow; market strength is no longer aligned with volume reality.
⊢
🜎 Strategic Insight – Technical Oracle:
∴ The 1D structural framework remains formally bullish, as price holds firmly above all exponential anchors (EMA9, 21, 50) and resides within the golden quadrant of the Fibonacci matrix;
∴ However, a triad of momentum signals - MACD, Stochastic RSI, and OBV - are all flashing early warnings of underlying exhaustion;
∴ The market breathes the air of height, yet the blood of energy runs thin;
∴ Volume no longer fuels ascent - momentum coils, not climbs;
∴ The surface remains calm, but the substructure contracts in silence;
∴ This is a phase of strategic suspension;
∴ Not yet a reversal - but no longer thrusting forward;
∴ A condition of uptrend fatigue, awaiting external force or internal reset.
✴️ Conclusion: The Oracle speaks - the trend is structurally preserved, but internally untrustworthy. The next move, when it comes, will be definitive.
⊢
▦ Structurally: Bullish.
∴ Price remains well above EMA50, EMA21, and EMA9;
∴ No bearish cross has occurred;
∴ Structure is elevated within upper Fibonacci zones - not broken.
⊢
▦ Momentum-wise: Bearish Divergence.
∴ MACD has crossed bearishly;
∴ OBV is declining despite price holding high;
∴ RSI and Stoch RSI confirm exhaustion.
⊢
✴️ Final Codex Interpretation:
∴ Structurally Bullish - Tactically Suspended;
∴ The frame holds, but the fuel has faded;
∴ Bulls possess the hilltop - but lack fire to advance;
∴ A breach or retreat shall define the next archetype.
⊢
⧉
· Cryptorvm Dominvs · MAGISTER ARCANVM · Vox Primordialis ·
⚜️ ⌬ - Wisdom begins in silence. Precision unfolds in strategy - ⌬ ⚜️
⧉
⊢