LAST BTC PUSH? Dear Community,
in order to expand my skills analysis, I will regularly share my analyses and ideas here on TradingView. I still consider myself a beginner in the “stock market” and “crypto” area and am therefore very much looking forward to your comments and input!
My primary assumption is that we are still in a final upward move. However, I am also pursuing alternative scenarios that could lead to significantly higher levels.
BTC analysis - 1H chart
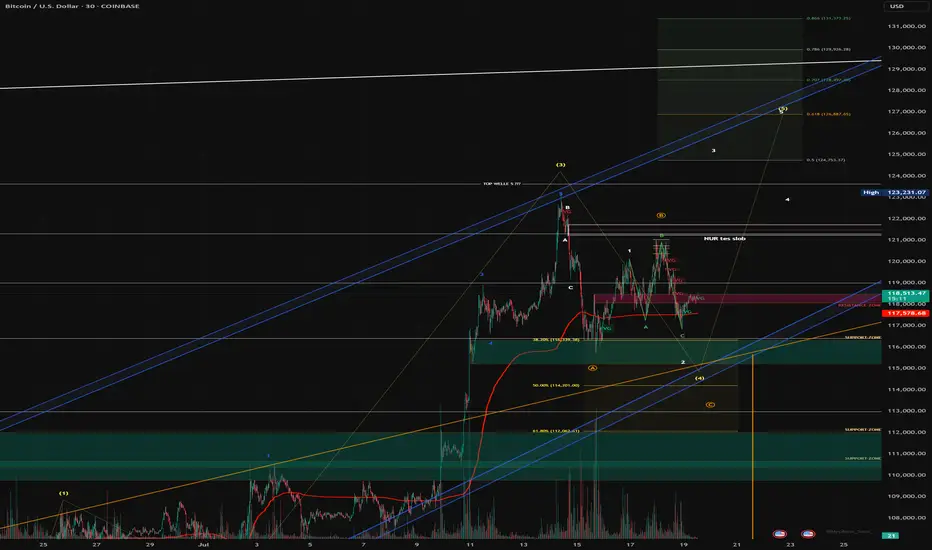
In my analysis, wave (3) in yellow is complete and we are currently in wave (4) correction, which may not be complete yet.
My guess:
- Wave B (yellow) has been completed, wave C has extended and could still reach USD 113 679, where the Fibonacci 100 level is located. There is also an FVG in the 1H chart.
- A retest of the blue trend channel would be quite possible in order to pick up liquidity at this level before wave 5 (yellow) is completed between USD 126,887 and USD 130,000.
- My risk management is down to USD 107,326 (Fibonacci 1.866).
- We have already tested the Fibonacci 0.5 level (pullback level) and seen a positive reaction. However, we currently lack volume in the market.
- If the blue channel and the Fibonacci 100% level break, I have to assume an alternative count.
In this case, wave 4 would still have scope to reach the Fibonacci 61.8% level in the yellow box at USD 112,062.
If my current forecast does not materialize, I assume that we have already completed wave A and are in the correction to wave B, which will be followed by wave C - with a target of around USD 130,000 for the final impulse.
This scenario also fits in well with risk management up to the Fibonacci level of 1.866. There are also high liquidity areas (long) at this level, which are very attractive for market makers.
What do you think?
BTCUSD trade ideas
BTCUSD 1H – TCB Breakout Reclaim Setup📌 BTCUSD 1H – TCB Breakout Reclaim Setup
📆 Date: July 19, 2025
🔍 Strategy: TCB (Trend–Countertrend–Breakout)
🧠 Context:
BTCUSD broke below an ascending channel, found support at ~118,000, and is now attempting a reclaim of previous structure.
This is a classic reclaim zone setup — where a clean retest of prior support-turned-resistance turns back into support again, offering a breakout entry.
✅ TCB Checklist Summary:
Trend: ✅ Uptrend prior to break
Countertrend: ✅ Clean channel breakdown
Demand Zone: ✅ Strong reaction from 118k
Breakout Zone: 🔜 Watching 118,800
Confirmation Candle: 🔄 Awaiting bullish signal
🧮 Total Score: 8/10 = 80%
🔄 Projected 100% once:
Breakout candle above 118.8k confirms
NY session volume aligns
R:R: ✅ Clean 1:2+ to 120.4k
📈 Trade Plan (If Breakout Confirms):
Entry: Above 118,800 (after bullish close)
SL: Below 117,800
TP1: 119,800
TP2: 120,400
Risk: 0.5%–1.0% depending on position sizing
🔔 Alerts Set For:
Breakout Entry (118,800+)
TP1 Hit (119,800)
TP2 Hit (120,400)
SL Hit (117,800)
🧭 Note:
This trade is not yet active — confirmation required above 118.8k with session momentum (NY or strong engulfing candle). Clean reclaim = high-quality continuation setup in TCB strategy.
📓 Using the TCB method helps filter low-quality breakouts and confirms structure before entry. Wait for the reclaim and momentum confirmation before executing.
💬 Let me know in the comments if you're watching this or trading similar setups on BTC!
#BTCUSD #Crypto #PriceAction #TradingView #TCBStrategy #Breakout #TechnicalAnalysis #ReclaimSetup #SmartTrading

BTC/USD POTENTIAL SELL OPPORTUNITY!A sell opportunity is what we envisage in this market from the H4 timeframe.
After the new high was made, the market formed a bearish flag pattern like pattern. We’re looking for to selling from the current market price. Our target profit is $111,000

Bitcoin(BTC/USD) Daily Chart Analysis For Week of July 18, 2025Technical Analysis and Outlook:
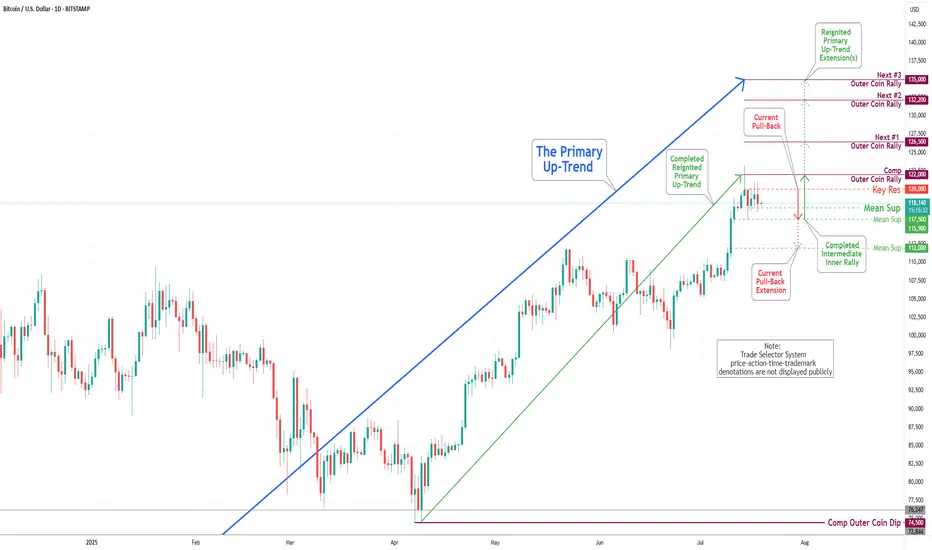
In last week's trading session, we achieved a new historical high by completing our Outer Coin Rally at 122000. Following this milestone, the coin retraced, as expected, to the newly established Mean Support at 115900 and is currently trading at the Intermediate Mean Support at 117500. Presently, the coin is set to retest the Mean Support at 115900, with the potential for a further pullback to the Mean Support at 112000. This anticipated decline will necessitate a retest for the completed Outer Coin Rally at 122000. The designated targets for the renewed Primary Up-Trend are 126500, 132200, and 135000.
#BTCThe next potential move... It could touch the top of the channel, and if the breakout is confirmed on the monthly timeframe, we’ll likely see a pullback to the lower level.
Bitcoin 2013 Fractal chart UPDATE = Nailed the PA target
Been posting this chart for the last few years and drew that Circle that PA hit, back in Feb..Way befppre PA arrived there.
I also drew that dashed Arrow line at the same time ad, as we can see frm the Daily chart beow, PA is bang on that line.
Why is it importnat that you know this ?
Because those Circles and Dashed lines are transposed from teh 2017 - 2021 fractal !
We do seem to have moved from one Fractal to another.
This has yet to be fully confirmed and the July Candle Close will certainly help identify this if we get a large green candle.
So, for now, we wait.
I will post more details about this later but fir now, if we follow this line, we can expect a cycle ATH of around 270K - 322K in Q4 2025
And then the BIG question is "What is next ?" because, as I have pointed out n another posts, we are also leaving a long term cycle (2009 - 2025 ) line of resistance....that we just broke free of...but need to remain above.
Judy is CRUCIAL

BUYRejection Level
Daily Volume
Market Structure Shift
London US Session
Trend Line Break
Untapped Order Point

bitcoin is still bullishon the monthly and weekly time frame the bitusd price is going to make new highs than its previous

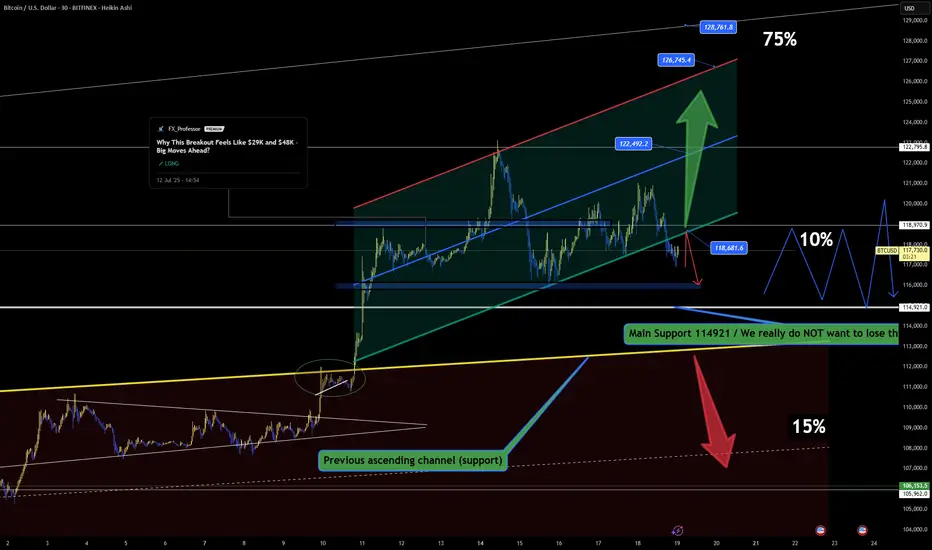
BTC Battles Resistance – Can Bulls Reclaim the Channel?🔥📈 BTC Battles Resistance – Can Bulls Reclaim the Channel? 🧠🚪
Bitcoin is now knocking on the door of the broken channel support — what was once a floor is now acting as resistance. For bulls to regain momentum, price must reclaim and close back inside the channel, ideally above 118.6K.
📍 Key Structural Notes:
We've already broken below the internal channel — this is no longer a confirmed uptrend.
Current resistance is the same trendline that previously acted as support — classic technical flip.
Failing here keeps BTC vulnerable for a deeper move toward the Main Support at 114.9K, where the real test lies.
📊 Order Flow Context:
Funding remains mildly positive, showing no panic from longs.
Premium is near-zero — market isn't chasing.
OI is steady, showing neutral positioning but potential for sudden volatility.
Spot volume picked up during the recent move, but not strong enough to confirm a breakout… yet.
🧩 Scenarios:
✅ Breaks back above 118.6K with volume → Targets: 122.4K, 126.7K, 128.7K (channel continuation).
❌ Rejection at resistance → Eyes on 114.9K. Losing that, and we enter danger territory toward 106K.
We’re at a decision point — and these are the moments that shape the next leg.
One Love,
The FXPROFESSOR 💙
Disclosure: I am happy to be part of the Trade Nation's Influencer program and receive a monthly fee for using their TradingView charts in my analysis. Awesome broker, where the trader really comes first! 🌟🤝📈
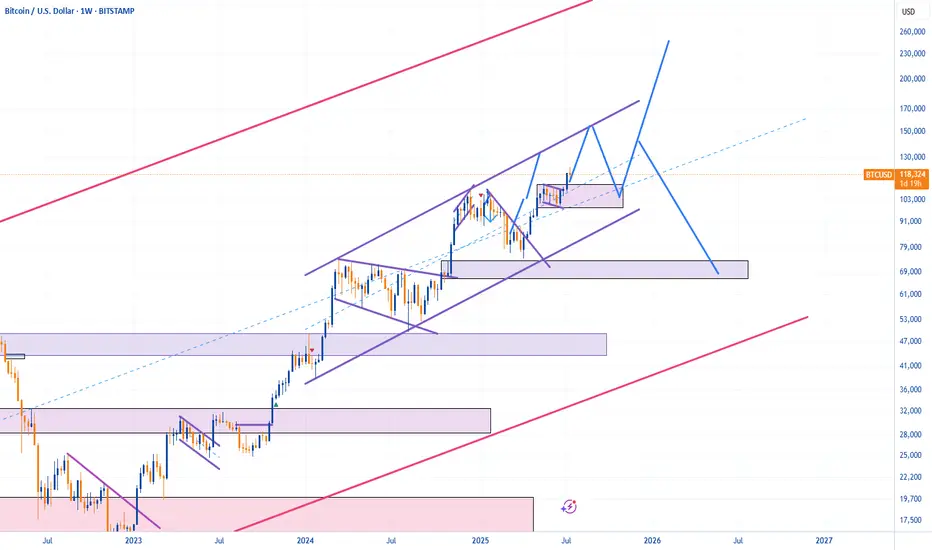
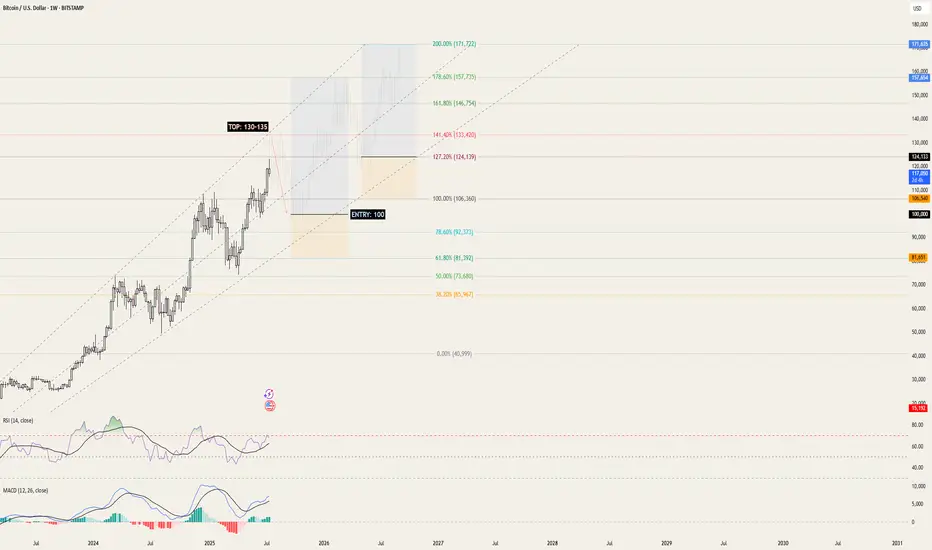
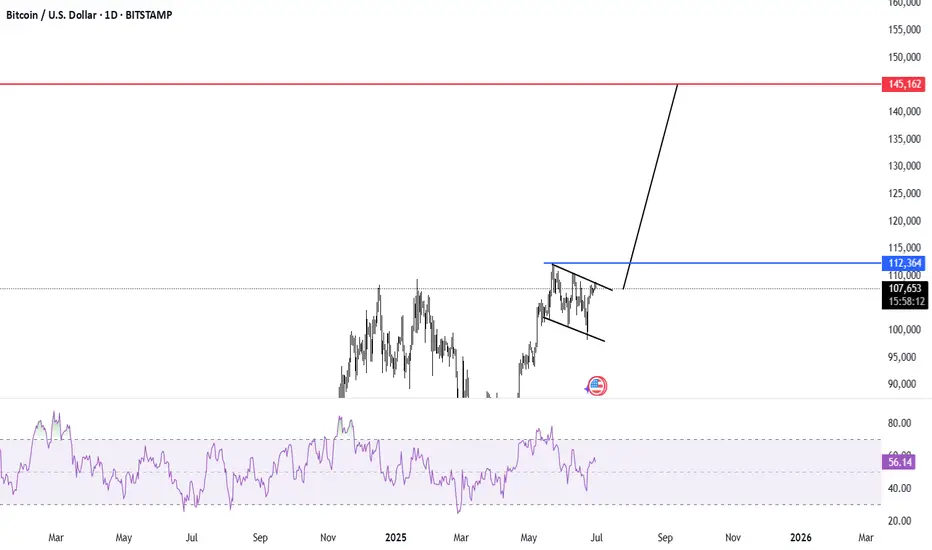
BTC/USD | 2025 Top = 130k | 2026 Top = 170k+Continuing the current upwards trajectory, using Fibonacci trend analysis, we'll reach BTC's peak for 2025 @ 130-135k within the next few months.
By the end of the month / beginning of 2026, BTC will be back to 100k - this is where this strategy begins.
Enter @ 100k between the 78.6% and 100% Fibonacci levels, setting a comfortable SL down to the 61.8% Fibonacci level @ 80k. Over the course of 3-6 months we'll then reach the first peak of 2026 at the 178.6% level @ 150-160k . Close.
From this point, timelines rely purely on consistency, however considering Bitcoin's adoption and rate of growth, an upwards trend is guaranteed.
We wait for price retraction down to 120-125k near the lower 127.2% Fib level and enter. SL down at 100% Fib level @ 100-105k. Next peak for 2026 is 170k and above , possibly creating a top @ 200k.
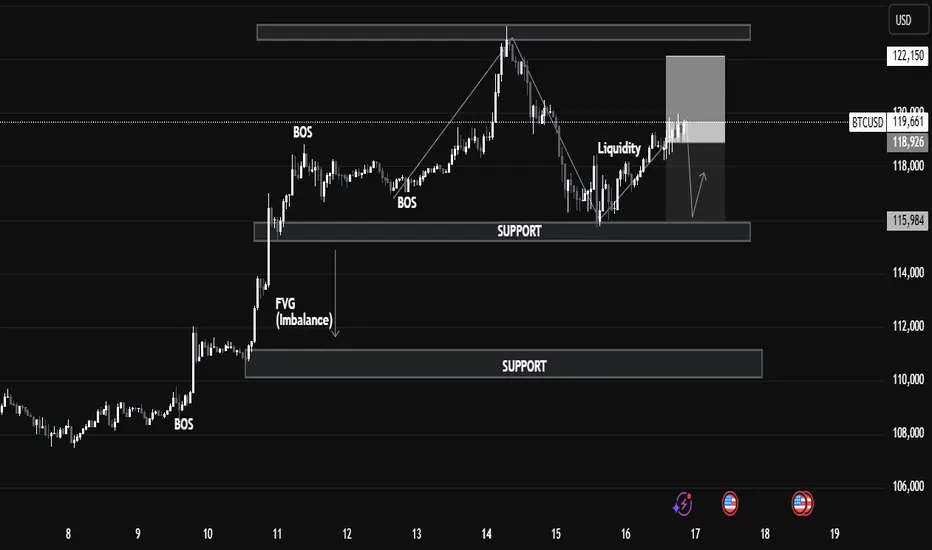
BTCUSD - Smart Money Trap Before the Next Move?1. Market Structure & BOS (Break of Structure):
We can observe multiple BOS levels around July 10–12, signaling a strong bullish transition.
2. Break of Structure (BOS)
Definition: BOS occurs when price breaks above a previous swing high with conviction.
Application on Chart: The BOS on July 11 marked the continuation of bullish market structure.
This indicated strong buying pressure, often driven by institutional order flow.
📉 3. Fair Value Gap (FVG)
Definition: A Fair Value Gap is an inefficiency or imbalance in the market where price moves too quickly, skipping potential orders.
On Chart: The FVG is present between July 11–12.
Expectation: Price often returns to these zones to “rebalance” or mitigate orders before continuing the trend.
Educational Note: FVGs act as magnet zones and are often used to identify entry points or liquidity pools.
💧 4. Liquidity Sweep
Definition: A liquidity grab occurs when price spikes above a recent high or low to trigger stop-loss orders before reversing.
On Chart: Just above resistance, a liquidity grab took place.
Purpose: Institutions often sweep liquidity before large moves to fill larger orders.
🔹 Resistance & Supply Zone:
The resistance area between 122,150–123,500 has held firmly, causing a notable correction.
This region aligns with institutional order blocks, suggesting potential smart money selling.
🔹 Support & Demand Zone:
The nearest support zone lies at 115,984, marked by previous consolidation and BOS.
Price is likely to revisit this zone, acting as a retest for demand re-entry, providing a strong buy-side opportunity if confirmed.
🔹 Current Price Action:
BTC is consolidating around 119,253, with a possible liquidity sweep above short-term highs.
BTC 1H – Make or Break at SupportBitcoin has retraced into a previous demand zone after rejecting from local resistance. The 1H Stoch RSI is fully oversold, hinting at a potential bounce — but a clean break below $116K could send us down to the next base around $111K. Eyes on reaction here.

Quick SHORT (TIGHT STOP) After the bullish run up, looking for this to retrace and then consolidate until further notice

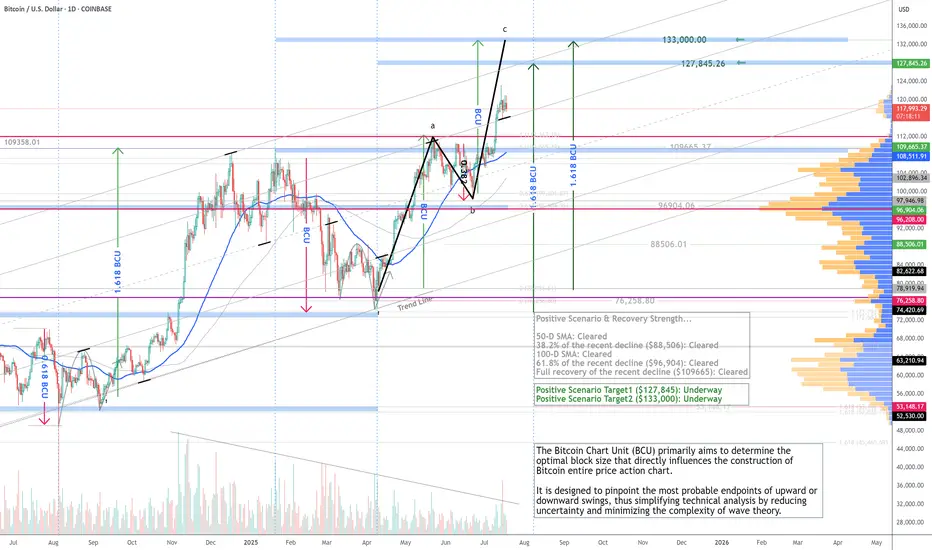
Bitcoin ($BTC): The Current Run Targets In Sight - 7/18/2025CRYPTOCAP:BTC has cleared all chart levels (listed), riding a textbook BCU (abc) wave to new highs! Momentum’s conservative, and abc targets are in sight: $127,845–$133,000. Let’s see how this unfolds at these levels!
Bitcoin Forecast 🔁 I use a unique time-based cycle method built around the universal law of 3-6-9:
3 = Impulse wave
6 = Correction
9 = Cycle end
we are at the higher time frame cycle 9
each cycle of the 3, 6 ,9
contain a smaller one 3 ,6 , 9
This isn’t just about charts — the number 9 governs all natural cycles:
Pregnancy, learning, lunar cycles, economic growth, etc.
---
🗓️ These are the key monthly turning points I track every year:
> Jan 8 – Feb 7 – Mar 6 – Apr 5 – May 5 – Jun 4 – Jul 2 – Aug 1 – Aug 31 – Oct 30 – Nov 29 – Dec 6
📍 This month, July 2nd was a critical time pivot. From there, Bitcoin entered a new time cycle.
📌 Time Is More Powerful Than Price
Most traders focus on price action, waves, or indicators…
But the reality? Time is the real market driver.
⏳ Entry signals based on time outperform those based on price.
Why? Because price is a reaction — time is the cause.
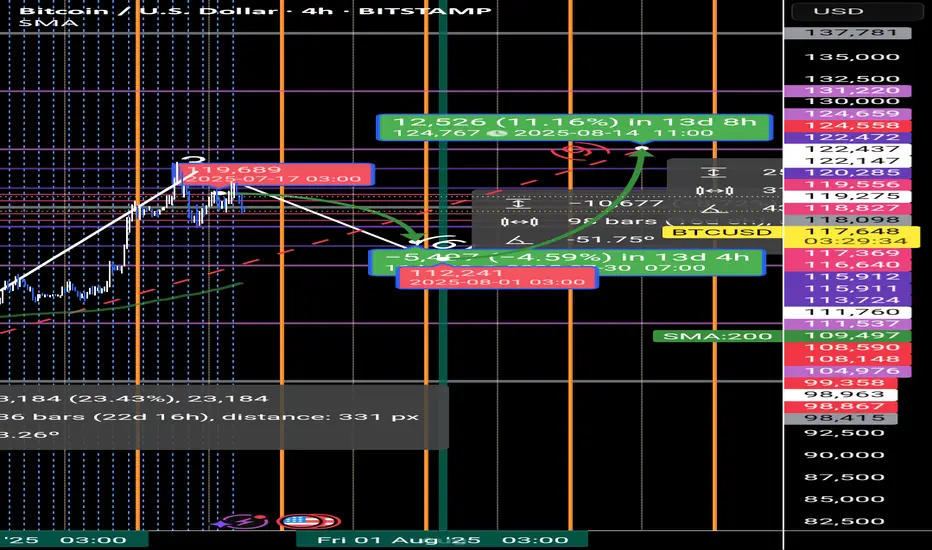
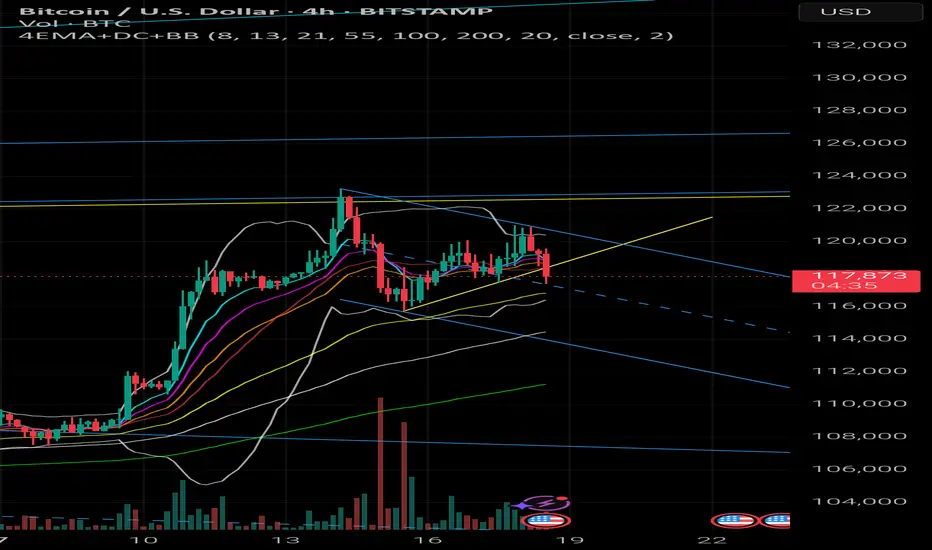
BTCUSD 4h – Chart updated with possible reaction zones📉 Channel adjusted to real price action.
Watching:
🔹 Top of the channel
🔹 EMA100
🔹 Flat base near 115.7
Just structure – no signal.
#BTC #CryptoTA #MarketLevels #DYOR
BTC #Short Note on BTC/USD (15-Min Chart):Short Note on BTC/USD (15-Min Chart):
Bitcoin recently broke down from an ascending channel, signaling a shift in momentum. After forming a QFL base, price failed to hold above the 50% retracement level and is now testing a key demand zone around $117,200. A bounce from this level is possible, but a breakdown below may open the path toward $116,000–$115,000. Short-term bias remains bearish unless the 50% level is reclaimed.
thanking you

BTCUSD shortAfer breaking the corrective ABC structure, we will at least move bearish forward the previous low. We could see a bigger corrective structure

Last chance to make profit from BTC with buying positionBullish flag
Strong resistance breakout
2 bull points
Position trade spot buying
Bitcoin completing timecycle on oct 2025 after that it would be 4th time if market again crash for around 70%
Manage your risk in both future and spot trading
Note: NO analysis would 100% profitable trading is the game of probability and risk management so follow your trading plan with proper risk reward and win rate.
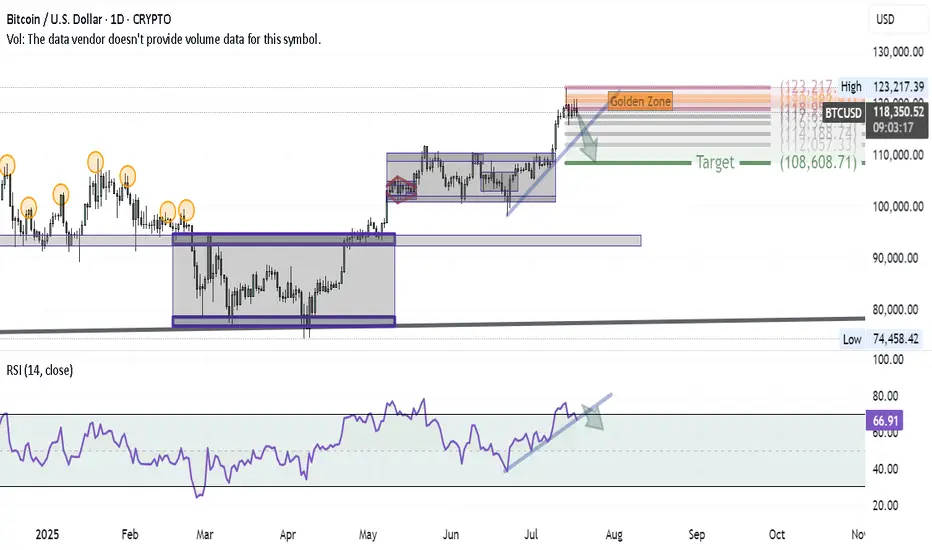
Bitcoin Correction Unfolding — First Wave in MotionAfter successfully hitting the BITCOIN target and anticipating a major correction in my previous ideas, here’s how the first wave of that correction is shaping up on the daily chart:
1- At the recent high, a Shooting Star candle formed — a classic reversal signal.
2- Using Volunacci analysis, the price retraced exactly to the Golden Zone, validating the first leg of the pullback.
3- The next step? A breakdown of the blue trendline would likely send us toward the Volunacci target at $108,600.
4- For confirmation, we're watching the RSI trendline — if it breaks down as well, it would strongly support the bearish continuation.
The setup is clean and developing as expected — it's all about following price and letting the chart guide the story.
BTC #15-minute BTC/USD chart This 15-minute BTC/USD chart shows price action within an ascending channel. Recently, Bitcoin broke below the channel's midline and dipped to a key demand zone (highlighted in grey), triggering a liquidity grab (marked as "GFL"). Price has since retraced to the 50% level of the drop, which may act as resistance. A failure to reclaim the channel could indicate further downside.


BitcoinBullish momentum short term based as the initial direction is bearish movement. With cot report indicationg long term bearish momentum.
