BTCUSD trade ideas

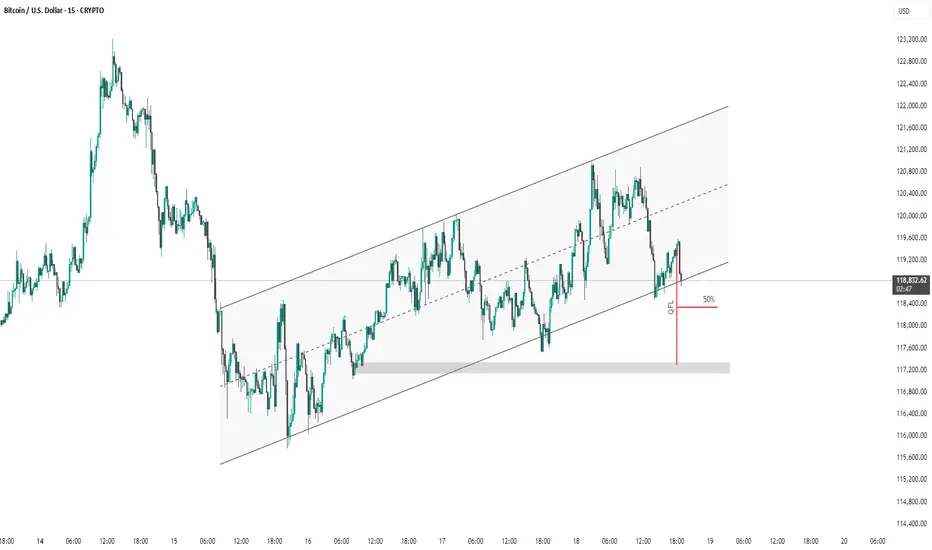
BTC #15-minute Bitcoin (BTC/USD) chart This 15-minute Bitcoin (BTC/USD) chart shows price action within an ascending channel. Recently, the price broke below the midline and touched the lower channel boundary, bouncing back slightly afterward. A marked "QFL" (Quick Flip Level) zone with a 50% retracement is highlighted, suggesting a potential area of interest for buyers or a price reaction point. The shaded region indicates strong demand/support around the $117,200–$118,000 range. A breakdown below this support could signal further bearish momentum.
thanking you
Will this be the first proper alt szn since 2020?Altcoins are waking up. While Bitcoin has surged over 600% since 2022, Ethereum and smaller coins have lagged behind. But that might be changing. With ETHBTC breaking its downtrend, BTC dominance dropping, and political momentum building around crypto regulation, the stage could be set for a true altcoin season. In this video, we break down the charts, the trends, and what could come next. Is this the real deal or just another fakeout? Let me know what you think.

Bitcoin is bullish now & many Traders don't see it !!!I might be wrong and this might never happen, but it might come true From a technical perspective!!!
Remmember
Stay Awesome , CobraVanguard.
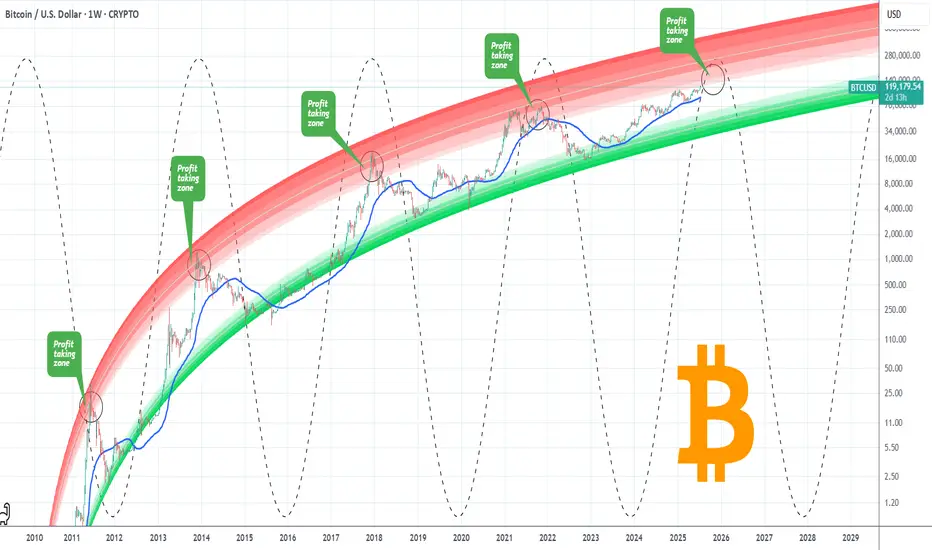
BITCOIN Entering Cyclical Profit Zone. Risk should be limited.Bitcoin (BTCUSD) has just entered the first level of the Logarithmic Growth Curve (LGC) Resistance Zone, which is the light pink band. The Top of the previous Cycle was priced at the top of the band just above this.
In fact every BTC Cycle had this as the 'Profit taking Zone'. The market marginally touched that also within December 2024 - January 2025 but got rejected, almost in similar fashion as January 2021, which was a Double Top approach of the peak formation during the previous Cycle.
This Cycle Top is expected to be within October - November 2025, so we call this the 'Profit Taking Zone' for a reason. Risk exposure from now on should be getting more and more limited. Peak range (depending of the nature of aggression of potential Rate Cuts in September) could be anywhere within $140 - 200k.
Do you think this is the time to start limiting BTC exposure, perhaps moving some of the huge profits to alts? Feel free to let us know in the comments section below!
-------------------------------------------------------------------------------
** Please LIKE 👍, FOLLOW ✅, SHARE 🙌 and COMMENT ✍ if you enjoy this idea! Also share your ideas and charts in the comments section below! This is best way to keep it relevant, support us, keep the content here free and allow the idea to reach as many people as possible. **
-------------------------------------------------------------------------------
💸💸💸💸💸💸
👇 👇 👇 👇 👇 👇
Bitcoin at the Edge of the Fibonacci Gate - Silent Strain.⊣
⟁ BTC/USD - BINANCE - (CHART: 1D) - (Jul 18, 2025).
◇ Analysis Price: $118,866.60.
⊣
⨀ I. Temporal Axis - Strategic Interval - (1D):
▦ EMA9 - (Exponential Moving Average - 9 Close):
∴ EMA9 is currently positioned at $119,077.81, closely tracking the current price, acting as dynamic micro-support;
∴ The slope of EMA9 remains upward, with price consistently closing above it in the past sessions;
∴ Compression candles are forming above this line, suggesting it is being defended as a tactical floor.
✴️ Conclusion: EMA9 is structurally supportive, signaling short-term bullish control beneath compression.
⊣
▦ EMA21 - (Exponential Moving Average - 21 Close):
∴ EMA21 is placed at $118,537.29 and holds a clear upward slope;
∴ Recent pullbacks have tested the region near EMA21 but failed to close beneath it;
∴ EMA21 is establishing itself as the primary mid-range buffer zone within this bullish phase.
✴️ Conclusion: EMA21 confirms intermediate momentum preservation and mid-term trend integrity.
⊢
▦ EMA50 - (Exponential Moving Average - 50 Close):
∴ EMA50 is located at $116,804.80 and remains untouched during the current rally phase;
∴ The distance between EMA21 and EMA50 is widening, confirming structural momentum;
∴ This line now functions as the lower tier of the bullish envelope - a defensive anchor.
✴️ Conclusion: EMA50 reflects resilient bullish understructure and rising support basin.
▦ Fibonacci Retracement - (ATH = $122,056.95 / Low = $74,623.79):
∴ Price is currently positioned just under the 0.786 level, a classic tension zone before ATH retests;
∴ The 0.618 level has already been claimed and held as support, showing strength through key retracements;
∴ The market is coiling between 0.786 and 1.000 in preparation for decisive expansion or rejection.
✴️ Conclusion: BTC sits within the golden gate - structurally pressurized near final resistance thresholds.
⊢
▦ Bollinger Bands:
∴ Bands are visibly contracting, forming a volatility funnel around the current price zone;
∴ The price is maintaining proximity to the upper band without closing beyond it;
∴ The base band remains far beneath ($116k zone), indicating untriggered potential.
✴️ Conclusion: Volatility is compressing structurally; directional resolution is imminent.
⊢
▦ Volume + EMA21:
∴ Volume bars have declined steadily during this upper-range consolidation;
∴ EMA21 on volume confirms weakening participation relative to early July moves;
∴ Absence of breakout-volume suggests either stealth accumulation or passive stalling.
✴️ Conclusion: Volume behavior is non-confirmatory - the structure floats without conviction.
⊢
▦ RSI - (21) + EMA9:
∴ RSI(21) currently prints 60.45, above its own EMA9 at 59.41, suggesting net upward pressure;
∴ The RSI slope remains neutral-to-positive without entering overbought;
∴ The absence of bearish divergence confirms internal momentum coherence.
✴️ Conclusion: RSI structure is clean, moderate, and aligned with sustainable trend energy.
⊢
▦ Stochastic RSI - (3,3,21,9):
∴ K = 78.78 | D = 71.55 - both above 70, nearing the overbought ceiling;
∴ The fast line (K) shows minor inflection but no confirmed cross;
∴ Momentum is elevated, but historical context shows price can remain extended.
✴️ Conclusion: Momentum is entering saturation zone - caution on short-term exhaustion.
⊢
▦ MACD - (9,21):
∴ MACD line (540.52) remains above the signal line (414.93) in sustained bullish crossover;
∴ The histogram has begun flattening, indicating reduced acceleration;
∴ There is no bearish cross yet, but momentum build is slowing.
✴️ Conclusion: MACD supports bullish continuation, but thrust intensity is decaying.
⊢
▦ OBV + EMA9:
∴ OBV reads 71.13M and is currently flat, with no new highs in accumulation;
∴ EMA9 on OBV closely hugs the raw OBV line, confirming stagnation;
∴ Prior upward surges in OBV are not being extended, showing tactical pause in conviction.
✴️ Conclusion: Liquidity expansion has halted; OBV structure is tactically neutral.
⊢
🜎 Strategic Insight - Technical Oracle:
∴ The BTC/USD structure is entering a compressed apex between structural momentum (EMA stack, RSI, MACD) and tactical exhaustion signals (Stochastic RSI, Bollinger Band constriction, flattening OBV);
∴ Price is stabilizing just beneath the ATH gate ($122,056), indicating a threshold scenario - where breakout and rejection probabilities are approaching parity;
∴ Volume decline reflects the absence of forced participation, and suggests that the next move will be event-triggered or liquidity-engineered. The current environment favors volatility re-expansion, not trend reversal;
✴️ This is a threshold phase: structurally bullish, tactically suspended, awaiting ignition.
⊢
∫ II. On-Chain Intelligence – (Source: CryptoQuant):
▦ Exchange Netflow Total + EMA9:
∴ Current Netflow: -938 Bitcoins - sustained negative flow over time indicates coins leaving exchanges;
∴ Persistent outflows reflect holding sentiment and reduced immediate sell pressure;
∴ Price action shows historical upside alignment when netflows remain negative across clusters.
✴️ Conclusion: Exchange behavior signals macro holding bias, not liquidation cycles.
⊢
▦ Binary CDD + EMA9:
∴ Binary CDD has spiked into high activity zones in the past week, showing awakened dormant coins;
∴ This metric historically precedes localized tops when synchronized with weak flows;
∴ However, no consistent clusters are forming - signals remain scattered.
✴️ Conclusion: Binary CDD reflects isolated movements, not systemic awakening or distribution.
⊢
▦ Exchange Whale Ratio + EMA9:
∴ Current ratio hovers at ~0.62 - elevated but not extreme;
∴ Sustained whale activity near 0.60+ can precede volatility events;
∴ Trendline is rising since May, showing gradual uptick in dominance from top senders.
✴️ Conclusion: Whale activity is tactically elevated, implying latent strategic intent.
⊢
▦ Supply-Adjusted Dormancy + EMA9:
∴ Dormancy values are near historical lows, indicating old coins are staying inactive;
∴ EMA9 confirms a downward trend in dormant supply movement;
∴ Long-term holders are not distributing at this level.
✴️ Conclusion: Structural dormancy supports holder conviction - no exit signals from old supply.
⊢
▦ Realized Cap + EMA9:
∴ Realized Cap is now exceeding $1T, rising consistently without parabolic spikes;
∴ EMA(9) and line are in lockstep - a healthy ascent;
∴ No acceleration = no blow-off = sustainable revaluation.
✴️ Conclusion: Value accumulation remains organic, not euphoric.
⊢
▦ MVRV Ratio + EMA9:
∴ MVRV sits at 2.36 - below historical overvaluation levels (>3.0);
∴ EMA(9) confirms gradual slope upward, consistent with price;
∴ Ratio is not overheated - risk/reward remains structurally favorable.
✴️ Conclusion: MVRV indicates non-euphoric regime - mid-phase of value appreciation.
⊢
▦ BTC vs GOLD vs S&P500 - (BGemetrix Comparative Graph):
∴ BTC continues to outperform both GOLD and SPX in long-term slope, even after corrections;
∴ Current phase shows GOLD flattening and SPX slightly lagging BTC in verticality;
∴ This divergence hints at BTC leading in speculative rotation while traditional assets stabilize.
✴️ Conclusion: BTC holds macro-dominance position, operating as the apex volatility proxy in current intermarket structure.
⊢
🜎 Strategic Insight - On-Chain Oracle:
∴ Despite short-term compression, the on-chain structure reveals no distribution threats;
∴ Holder conviction, realized valuation, and MVRV slope all suggest controlled structural appreciation, not mania;
∴ Whales are tactically present, but dormancy and exchange flows confirm no mass exit;
∴ This is an internally coherent, tactically patient regime.
✴️ Bitcoin is preparing, not peaking.
⊢
𓂀 Stoic-Structural Interpretation:
▦ Structurally Bullish - Tactically Suspended:
∴ All key EMA's (9/21/50) are stacked and rising; price remains elevated yet non-parabolic;
∴ Fibonacci apex is active, with price compressing beneath the ATH zone ($122,056), not retreating;
∴ On-chain intelligence confirms long-term conviction, with no distribution from whales or dormants.
✴️ Conclusion: The system retains structural strength; pressure is latent, not expired. The architecture is bullish, not euphoric.
⊢
▦ Tactical Range Caution:
∴ Stochastic RSI and MACD show early-stage exhaustion;
∴ Volume has declined into apex, favoring liquidity traps or volatility bursts;
∴ Whale Ratio elevation implies pre-positioning behavior, not public confirmation.
✴️ Conclusion: Tactical maneuvering is dominant. Breakout potential exists but is not trustable until confirmed by volume and displacement.
⊢
⧉
Cryptorvm Dominvs · ⚜️ MAGISTER ARCANVM ⚜️ · Vox Primordialis
⌬ - Wisdom begins in silence. Precision unfolds in strategy - ⌬
⧉
⊢

BTCUSD 7/18/202590min BOS to the downside has just occurred on the 3rd day of Price trading inside of the 7/14 Bearish Engulfing. Now we may encounter another Bearish leg which in fact is just still the Daily Bearish Retracement.
_SnipeGoat_
_TheeCandleReadingGURU_
#PriceAction #MarketStructure #TechnicalAnalysis #Bearish #Bullish #Bitcoin #Crypto #BTCUSD #Forex #NakedChartReader #ZEROindicators #PreciseLevels #ProperTiming #PerfectDirection #ScalpingTrader #IntradayTrader #DayTrader #SwingTrader #PositionalTrader #HighLevelTrader #MambaMentality #GodMode #UltraInstinct #TheeBibleStrategy

BTCUSDA Mini buy for btcusd targeting a R:R OF 1:2, although the overall trend is a sideways market favoring the downside over the upside. this buy opportunity is worth taking based on shift in market structure and we have a double bottom and order block retest. we will need a major retracement before we have our continuation sell.

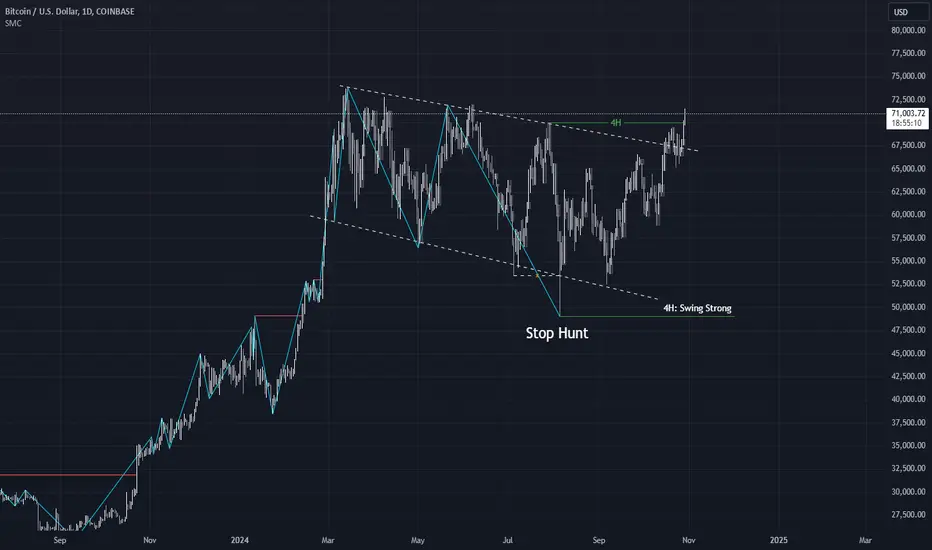
BTC wave structure analysis on 4 hour and daily timeframe- Daily time frame, after price gave stop hunting signal, price increased again.
- On the 4-hour time frame, the price broke through the strong peak and gave a bullish reversal signal.
- So there is a high possibility that BTC will continue to rise and break the previous top.
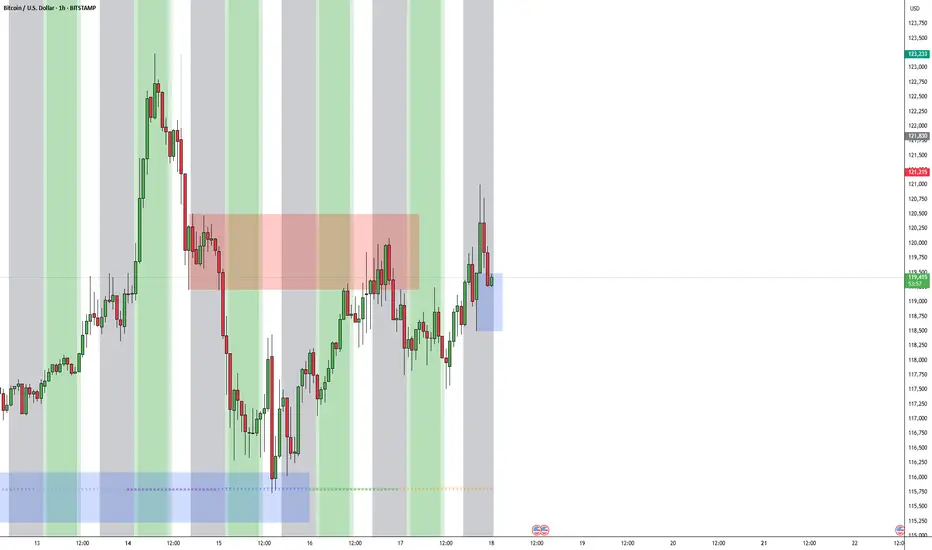
BTC #1-hour chart of Bitcoin (BTC/USD)This is a 1-hour chart of Bitcoin (BTC/USD) with a clear bearish outlook indicated by the analysis:
Key Observations:
Rising Channel:
Price has been moving inside an ascending channel.
Currently testing the lower boundary, suggesting potential for a breakdown.
Price Projection:
A sharp drop is anticipated after breaking the channel, supported by the downward black arrows.
The analyst anticipates a retest of the lower boundary followed by a rejection and continuation downward.
QFL Strategy Reference:
"QFL" (Quick Fingers Luc strategy) is marked with a red line, identifying a key support zone that price may break below.
50% level (retracement or zone midpoint) is noted for confluence.
Target Zone:
Final target appears to be in the $112,500 – $113,000 range.
Summary:
The chart presents a bearish thesis expecting BTC to break the ascending channel and fall toward a previous demand zone marked by the QFL level. The structure supports a short setup if the lower trendline fails to hold.
Risk Note: This is a speculative forecast; always confirm with volume, broader market context, or confirmation patterns.
thank u

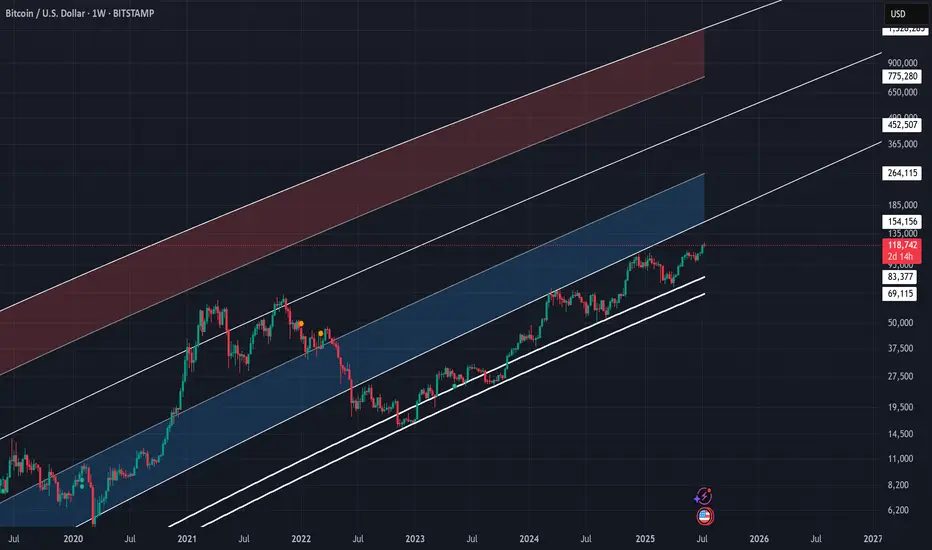
BTCUSD | 1W Time Frame | BITSTAMP ExchangeI have been using curve analysis for Bitcoin on the weekly time frame for a long time, employing two indicators: My BTC Log Curve and Bitcoin Logarithmic Growth Curves, of course, with my own custom settings to achieve maximum harmony with price movements. I recommend that to gain a precise understanding of Bitcoin curve analysis, you search for and study it, and make use of the two free indicators mentioned above.
Bitcoin finally managed to break free from the curve floor in the second week of September 2023, initiating a logical and gradual upward trend. Currently, it is supported by a significant level around $84,000 (keeping in mind that this rate will gradually increase due to the market's floating nature). However, the most critical price ceiling for Bitcoin in the current bullish market trend is approximately $154,000. Given the acceptable momentum of the current upward trend, reaching this price target seems reasonable. Nevertheless, we should anticipate a corrective reaction from the market, considering the historical behavior in this price range.
In summary, it can be stated that for mid-term holders, the price target of $154,000 appears to be a realistic and attainable goal, while the price floor of $84,000 serves as a very suitable level for buying and re-accumulating.
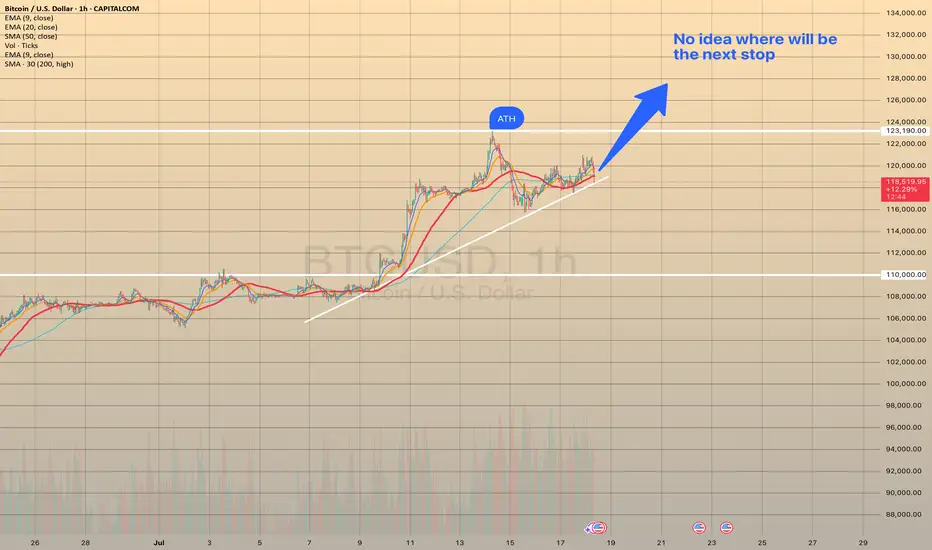
BTCUSD - GOOD SUPPORT ESTABLISHED?BTCUSD - GOOD SUPPORT ESTABLISHED?📈
Yesterday, after a record-breaking nine-hour House session, U.S. lawmakers passed three major crypto bills: CLARITY Act (294-134), which establishes a market structure for cryptocurrencies, GENIUS Act (308-122) that supports U.S. stablecoin innovation and an Anti-CBDC Surveillance State Act (219-210) that opposes central bank digital currencies. All of this supports crypto and especially Bitcoin.
Technically, BTCUSD looks bullish also, establishing a new bullish trend. I expect the ATH at 123,190.30 will be rewritten soon. Where will be the next stop, I've got no idea. To my mind, the best strategy here will be to buy on trend support, then transfer the stop loss at your entry point and sell o local hikes.
Stay tuned for the next report! 🔔
Bitcoin sell now for 4h time frame trend reversal Bitcoin sell now for 4h time frame trend reversal From here

"Bitcoin Bearish Setup: Breakdown Targeting 117,509"This Bitcoin (BTC/USD) 45-minute chart shows a bearish setup with key levels marked. After a breakdown from the support area, price is expected to drop. The suggested short entry is just below 119,639, with a stop loss at 120,984 and a target at 117,509. The chart highlights an order block, support area, and projected downward move.

Btcusd techinical analysis.Btcuad techinical analysis next move posibale at h1 time frame.not finchinical advice.

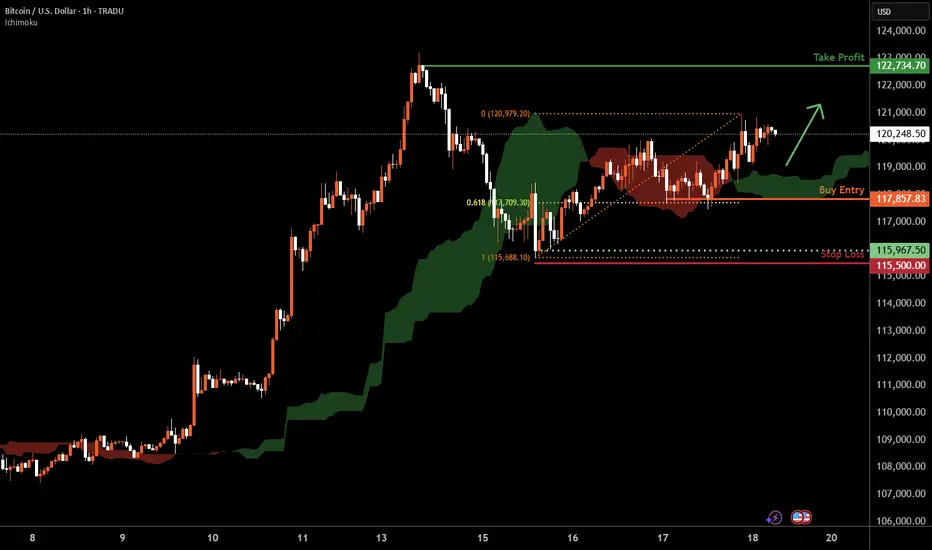
Bitcoin H1 | Falling toward a 61.8% Fibonacci supportBitcoin (BTC/USD) is falling towards a swing-low support and could potentially bounce off this level to climb higher.
Buy entry is at 117,857.83 which is a swing-low support that aligns with the 61.8% Fibonacci retracement.
Stop loss is at 115,500.00 which is a level that lies underneath a swing-low support.
Take profit is at 122,734.70 which is a swing-high resistance.
High Risk Investment Warning
Trading Forex/CFDs on margin carries a high level of risk and may not be suitable for all investors. Leverage can work against you.
Stratos Markets Limited (tradu.com ):
CFDs are complex instruments and come with a high risk of losing money rapidly due to leverage. 66% of retail investor accounts lose money when trading CFDs with this provider. You should consider whether you understand how CFDs work and whether you can afford to take the high risk of losing your money.
Stratos Europe Ltd (tradu.com ):
CFDs are complex instruments and come with a high risk of losing money rapidly due to leverage. 66% of retail investor accounts lose money when trading CFDs with this provider. You should consider whether you understand how CFDs work and whether you can afford to take the high risk of losing your money.
Stratos Global LLC (tradu.com ):
Losses can exceed deposits.
Please be advised that the information presented on TradingView is provided to Tradu (‘Company’, ‘we’) by a third-party provider (‘TFA Global Pte Ltd’). Please be reminded that you are solely responsible for the trading decisions on your account. There is a very high degree of risk involved in trading. Any information and/or content is intended entirely for research, educational and informational purposes only and does not constitute investment or consultation advice or investment strategy. The information is not tailored to the investment needs of any specific person and therefore does not involve a consideration of any of the investment objectives, financial situation or needs of any viewer that may receive it. Kindly also note that past performance is not a reliable indicator of future results. Actual results may differ materially from those anticipated in forward-looking or past performance statements. We assume no liability as to the accuracy or completeness of any of the information and/or content provided herein and the Company cannot be held responsible for any omission, mistake nor for any loss or damage including without limitation to any loss of profit which may arise from reliance on any information supplied by TFA Global Pte Ltd.
The speaker(s) is neither an employee, agent nor representative of Tradu and is therefore acting independently. The opinions given are their own, constitute general market commentary, and do not constitute the opinion or advice of Tradu or any form of personal or investment advice. Tradu neither endorses nor guarantees offerings of third-party speakers, nor is Tradu responsible for the content, veracity or opinions of third-party speakers, presenters or participants.
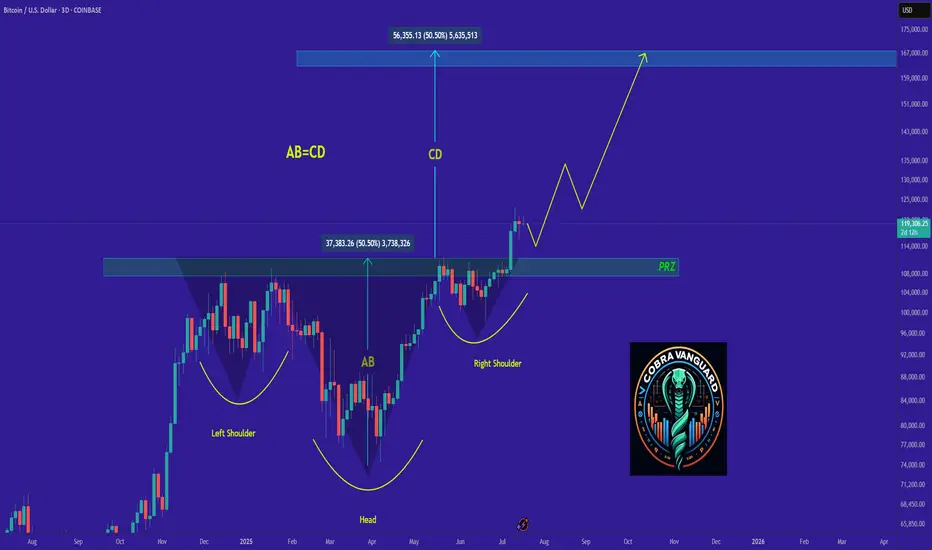
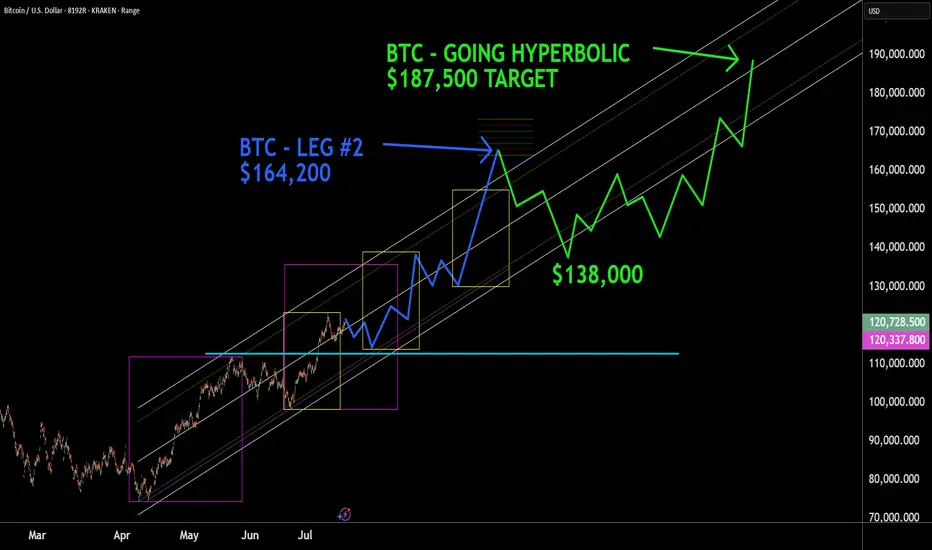
BTC - HYPERBOLIC FINISH This box here where we right shit in, what it really worth? You will never understand technical analysis if you think reading words in a little box mean something. BTC , next top mid frame with a throw over of center to $164,000. Then consolidation around the core to $138,000, then the hyperbolic finish to $187,500+. Nuf said. Good luck. Volatility will be high, but mainly move in one direction. Murrey Math, ( Which trading view wont let me display because its an unpublished indicator , Elliott Wave, Kumar Wave being used for this forecast.
Bitcoin: Short term tradeHello,
Cryptocurrencies, particularly major coins like Bitcoin, have experienced a volatile yet exhilarating rally in July 2025, reaching unprecedented all-time highs. This surge has attracted significant attention, drawing in new investors driven by fear of missing out (FOMO) and heightened market enthusiasm. While Bitcoin’s long-term potential remains robust, our analysis suggests a near-term correction is likely.
From a technical perspective, Bitcoin is currently undergoing a corrective phase as early investors capitalize on recent gains by taking profits. Chart patterns indicate the formation of a bullish flag, a continuation pattern that often precedes further upside after a consolidation period. We recommend that investors exercise patience and wait for the correction to fully develop. Optimal buying opportunities are anticipated around the $113,000 level, with a short-term price target of $130,000.
A key technical indicator, the Moving Average Convergence Divergence (MACD), is approaching a zero-line crossover, which could serve as a strong catalyst to confirm the resumption of Bitcoin’s upward momentum. We remain bullish on Bitcoin, maintaining an overweight position in our portfolio with a short-term target of $132,000.
Disclosure: I am part of Trade Nation's Influencer program and receive a monthly fee for using their TradingView charts in my analysis.

Bitcoin Extends Rally – Eyeing $121K+📊 Market Overview:
•Bitcoin is trading around $120,013, up +0.0149% on the day, with a daily range of $117,715 – $120,691 — continuing momentum after a historic rally.
•The rally is supported by strong inflows into BTC ETFs, institutional demand, and pro-crypto legislation recently passed in the U.S. House of Representatives.
📉 Technical Analysis:
• Key resistance: $121,000 – $122,000 (next technical target post breakout)
• Nearest support: $118,000 – $119,000 (aligns with 50 MA and previous consolidation zone)
• EMA 09: Price is above the EMA 09, confirming strong short-term bullish momentum
• Candlesticks / Volume / Momentum: RSI and MACD remain bullish; rising volume in ETFs and institutional flows confirm upward momentum.
📌 Outlook:
Bitcoin is likely to extend its gains in the short term if it holds above $119,000–$120,000 and institutional buying continues.
• Holding above $120,000 → potential to test $121,000 – $122,000
• Falling below $119,000 → risk of correction to $118,000
💡 Suggested Trading Strategy:
BUY BTC/USD at: 119,500 – 120,000
🎯 TP: 121,500
❌ SL: 118,500
SELL BTC/USD at: 121,000 – 122,000 (if bearish reversal signals appear)
🎯 TP: 120,000
❌ SL: 122,500

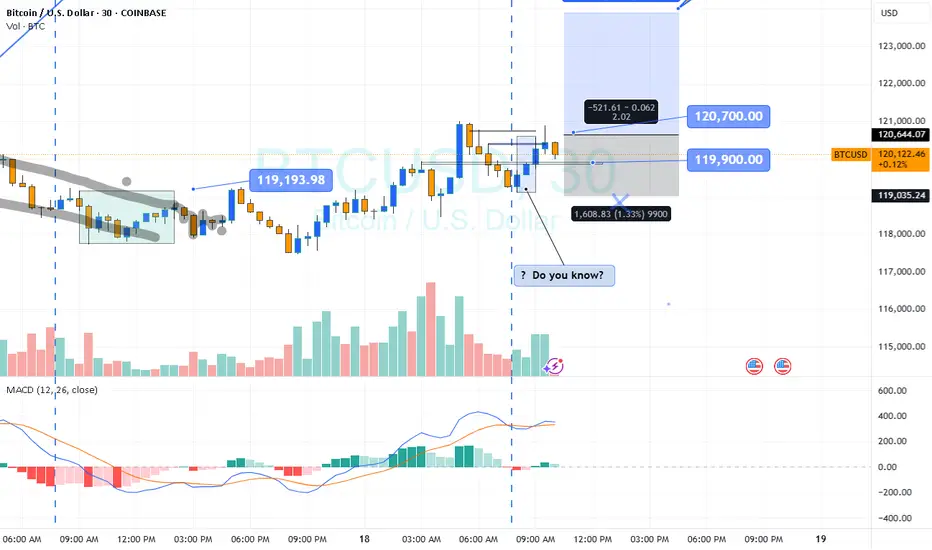
BTC intra?
Hi
Do you know?
www.investopedia.com
If your initial plan is BUY.. whatever reasons: Fundamental/ outlook buy
We'll take this trade; reason
Two Yeses : Outlook BUY Pattern BUY
How will it react?
Answer: I don't know
High probability : Yes
Where do you enter? Your preference
wait retrace or now... just
If you wait.. might not get the ticket
If calculate between entry and stop loss: pips
And divide by what you re risking in $ to pips
All the best
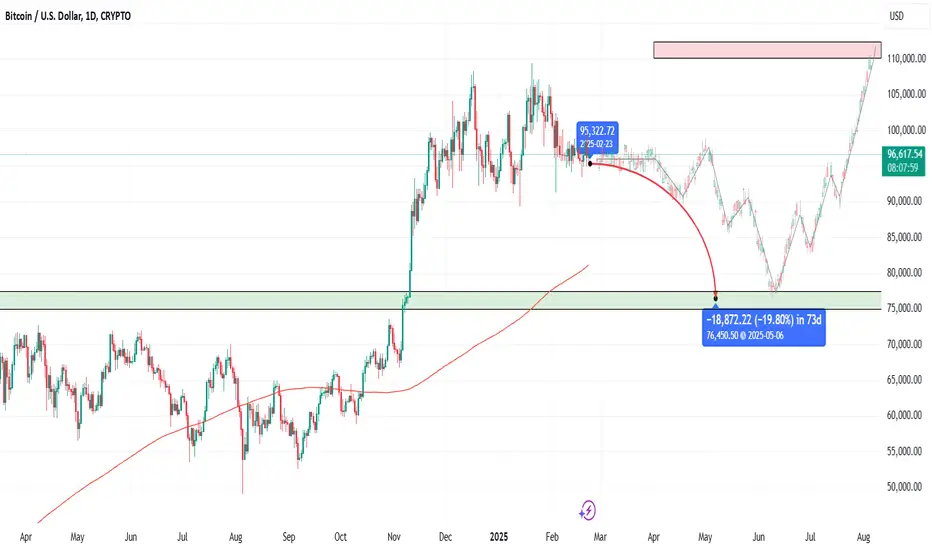
BTC OutlookIn the volatile world of trading, uncertainty is the only constant. Could prices dip to 75k before surging to 115k? Is such a drop a brief pullback or the start of a prolonged downturn? What technical or fundamental signals might indicate a recovery toward 115k?
Disclaimer: This content is for informational purposes only and does not constitute financial advice. Always consult a professional before making any investment decisions.
BTC Longsim looking at crypto longs from here because the market is showing signs of a bullish continuation.