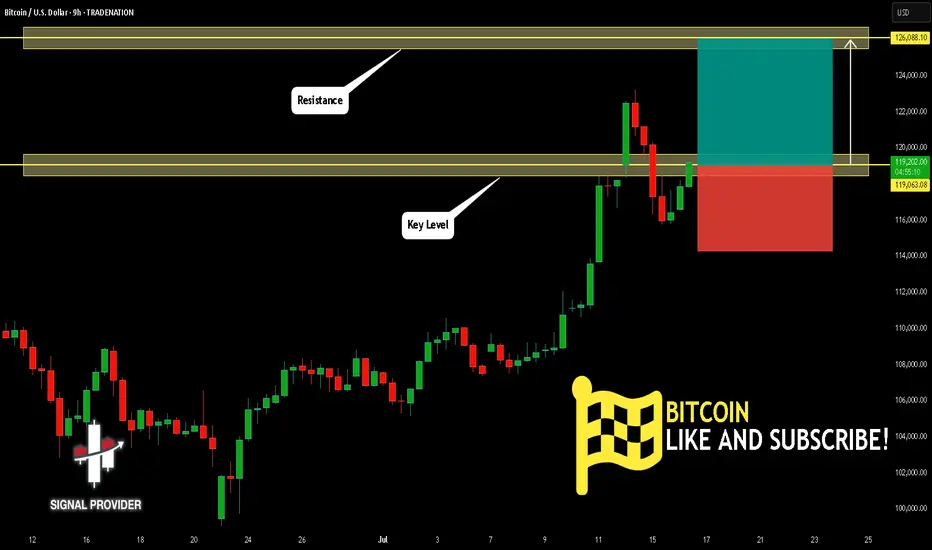
BITCOIN Will Go Higher! Long!
Here is our detailed technical review for BITCOIN.
Time Frame: 9h
Current Trend: Bullish
Sentiment: Oversold (based on 7-period RSI)
Forecast: Bullish
The market is trading around a solid horizontal structure 119,063.08.
The above observations make me that the market will inevitably achieve 126,088.10 level.
P.S
Overbought describes a period of time where there has been a significant and consistent upward move in price over a period of time without much pullback.
Disclosure: I am part of Trade Nation's Influencer program and receive a monthly fee for using their TradingView charts in my analysis.
Like and subscribe and comment my ideas if you enjoy them!
BTCUSD trade ideas
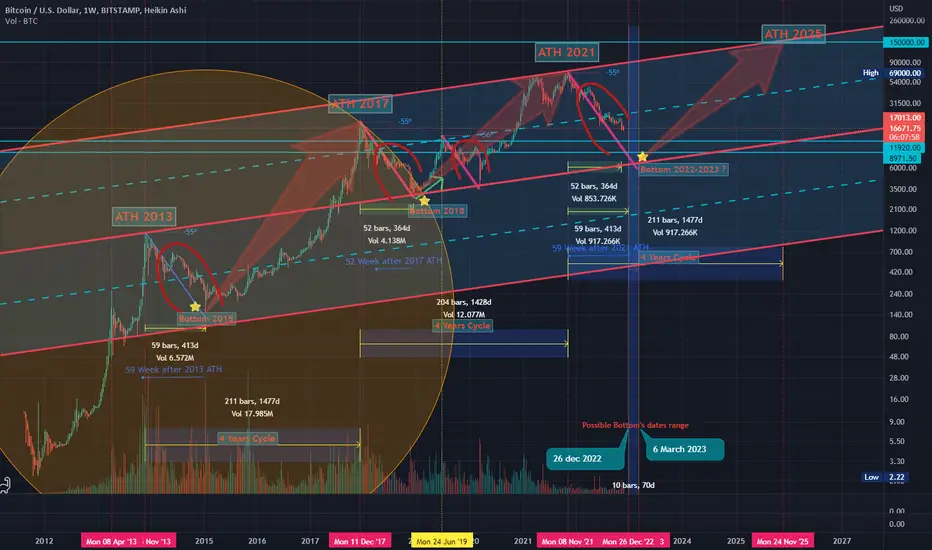
BTC Bottom & New ATH..... when ?!!! Hello Guys
There are some notes of BTC weekly Chart:
1. We have a new ATH every 4 years ( 1428-1477 ) days..
2. After the ATH we take about ( 52-59 ) weeks to make a new bottom then we go up a little ...
3. Every time we reach a new ATH we drop down in a same angle (-55) before the new bull run starting .... look at my chart ( Red angles and curves ):
****** We dropped from ATH 2013 to Bottom 2015 by an angle ( -55 ) .
****** We dropped from ATH 2017 to Bottom 2018 by an angle ( -55 ) .
****** Same (24 July 2019) we dropped from local top to the local bottom by Angle ( -56 ) .
****** Will we drop from ATH 2021 to Bottom (2022 - 2023) by the same angle ( -55 or -56 )??
4. In my opinion , I expect we will reach the final bottom between ( 26 December 2022 : 6 march 2023 ).
5. I don't care what will be the price of BTC then , but I care only for when will be the possible bottom !!.
But if we can try to expect the price it will be in a range of ( 11900 : 9000$) ...
Note:( 10K - 10500$) is very very strong demand area for BTC .
-------------------------------------------------------------------------------------------------------------------------------------------------------------------------------------------------------
Finally , I think the new ATH will not be before Nov 2025 ( 150k $ ).
It is not a financial advice , I am only share my thoughts with u :)
Thank u and good luck.
7:1 R:R setup for BTCIt looks like BTC has completed its pullback and is now continuing its uptrend. This trade setup offers a 7:1 R:R with a target of 135K
Entry: 118,900
Stop Loss: 117,000
Target: 135,000
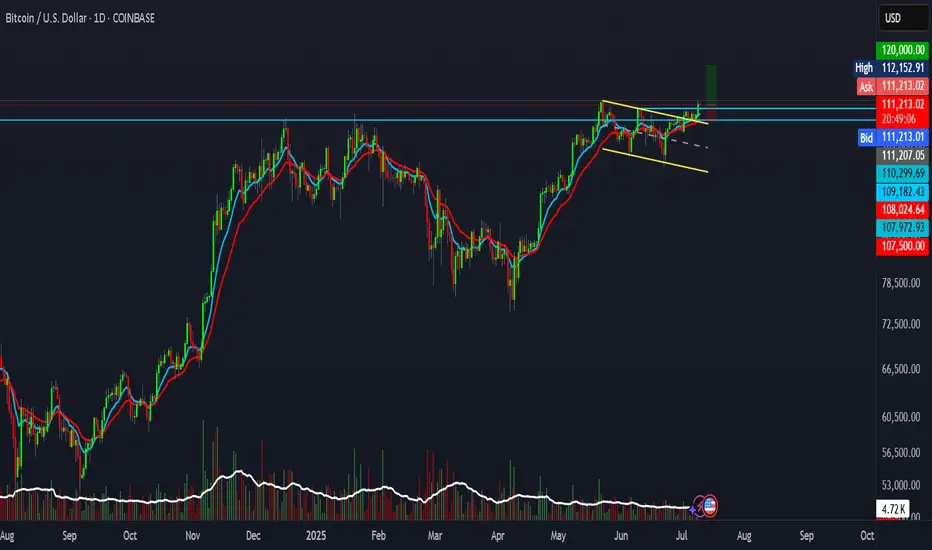
BTC setup with 2R R:R.BTC is showing signs of a real breakout.
This setup offers a 2:1 risk-reward ratio.
Entry: 111,207
Stop Loss: 107,500
Target: 120,000
Not financial advice.
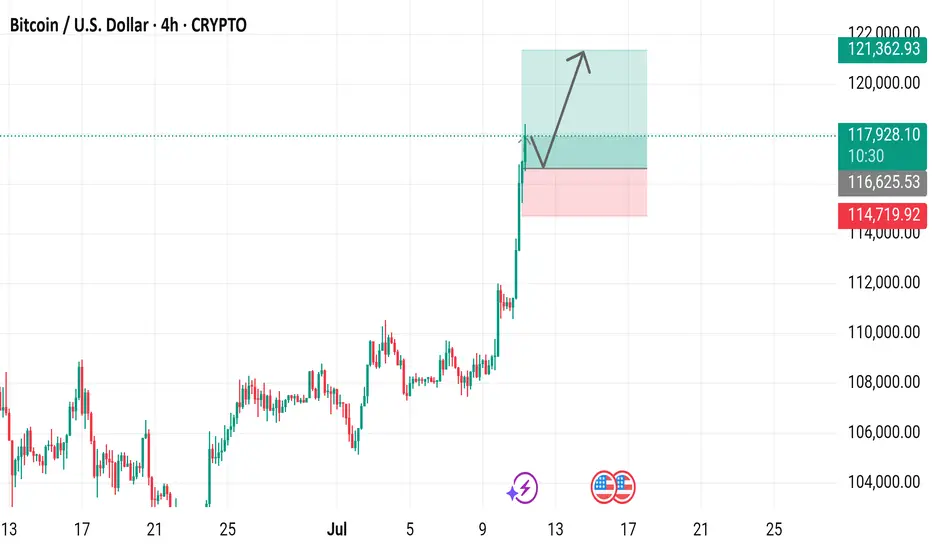
BTC/USD 4H Technical & Fundamental AnalysisBTC/USD 4H Technical & Fundamental Analysis
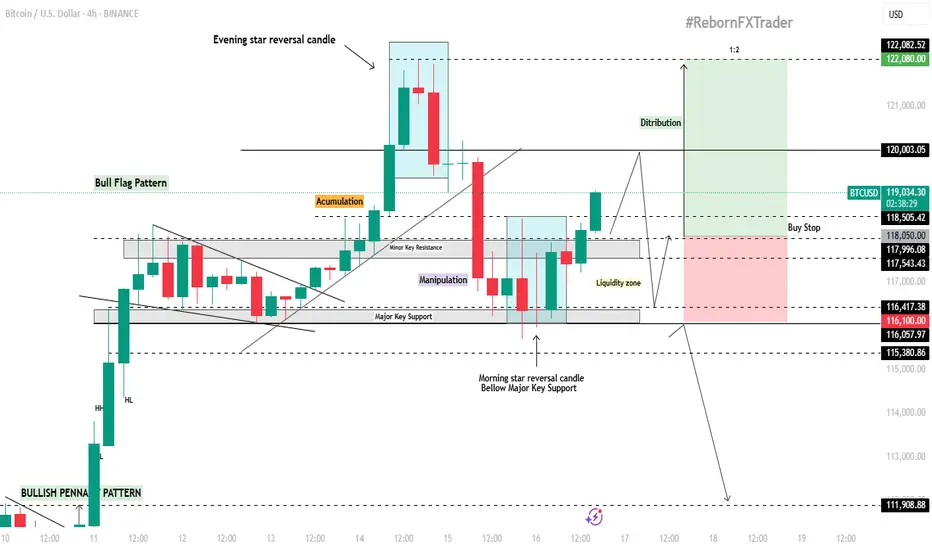
Bitcoin remains fundamentally bullish as institutional adoption continues to rise through Spot ETF inflows, while post-halving supply pressure tightens the available BTC in circulation. Additionally, the upcoming regulatory clarity such as the GENIUS Act could pave the way for major institutions like JPMorgan to issue their own stablecoins, further bridging the gap between crypto and traditional finance. On the technical side, BTC is currently consolidating around the 116,200 level, potentially forming a bull flag pattern on the 4H timeframe. This zone has acted as a major support level due to multiple historical touches.
Previously, price reached an all-time high around 122,000 before forming an Evening Star reversal pattern, leading to a pullback back to the 116,200 zone. A Morning Star reversal then formed on this key support, suggesting renewed bullish momentum.
Our current objective is to wait for price to climb toward the 120,000 level, where we anticipate a potential liquidity grab within the highlighted liquidity zone.
📍Buy Stop Setup:
Buy Stop Entry (AOI): Around 118,050
Stop Loss: 116,100 (below liquidity zone)
Take Profit: 122,080
📌 Disclaimer:
This is not financial advice. Always wait for proper confirmation before executing trades. Manage risk wisely and trade what you see—not what you feel.
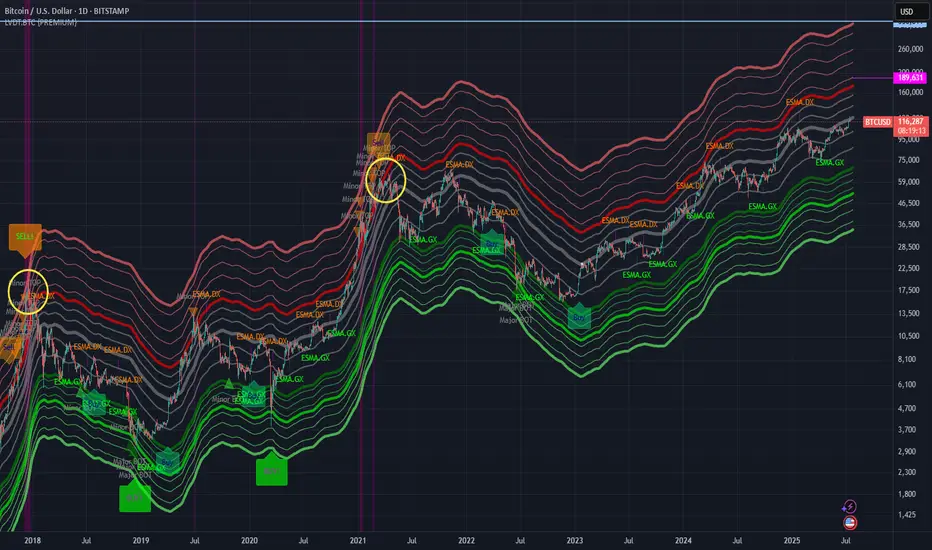
$300k+: LVDT estimated BTC ATH target this cycle.According to my old LVDT indicator, BTC should reach $300k or even higher at ATH this cycle.
The real parabolic (banana zone) run will only start when BTC touches the thick red line again.
Time to gradually DCA sell every time BTC pierces significantly above the thick red line (signaling a potential point of Blow-off-Top).
I plan to be updating this tread from time to time as the chart progresses until the absolute "Sell" signal is triggered.
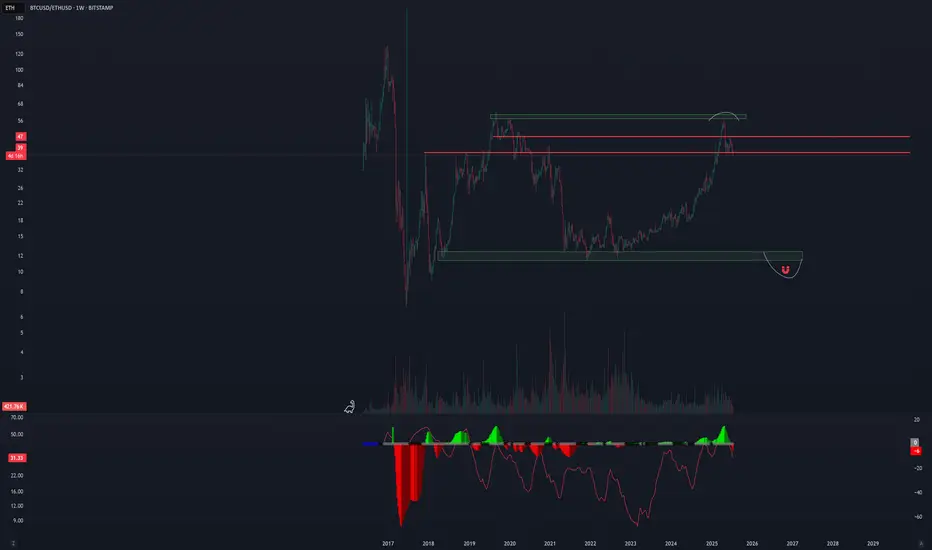
Alt Season uploadingAs BTC dominance is in a reversal key level, BTC/ETH also looks like in a reversal trend. Considering the total cripto market cap making ATH and breaking a heavy resistance, it seems like we are going to enter in a alt season. Let's see...
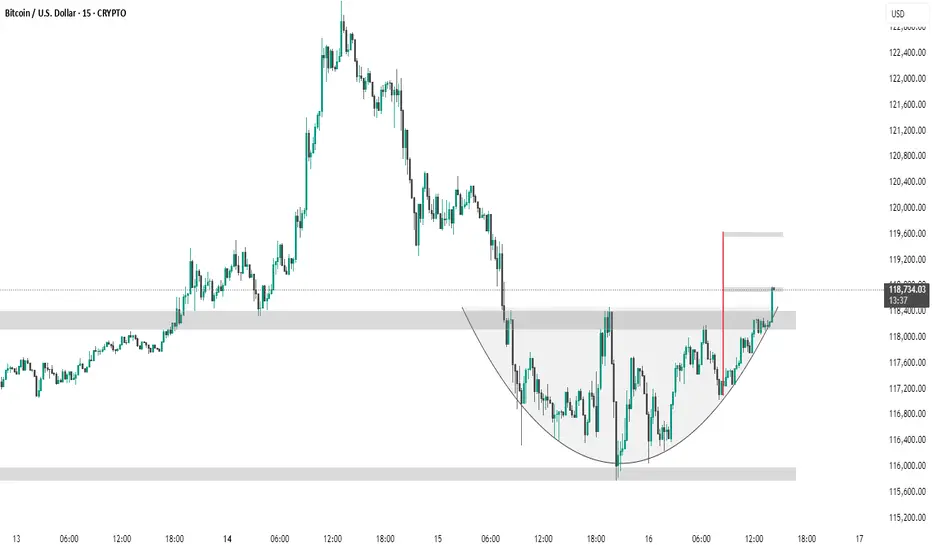
BTC #ARC Structure has breakout its levelThe chart shows a 15-minute BTC/USD timeframe forming a cup and handle pattern, a bullish continuation signal. Price has broken above the handle resistance zone (~$118,400), suggesting a potential breakout. The red vertical line marks the expected target, projecting a move toward the $119,600 level based on the pattern height.
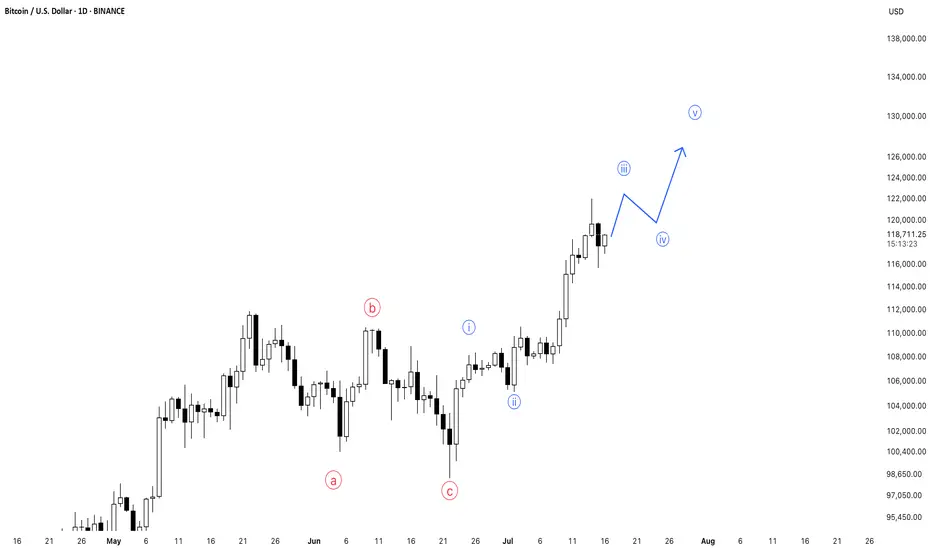
BTC Nearing Completion of Wave 3 – Correction Ahead?Bitcoin is approaching the end of its Wave 3 movement, which suggests a possible correction phase in the near future.
However, this is likely just a temporary pause before the next bullish wave continues the uptrend.
Stay patient and watch for key support levels to prepare for the next buying opportunity.
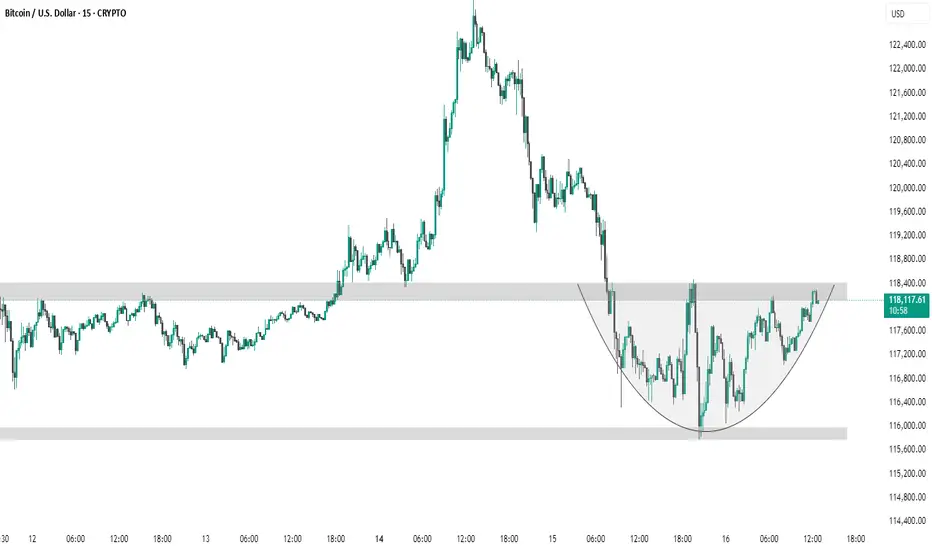
BTC #ARC FormationThe chart **15-minute Bitcoin (BTC/USD)** candlestick pattern with a clearly drawn **cup and handle** or **rounded bottom** formation. Let's identify key levels:
---
🔍 **Key Levels Identified:**
1. **Resistance Zone (Neckline of Cup)**
Level:** \~**118,400 USD**
Significance:** This is the upper gray zone where price has repeatedly been rejected. It's acting as a **resistance** and also forms the **neckline of the cup pattern**. A breakout above this level may indicate bullish continuation.
2. **Support Zone (Bottom of Cup)**
Level:** \~**115,800 – 116,000 USD**
Significance:** This is the **lowest point** in the recent pullback and serves as strong support**. The price rebounded from here to form the cup.
3. **Mid-Level / Breakout Point**
Current Price:** \~**118,067 USD**
Significance:** Price is testing the **resistance**. A candle close and confirmation above 118,400 could trigger a bullish move, possibly targeting previous highs near **121,600 USD** or more.
---
⚠️ Watch For:
Breakout confirmation above 118,400 USD** with volume for bullish continuation.
Rejection at 118,400 USD** could lead to a pullback or handle formation.
Support holding above 116,000 USD** is key to maintain bullish structure.
Let me know if you want price targets or entry/exit suggestions based on this setup.
thank u
Bitcoin Buy Bias – On-Chain Confidence Still Has Room to RunThe On-chain Confidence indicator is showing signs of increasing sell pressure and profit-taking, but it still remains well below the historical peaks seen in previous bull market tops (2017 & 2021).
👉 This is a composite indicator combining several key on-chain metrics like RHODL Ratio, Puell Multiple, and MVRV, among others.
📊 The current level resembles early 2024 and early 2025, suggesting we are not yet at extreme sentiment levels.
If this indicator continues to climb toward its previous cycle highs, it may signal that we’re entering the final leg of this bull run. For now, there’s still room for upside momentum.
Bitcoin - V-shape recovery down towards the 4h FVG at $111.000?The move began with a strong rally that peaked near the $123,000 level. After hitting that high, Bitcoin quickly reversed and sold off aggressively, forming a classic V-shaped pattern. This type of formation typically indicates a strong shift in momentum, where bullish control is quickly overtaken by sellers, leading to swift downward movement.
4H bearish FVG
Shortly after the initial drop, Bitcoin made a retest of the bearish 4H FVG (Fair Value Gap) around the $119,000 to $120,500 zone. This fair value gap was created during the sharp move down and represented an area of inefficiency in price. The chart shows that price moved back into this zone and was “perfectly retested,” getting rejected almost immediately. This rejection confirmed that sellers are respecting this imbalance, turning it into a short-term resistance level.
Market structure
As the price failed to reclaim the fair value gap and continued lower, it broke the market structure at around $117,000. This break suggests that the previous higher low was taken out, signaling a bearish shift in the intermediate trend. The market structure break often acts as confirmation that buyers are losing control and lower prices are likely.
CME gap
Adding to the downside pressure is the CME gap, labeled as the "BTC CME GAP" on the chart. This gap spans from roughly $114,000 to $116,300 and was formed over the weekend when the CME (Chicago Mercantile Exchange) was closed. Historically, Bitcoin has shown a tendency to "fill" these gaps by revisiting the price levels within them. The current price action has already started to dip into this region, which could suggest further downside to complete the gap fill.
Bullish 4H FVG with support
Finally, the chart hints at the potential drop to the lowest 4H FVG and previous resistance, located just above $111,000. This fair value gap aligns closely with a prior resistance level from earlier in the month, making it a logical magnet for price if selling pressure persists. It represents a confluence zone where buyers may look to step in again, especially if the CME gap is filled and the market is searching for support.
Conclusion
In summary, Bitcoin is showing bearish technical signs following a V-shape top and a strong rejection from the 4H FVG at $120,000. The break of market structure and ongoing fill of the CME gap suggest that further downside toward the $111,000 level is a strong possibility. Traders should watch closely for price reaction in that lower fair value gap zone, as it could serve as a critical area for a potential bounce.
Disclosure: I am part of Trade Nation's Influencer program and receive a monthly fee for using their TradingView charts in my analysis.
Thanks for your support. If you enjoyed this analysis, make sure to follow me so you don't miss the next one. And if you found it helpful, feel free to drop a like and leave a comment, I’d love to hear your thoughts!

BITCOIN NEXT TARGET 1205001. Professional & Direct:
BTC Long in Play – Eyes on 120,500 🔥
Momentum building strong. Stay in the trend — next target: 120.5K.
---
2. TradingView Style (Engaging):
Bitcoin Bulls Gaining Strength 🚀
Long position active. Targeting next major level at $120,500 — hold tight!
---
3. VIP Signal Tone:
BTC BUY Signal Active ✅
We’re riding the wave to $120,500. Strong confirmation on higher timeframes.
BTC! BREAK OUT.Initially i was hesitant to call thiss bottom and I will risk my non exsistant repution. That if we break through this resistance and pump a 1-2% break through 4 hour FVG we going ballistic I dont belive in 150k this month I believe in 127-130 k and a trtacement to 113k to fill CME gap. W tradez.
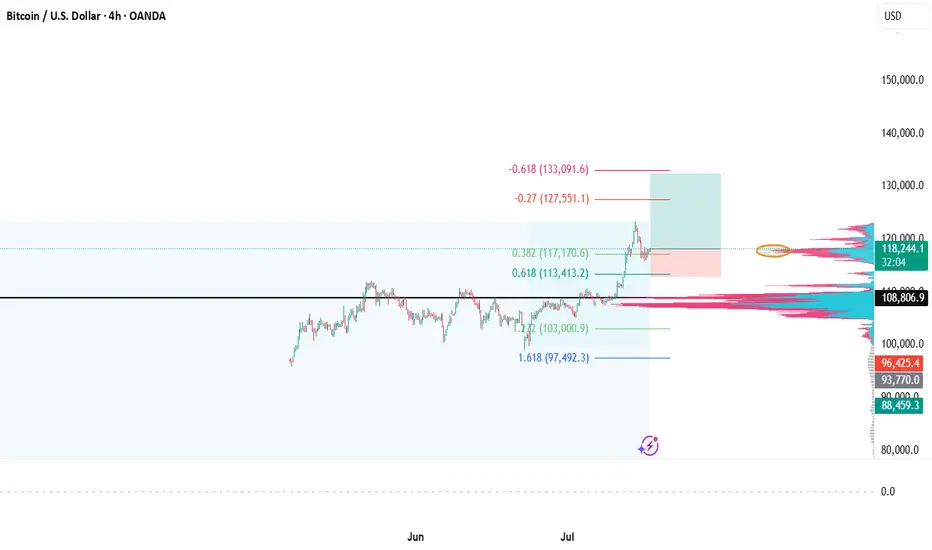
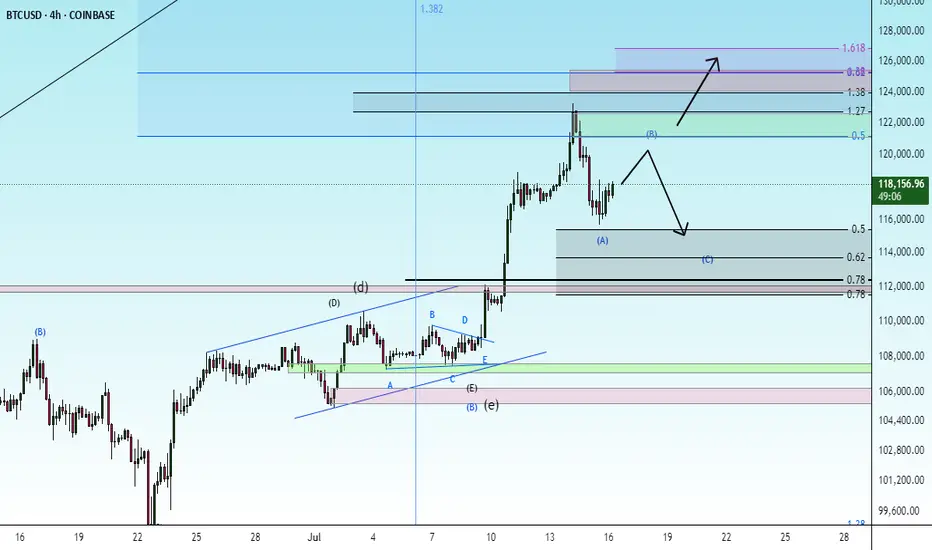
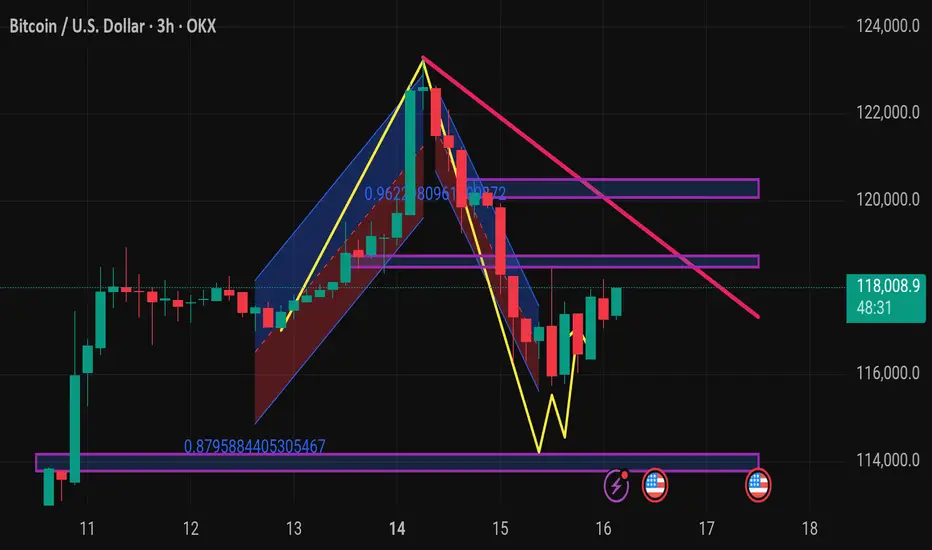
correctionGiven the completion of the current upward trend, the corrective pattern is expected to move along the specified path and go to the specified Fibonacci levels. Then the continuation of the upward trend will be possible.
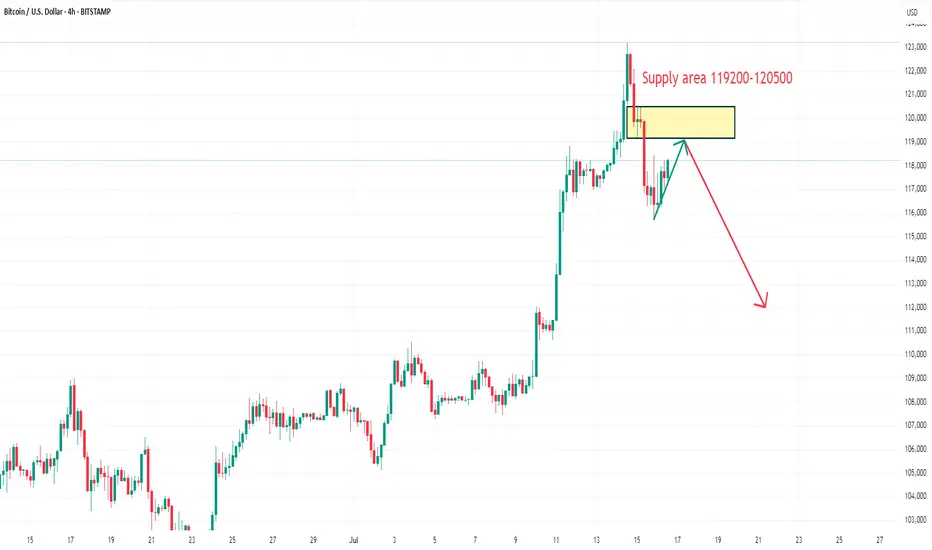
BTCUSD focuses on shorting in the supply zoneOn the 4-hour chart, BTCUSD has fallen from its historical high. Currently, we can focus on the supply zone of 119200-120500. If the rebound is blocked, we can consider shorting. The downside target is around 112000.
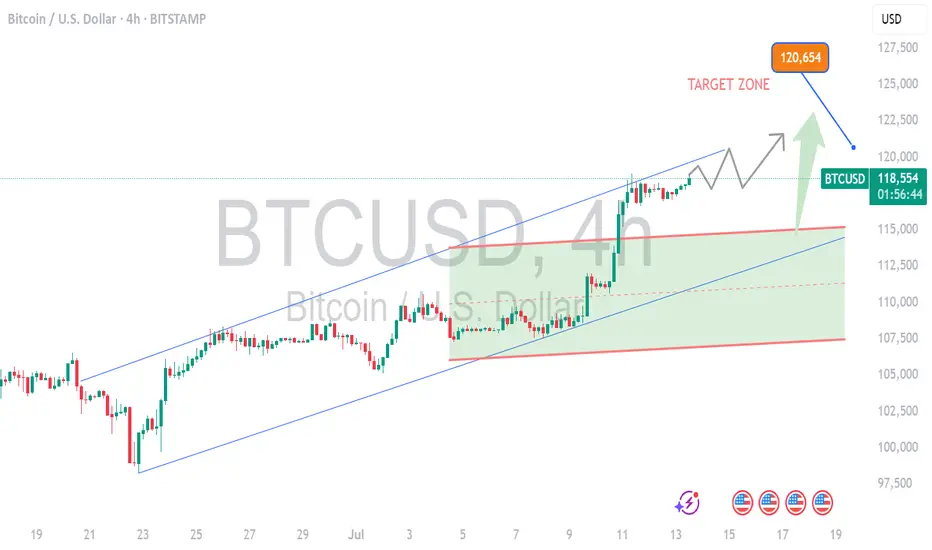
Bitcoin / U.S. Dollar 4-Hour Chart (BTCUSD)4-hour chart displays the recent price movement of Bitcoin (BTC) against the U.S. Dollar (USD) as of July 11, 2025. The current price is $117,979.53, reflecting a 4-hour increase of $1,938.91 (+1.67%). The chart highlights a significant upward trend, with a notable breakout above the $114,719.92 resistance level, reaching up to $121,362.93. Key price levels include support at $116,625.93 and resistance at $121,362.93, with buy and sell options marked at the current price.
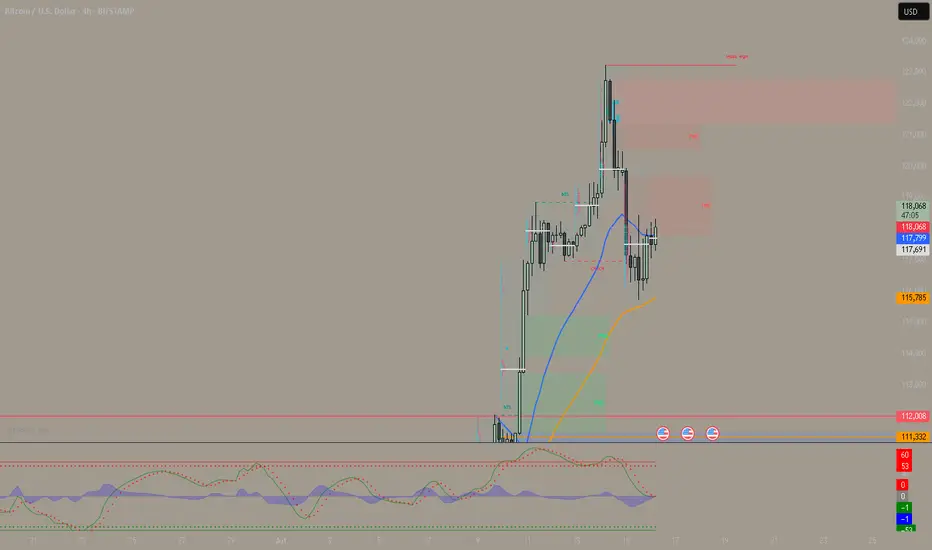
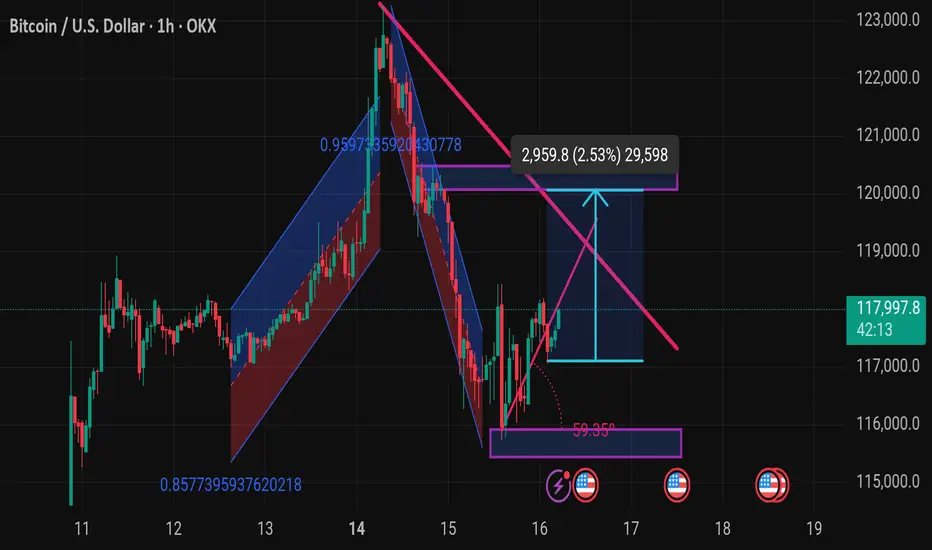
Btcusd techinical analysis.This Bitcoin (BTC/USD) chart from TradingView illustrates a technical analysis on the 1-hour timeframe. Here's a breakdown of the key elements and possible implications:
---
🔍 Chart Overview:
Current Price: $117,997.8
Timeframe: 1-hour candles
Exchange: OKX
Date/Time: July 16, 2025, 05:16 UTC
---
🧠 Key Technical Patterns & Indicators:
1. Descending Triangle Breakout Setup:
A descending resistance line (in pink) is converging with a horizontal support level (around $116,000–$117,000).
The price appears to be testing the upper boundary, indicating a potential breakout.
2. Target Measurement:
The blue arrow pointing upward suggests a measured move after a breakout.
Target Price: ~ $120,957.8 (approx. 2.53% move or +2,959.8 points from breakout level)
3. Support Zone:
Strong horizontal support zone marked in purple near $116,000.
This zone has held despite a sharp dip, indicating buyer interest.
4. Previous Trend Channels:
Blue and red channels represent bullish and bearish trends.
Recent bearish
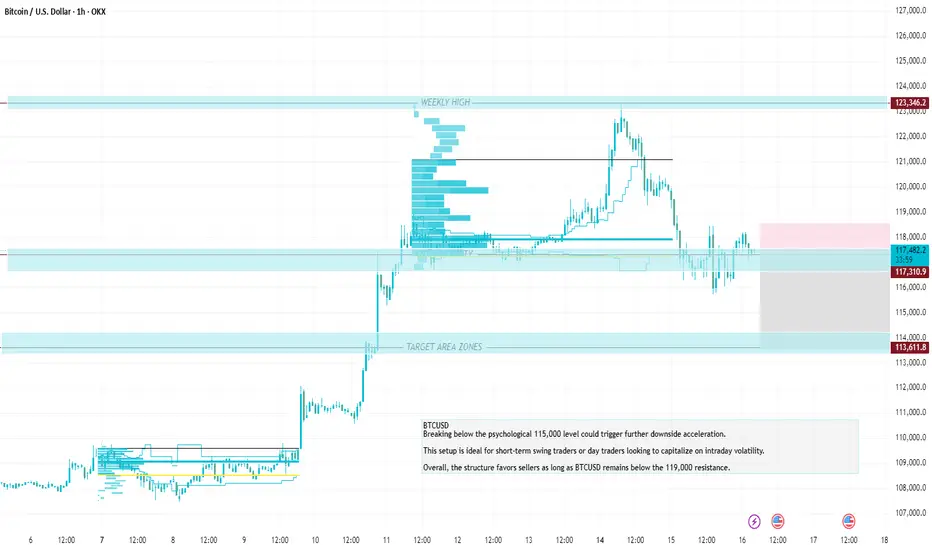
Breaking below the psychological 115,000 level could trigger furMomentum indicators such as RSI and MACD likely show bearish divergence or downward momentum, supporting the short thesis.
The recommended stop-loss for this setup is at 119,000, which is just above recent resistance and protects against false breakouts.
This SL level offers a good risk-reward ratio, with approximately 2:1 or better depending on entry precision.
If price fails to reclaim 119,000 or form higher highs, the bearish momentum is expected to persist.
Price rejection candles or bearish engulfing patterns near 117,500 further validate short entries.
Breaking below the psychological 115,000 level could trigger further downside acceleration.
This setup is ideal for short-term swing traders or day traders looking to capitalize on intraday volatility.
Overall, the structure favors sellers as long as BTCUSD remains below the 119,000 resistance.
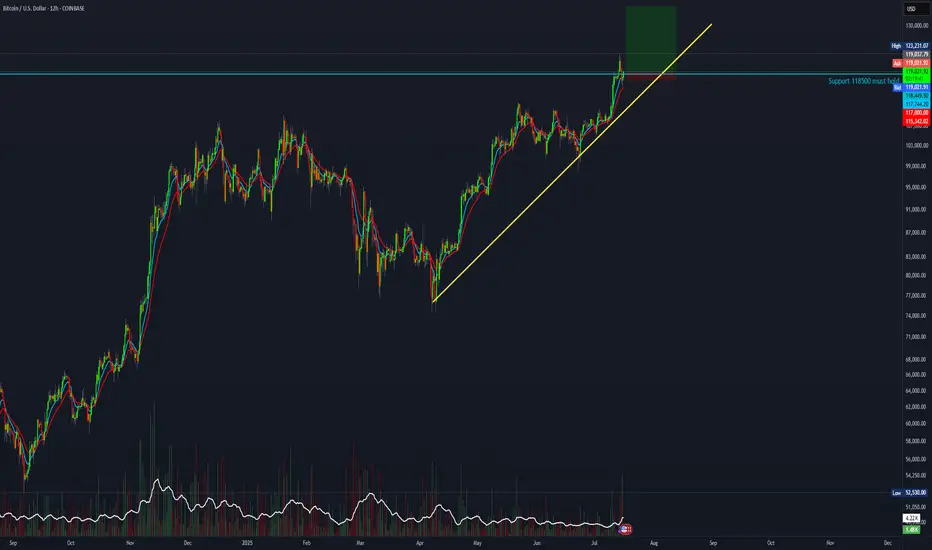
What Btc actually wants to sayThis trend line on daily chart shows sustain growth in BTC and it is rising day by day, Pure bullish in long run.
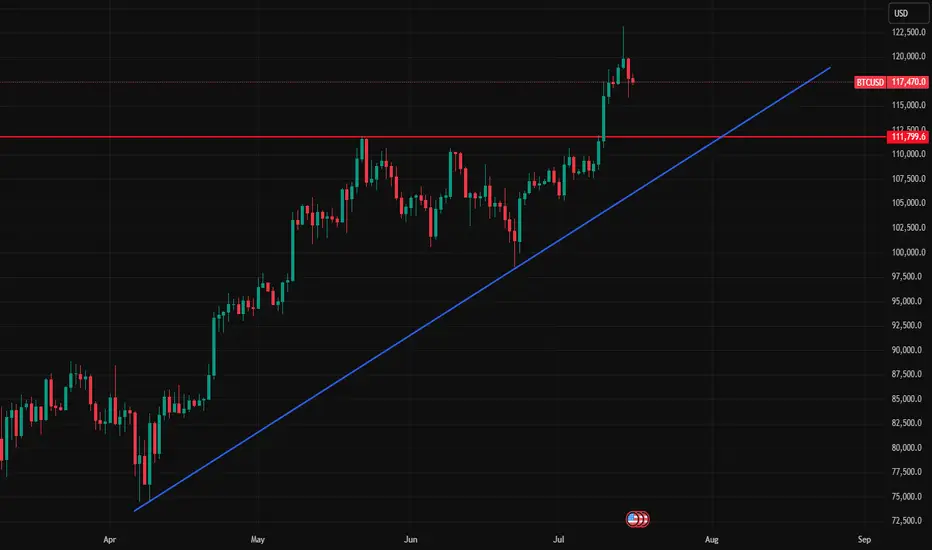
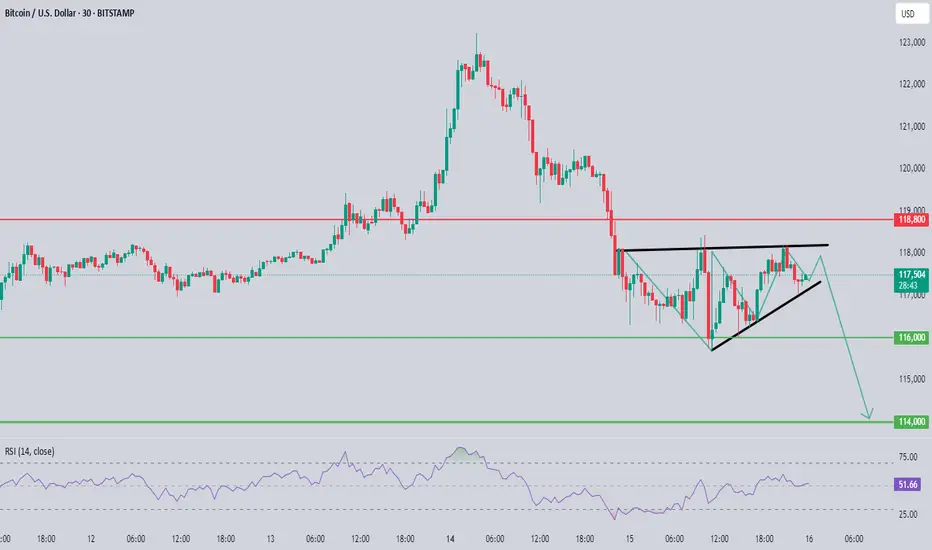
XAU/USD Chart Pattern ObservedBased on the image you've shared, this is a technical analysis chart for gold (XAU/USD), with a visible bearish setup in play. Here’s a detailed sell-side analysis:
Chart Pattern Observed
Bearish Pennant/Wedge Breakout:
The price appears to be breaking out downward from a rising wedge or bearish pennant pattern.
These patterns typically indicate a continuation to the downside after a short consolidation or pullback.
Key Levels Identified
Resistance Zone:
118.800 (Strong resistance level marked in red)
Price failed to break above this and reversed, confirming it as a solid supply zone.
Current Price: Around 117.500
Support Levels (Take Profit Targets):
116.000 – Minor support/first TP level
114.000 – Major support/final TP level (likely the full target of the move)
RSI Indicator
RSI at 50.71 – neutral but pointing slightly downward.
This gives room for further bearish momentum to unfold.
Sell Trade Setup
Entry: After confirmed break below the rising trendline (around 117.800 - 117.500)
Stop Loss: Above 118.800 (just above the resistance zone to avoid fakeouts)
Take Profits:
TP1: 116.000
TP2: 114.000
Trade Justification
Clear lower highs forming.
Rejection at strong resistance.
Breakdown of rising structure = bearish continuation.
Bearish projection arrows on chart suggest institutional outlook favors sell.
Risk Management
Use proper lot sizing based on your account balance and risk %.
Look for a retest of the trendline as a safer sell entry if missed the initial break.
Why Risk Management Is Your Only Real Superpower in TradingMany traders obsess over entries, indicators, or finding the “perfect” strategy…
But the real longevity in this game comes from how you manage risk — not how often you’re right. Obviously it all starts with using stop loss. I hope you already know it. We all learned lessons in trying to enter the top / bottom and it was really not the top/ bottom yet.
✅ Always use Stop Loss.
Interestingly more then 50% failed prop challenges are because traders dont use a stop loss.
Now your stop loss should always be adjusted to the market structure. Not always same lot size
Obviously some short-term scalping can be done with the fixed SL and TP distance. But most of strategies needs to adjust SL to the current structure. And here come the problem. Many traders use still same lot size even when the stop loss distance is different and thats the problem.
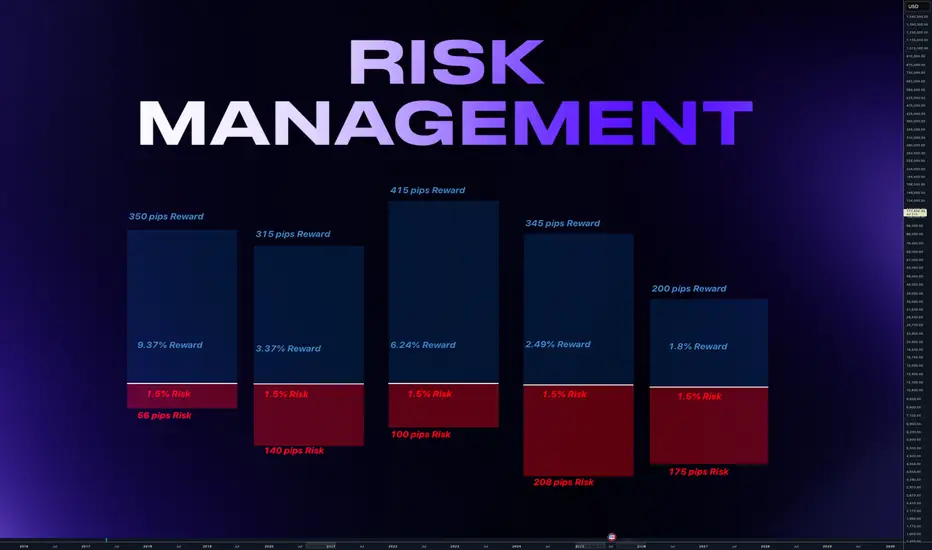
Let me just show you on 2 examples of series of trades.
We count with 5 identical trade setups
Let's assume we had 5 trades 1 winner and 4 losses.
📌 1) Using always same position size on 10K account
- Outcome of trades is various
- 1 win with fixed lot was small. Instead of fixed lot we could use higher lot size as the SL distance was small. This trade didnt covered other losses.
- Losses of other trades are various
- psychological affect - uncertainty increasing fear of loss
- total result after is -273 pips
- minus 2.7% and - $273
📌 2) Calculated risk 1.5% for each trade
- we risk 1.5% for each trade by adjusting lot size
- You always know how much you loose if you loose.
- You can maximize profits on high RR trades.
- Every trade will have same % value in your series of trades. This makes your statistics working
- first trade has made huge profit - other 4 losses were 1.5% each
- first trade covered losses and even made gains
- we again ended in minus 273 pips
BUT +$337 IN MONEY / AND + 3.37% PROFIT
📌 Final Conclusion
Although we modeled 5 completely same trading setups in first example we ended up loosing in pips and money. While in the second example with the completely identical setups we ended in profit and more stability of on our account but also with psychological preservation.
And this is power of risk management and it has much bigger impact especially to our trading psychology which is 80% of success.
🧠 Psychological Importance of Risk Management:
🧪 Reduces emotional pressure
When your capital is protected, you stop making desperate, fear-based decisions.
🧪 Builds confidence in your strategy
Knowing you’re safe even if a trade fails allows you to focus on execution, not outcome.
🧪 Eliminates fear of losing
Small, controlled losses become part of the process — not something to avoid or fear.
🧪Improves consistency and discipline
Following rules forces you to act like a professional, not a gambler.
🧪 Prevents burnout and mental fatigue
Managing risk = managing stress. Overexposure to loss drains your mental capital, not just your account.
📌 Final tip
There is no strategy on the world which is only winning. Losses are normal. Same like restaurant owner has a cost with rent and salaries for employees. We as a trader has cost of the doing the business in losses. You cant avoid them.
One loss out of 4 trades is nothing. But what if you get in to a loosing streak like me in the may? How did I survive?
Many people would start doubting the strategy , doing the changes, switching to trading different markets etc.. But NO, if you know your statistical data and stick with the your risk management it will keeps you going. You know that even 75% win rate doesnt guarantee that you cant get in to a loosing streak.
75% winning ratio means that out of 100 trades you will win 75. But still there is 25 looters. And you never know what would be distribution of wins and losses. So you keep going and its only possible if you calculate risk per trade and know how much is your max loss per trade not by using same lot size for random stop loss distance.
“Adapt what is useful. Reject whats useless and add whats is specifically yours.”
David Perk aka Dave FX Hunter