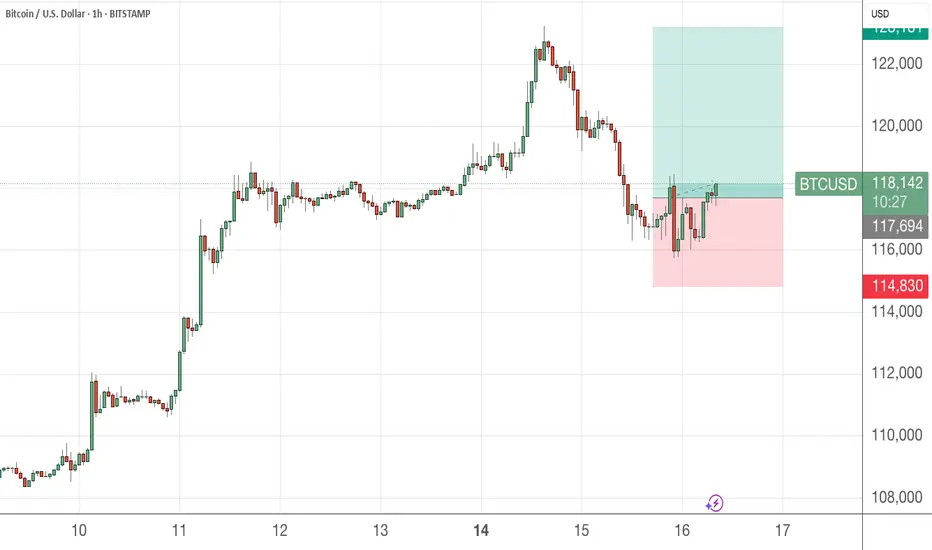
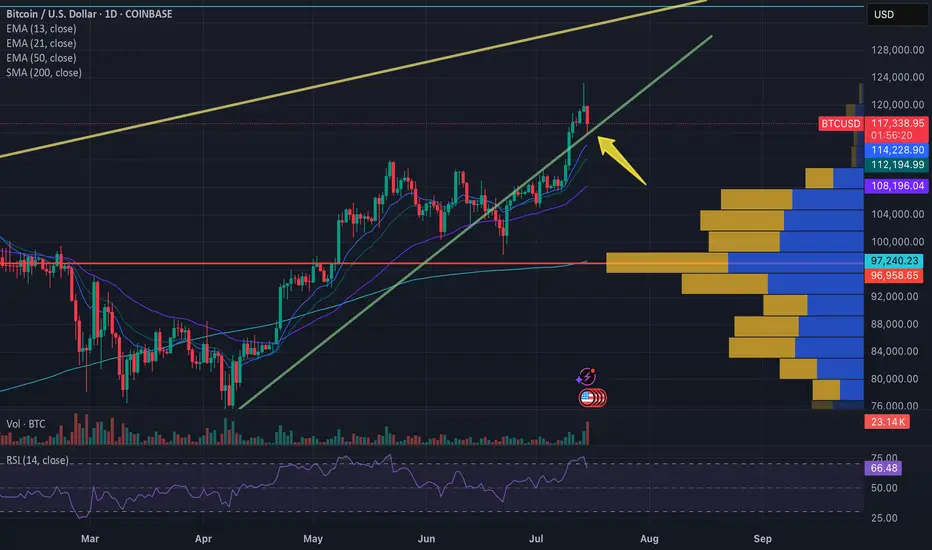
Adding a bit more to BTCUSDPlease see day and 1H chart , all bullish
This digital asset whether you believe it is productive and generates cash flow or not, please put 1-3% of your capital to it. Buy and keep long term , avoid trading unless you like volatility.
BTCUSD trade ideas
Bitcoin Backtest and continuation to $135000See trendline and respecting the support, looking for continuation up this week
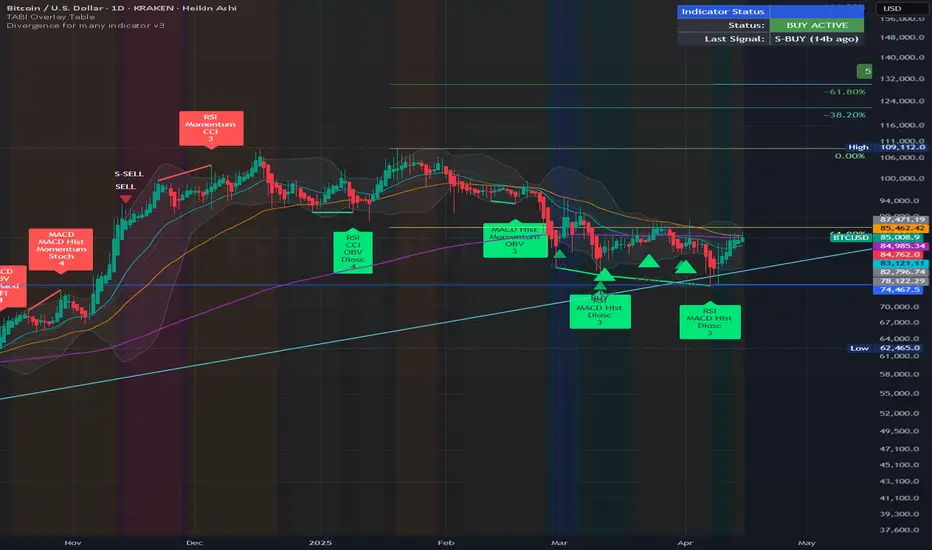
BTC – Strong Buy Signals, Sentiment Reversing, Final Push?BTC is clearly in a place of rising trust
- Fear & Greed Index improving: last week 24 (Extreme Fear), yesterday 31, now 38 (Fear), last month low was 3
- Several bullish divergences visible: RSI and MACD show higher lows vs. price, momentum indicators curling up, OBV ticking higher despite weak price action
- Price is sitting at the lower Bollinger Band and holding an ascending trendline
- Multi-indicator (mostly RSI-based) showing clustered buy signals, similar to previous rallies
- Simple Fibonacci retracement from the recent high (~73K) shows potential move toward 130K, assuming continuation and break above ~109K
- Last S-BUY signal was 14 bars ago, still active
- Structure is clean and holding
- If this is the final leg up, we could be entering danger or euphoria territory soon
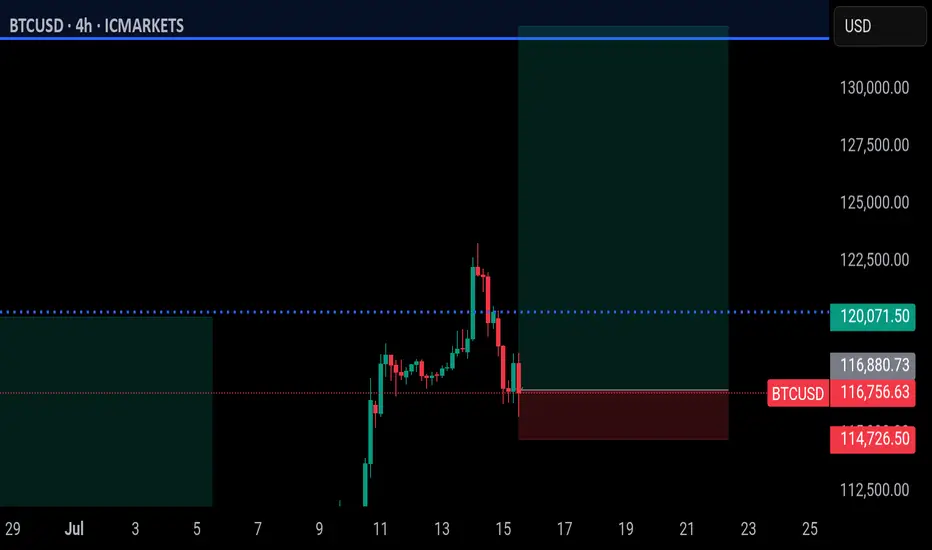
Potential 4hr SwingCurrently looking for clear confluence this week before BTC returns to 120k. Projected Consolidation and Accumulation for 7/16 and 7/17 and looking for a break above around 118k-119k. To load up before the next project hi (key lvl)
BTC Heading DownThis is my first chart using TradingView. I'm 50/50 on how I feel about it's utility, but it does well enough until I learn it better. I use the D Timeframe too look for support/resistance. I focus in on the 4h, then 1h further. I have recently switched from lower timeframes to higher timeframes with some surprising success following my rules. Constructive Criticism/Dialogue welcomed.
It is time for a reversal. Why? Those ATHs were just hit after two bullish runs for 2025 (Jan and July). Granted it would be hopeful for all investors to keep seeing this beast rip for a 3rd time in 2025, that is a dream, I think. There has been two runs then consolidation/pullbacks, NORMALLY (see hollow boxes on chart). This does not mean this is the case, but this is what I am going with after researching. After the ATH, a lovely wick and an incredibly high volume on an engulfing candle formed. This along with a PSAR switch on the 4H is what I utilize. I have only researched down to $102k. Each TP (blue line), I will be looking for a sign of reversal on the 4h.
Key:
Blue lines:
- My TP
Boxes:
- Areas of Interest
Hollow Boxes only:
- Shows two runs before a consolidation to an official breakout
Highlights:
- What within that area of interest I'm using for justification
Orange lines:
- Where in the past BTC has had breakouts then a retest before the next breakout
Red line:
- My SL
Enjoy your BTC,
AtlasRising
Bitcoin breaking out - 150k likely, possibly soon- complimentary analysis to the USDT D. one since they trade opposite of each other:
- 5D volatility is extremely low
- 150k is a mid-term target, it is likely Bitcoin reaches +200k before this bull market cycle is over
BTC SHORT FOR NOW?An all time high was achieved recently at around 123k USD. A number of buyers should potentially be liquidating their profits around this region, reducing buy pressure and ultimately leading to a short term pull back maybe close to around the 110's? Price action will have to reveal more information in order to see what happens after this movement.
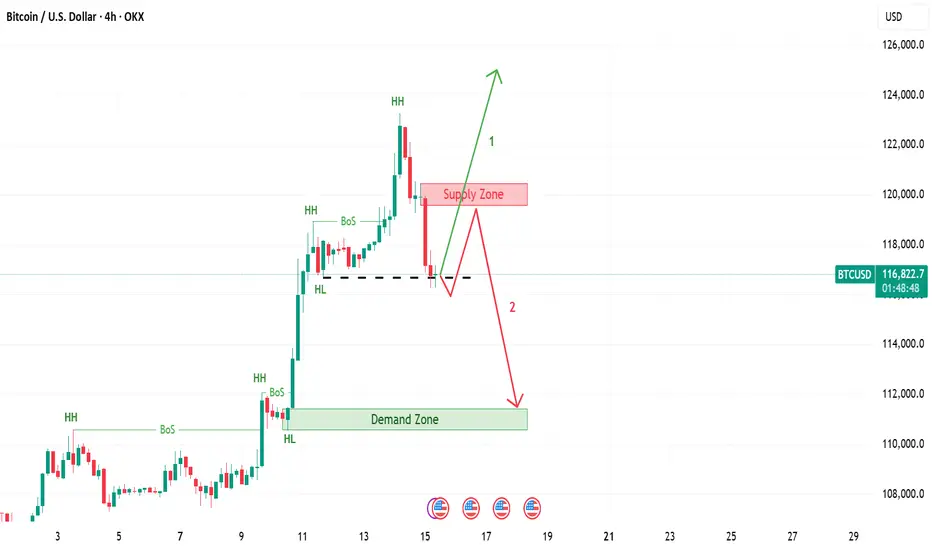
Bitcoin | 2 Scenarios If the 4 hour candle closes below last HL, then expect price return to supply zone and then go down till demand zone. If not, expect continuation of the upward trend, when 4 hour candle breaks last HH.
Which scenario you expect?
Final BTC target still remain above 130kBTC still has some push to do to reach my final target, 130k - 145k region. If you look at my BTC chart from January, that region has been highlighted. Till then, I'm still bullish. Now DXY is trying to turn bullish too, which will mean bearish BTC but it is that is s lagging indicator. It won't happen immediately, maybe next 2 or 3 months. Be prepared, for now, we still go up. Enjoyyy
Follow me as my trades are market order so you'll see the trades on time anand enter on time
BTC - Capitulation. Now Time For A Bounce?Whenever there is a big impulsive rally, dumb money will come rushing in to buy.
And thus we can somewhat expect the market maker to print a shakeout for them to exit at best price and dumb money to carry the bags at worst price.
...
In this area we have multiple charts providing the liquidity zones for the shakeouts:
The upside shakeout (long wick) printed on TOTAL through ATH:
...
Before I make the next point, lets see the design of the chart bots 10 years ago in 2015.
Notice that the high and low of the trading range is set by the impulsive high then initial slump:
That sets the trading range.
Once set; the chart bots then print a liquidity sweeping slightly higher high...
Which slumps back to liquidity sweep the lows of the trading range.
From there the next wave up begins.
...
Now notice in these charts from the last 2 days, that the trading range was similar to that of 2015.
But once the range was set; rather than printing a simple slightly higher high, the more evolved chart bots printed a wild impulsive move up to draw in buyers.
This then became a very impulsive smackdown.
...
Although going on a wild journey, the price is effectively similar to the pattern of 2015; liquidity sweep at the highs and now it is below the low.
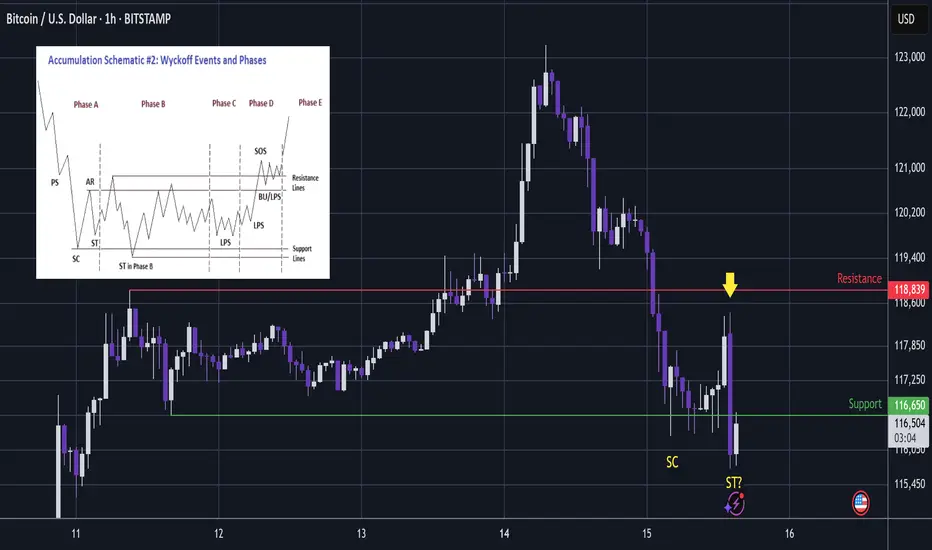
Notice on these 2 charts from the last two days that the support that Bitcoin has hit today was the obvious trading range low - similar to 2015.
And so the question is now; whether it will also be a liquidity sweep at the lows and a bounce will follow?
Notice on the chart, there was a big smackdown and then we have had another fast smackdown (arrow) to take price beneath the lows.
This looks very much like a fear test - where the chart bots try to sell you another immediate capitulation, but yet the price holds in the zone of higher liquidity below support.
Wyckoff would call these 2 lows SC Selling CLimax and ST Secondary Test.
The selling climax completes the real bearish wave down.
Secondary Test is the probe into higher liquidity which is a fear test to scare longs away.
...
So if we consider that history may not repeat, but it does rhyme then there will likely be a bounce in this area - as the market maker gets best price for their short positions while dumb money panic sell their long positions at a loss.
Not advice
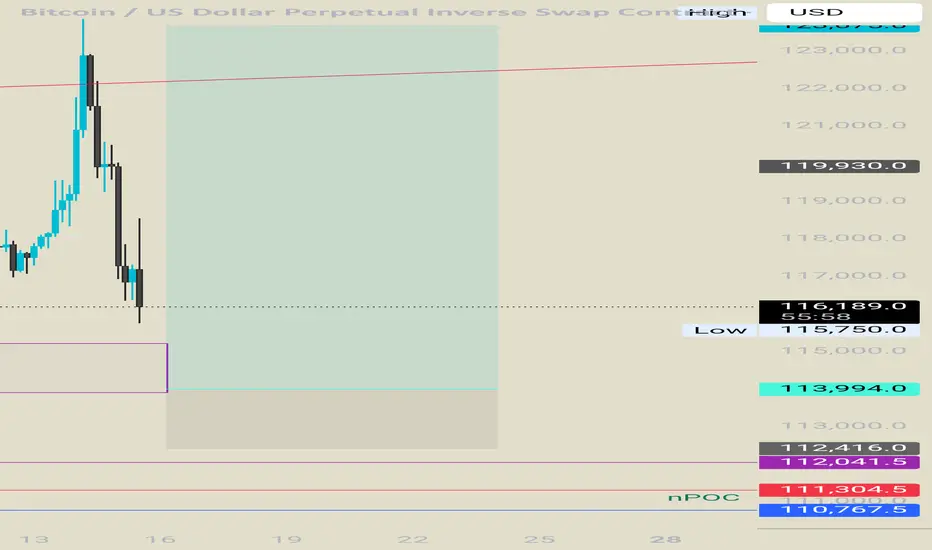
Bitcoin long from 114kWaiting for cme gap to close at that region.
We also have a fvg . Looking for longs.
Continuation higher is a must.
BTC/USD Today: Momentum Builds Toward the Next BreakoutBITSTAMP:BTCUSD Today: Momentum Builds Toward the Next Breakout
Previously on BTC...
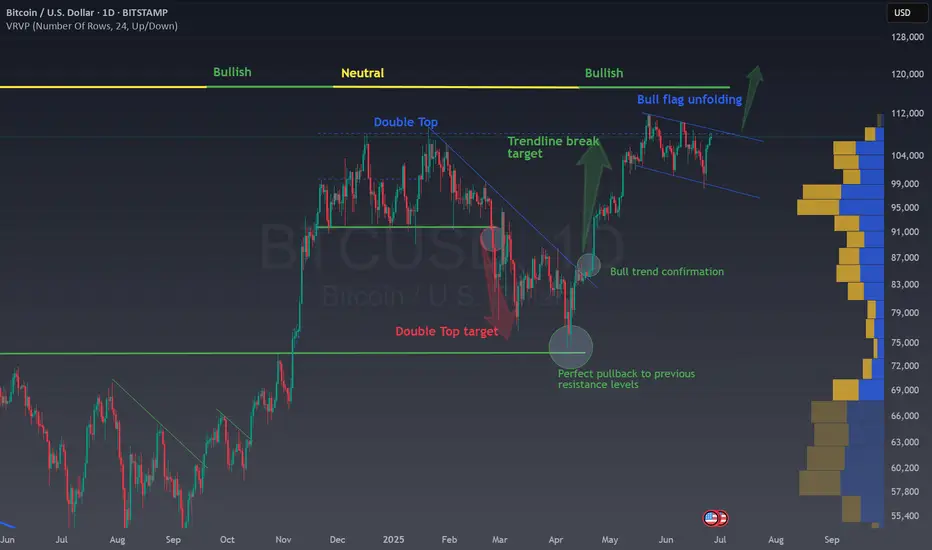
1. Double Top Pattern and Target Hit
The chart shows a classic double top (early 2025), a bearish reversal pattern. Once the neckline broke, the price plunged and nailed the technical target (red arrow)—as if Bitcoin had read the textbook.
2. Trendline Break = Game Changer
After bottoming out, BTC broke through a downward sloping trendline, triggering a strong bullish move. This breakout signaled a trend reversal, and the market responded accordingly.
3. Perfect Pullback
Once the breakout played out, the price retraced back to previous resistance, now turned support. This “perfect pullback” is the kind of thing that makes technical analysts smile in their sleep.
4. Bull Trend Confirmation
The successful retest of support confirmed that Bitcoin had shifted from neutral/bearish into a full-on bull trend. Buyers stepped back in with confidence.
📊 BTC/USD – Current Outlook
Bull Flag Forming
Currently, price action is consolidating into a bull flag, a continuation pattern often seen mid-rally. If it breaks out to the upside, the projected target sits near $120,000 .
🚀 Bullish Catalysts:
- Strong structural trend: Higher highs and higher lows are still intact.
- Post-halving momentum: Historically, Bitcoin tends to go beast mode 6–12 months after each halving—and we’re right in that sweet spot.
- ETF inflows : Institutional capital continues pouring into Bitcoin ETFs, adding steady buying pressure.
- Supply crunch: With more BTC leaving exchanges, sell-side liquidity is drying up. Hodlers are hodling.
- Technical setup: A confirmed breakout from the bull flag could trigger a powerful leg higher.
⚠️ Risks and Levels to Watch:
A breakdown of the bull flag could send BTC back toward the $98k–91k range.
Macro headwinds (rate hikes, economic slowdown, dollar strength) could still rain on crypto’s parade.
🧠 Conclusion
This chart paints a textbook bullish setup for Bitcoin. The double top is in the rearview mirror, the trendline breakout gave us the green light, and now the bull flag is loading the next move.
If the breakout happens, the next destination could be $120,000.
It’s one of those “don’t blink” moments—BTC might just be stretching before its next sprint.
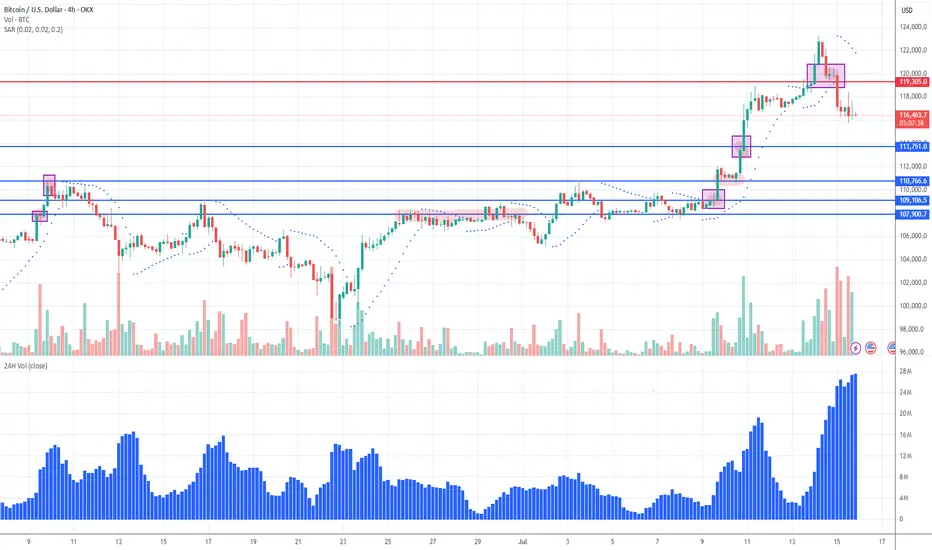
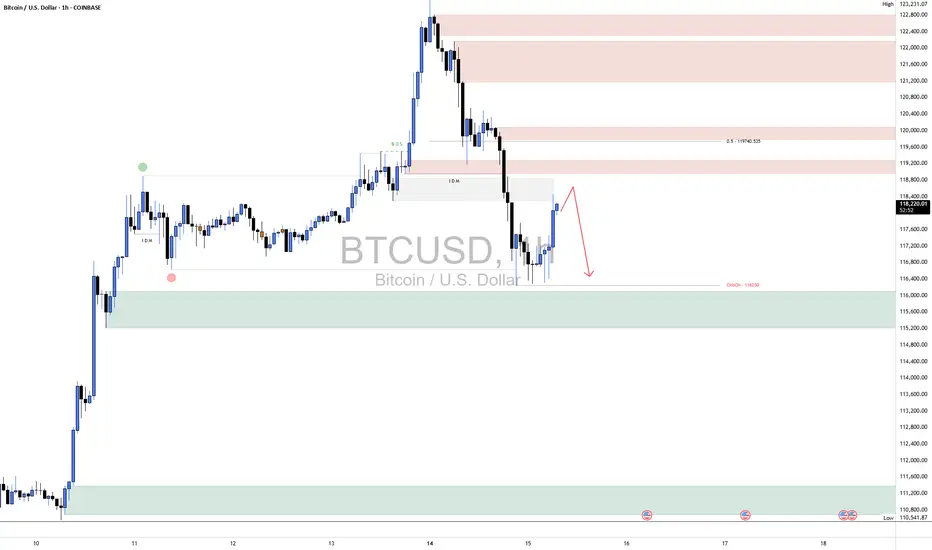
BTC ShortBTC has shown some short-term bullish signs, with a corrective bounce from the demand zone around 116,000–115,000, indicating a temporary reaction from buyers. However, this move appears to be a retracement rather than a full reversal, as the overall structure remains bearish.
Price is currently pushing into a previously broken intraday supply zone and approaching the 50% equilibrium level near 119,000, which aligns with a potential lower high forming. As long as BTC stays below this key level and fails to break market structure to the upside, the bias remains bearish.
We still believe BTC is likely to come back down to retest the recent lows, possibly revisiting the 116,000 zone to sweep more liquidity before any meaningful reversal can occur.
As always, proper risk management is essential. Wait for confirmation before entering trades and protect your capital in these volatile conditions.
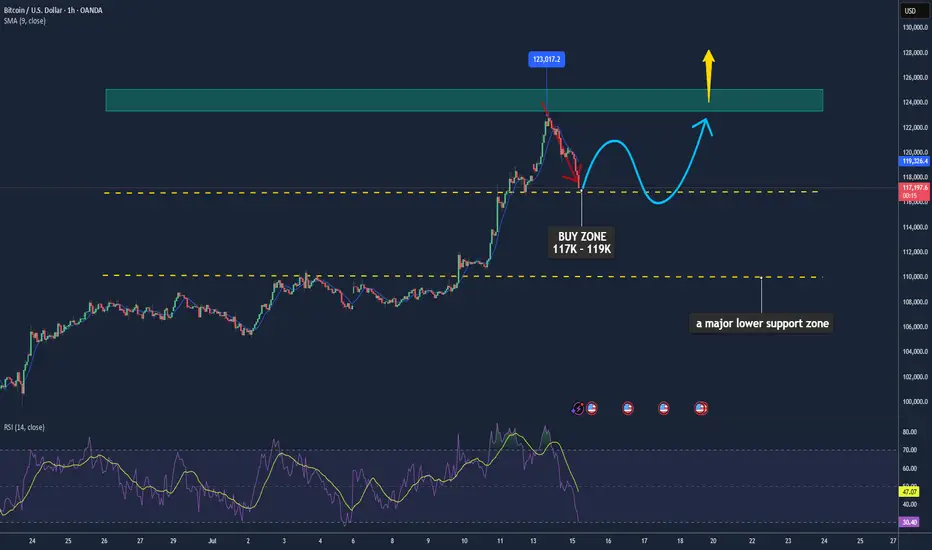
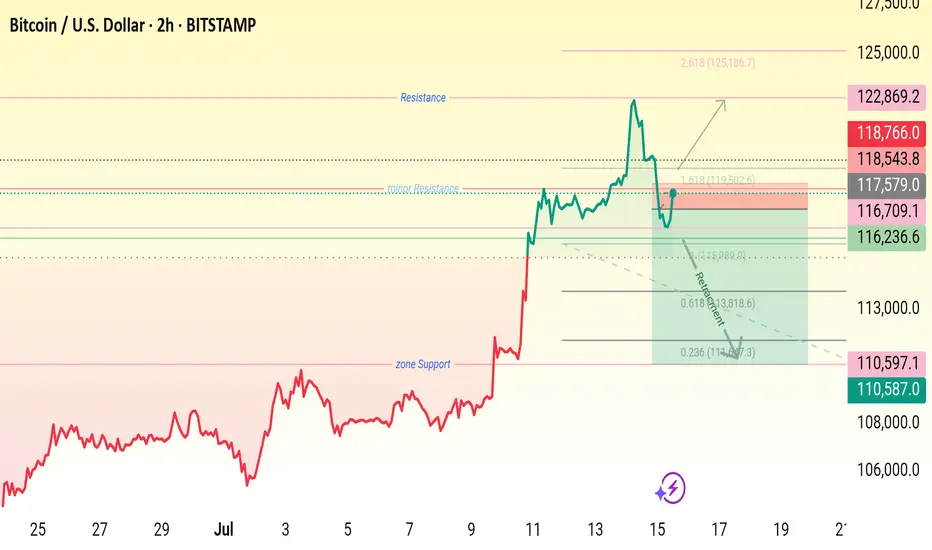
Bitcoin May Pause After Recent Highs📊 Market Move:
Bitcoin (BTC) recently touched an intraday high of ~$122.8K after hitting new all-time highs, supported by a weaker USD, strong institutional inflows, and favorable U.S. regulatory developments (e.g., GENIUS Stablecoin Act, CLARITY Act, and Trump’s executive orders). However, rising volatility (DVOL) and a rebounding USD are signaling a possible short-term correction.
📉 Technical Analysis:
• Key Resistance: ~$123K–$125K
• Nearest Support: ~$117K (with $110K as a major lower support zone)
• EMA: Price is currently above the 9-day EMA → short-term trend remains bullish.
• Candlestick / Volume / Momentum:
• A cup-and-handle formation has emerged, typically a bullish continuation pattern, suggesting a possible 14% rally to ~$134.5K.
• Momentum is still strong; RSI is elevated but not yet overbought (14-day stochastic RSI at ~79.4%).
📌 Outlook:
Bitcoin may consolidate or experience a mild pullback in the short term around the $123K level, especially if the USD continues to strengthen or volatility spikes. However, a clean breakout above $125K could trigger a further rally toward the $134K–$146K range.
💡 Suggested Trading Strategy: (Spot only – no leverage)
🔻 SELL Bitcoin/USD at: $123K–125K
🎯 TP: $117K
❌ SL: $126.5K
🔺 BUY Bitcoin/USD at: $117K–119K
🎯 TP: $123K–125K
❌ SL: $115K
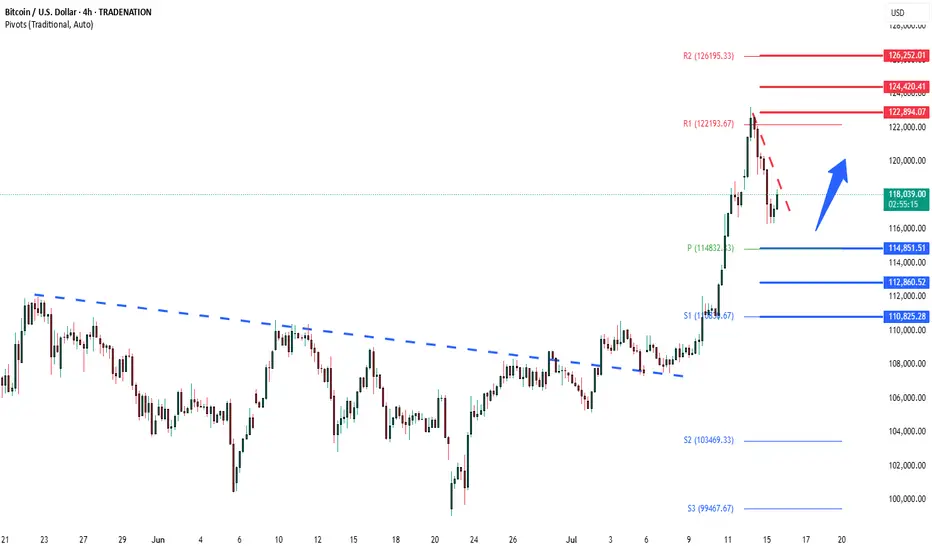
BTCUSD overbought correction supported at 114,850The BTCUSD remains in a bullish trend, with recent price action showing signs of a corrective pullback within the broader uptrend.
Support Zone: 114,850 – a key level from previous consolidation. Price is currently testing or approaching this level.
A bullish rebound from 114,850 would confirm ongoing upside momentum, with potential targets at:
122,900 – initial resistance
124,420 – psychological and structural level
126,250 – extended resistance on the longer-term chart
Bearish Scenario:
A confirmed break and daily close below 114,850 would weaken the bullish outlook and suggest deeper downside risk toward:
112,860 – minor support
110,825 – stronger support and potential demand zone
Outlook:
Bullish bias remains intact while the BTCUSD holds above 114,850. A sustained break below this level could shift momentum to the downside in the short term.
This communication is for informational purposes only and should not be viewed as any form of recommendation as to a particular course of action or as investment advice. It is not intended as an offer or solicitation for the purchase or sale of any financial instrument or as an official confirmation of any transaction. Opinions, estimates and assumptions expressed herein are made as of the date of this communication and are subject to change without notice. This communication has been prepared based upon information, including market prices, data and other information, believed to be reliable; however, Trade Nation does not warrant its completeness or accuracy. All market prices and market data contained in or attached to this communication are indicative and subject to change without notice.
BTC: Buy idea: Bearish ChannelOn BTC we are in a bearish channel situation with a succession of numerous red candles. In such circumstances, we would have a high probability of seeing the market go up. This rise will be impressive if the resistance line is broken forcefully by a large green candle and followed by a large green volume. Good luck everyone!!!
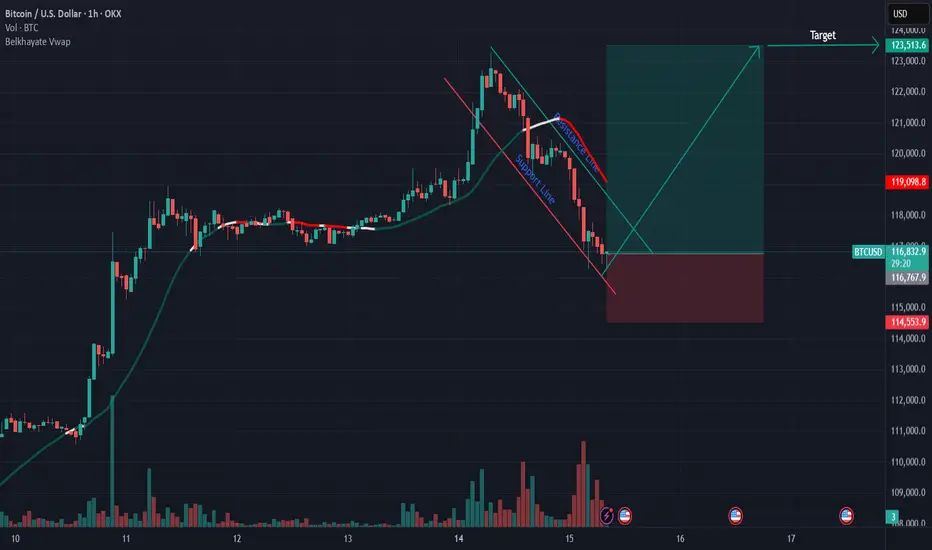
Btc key levels,
Wait for price rejection .
•Entry Zone: 115,900 – 116,700
• Stop Loss: Below 110,587
🎯 Target 1: 118,543
🎯 Target 2: 122,869
• Extension Target: 125,186 (1.618 Fib)
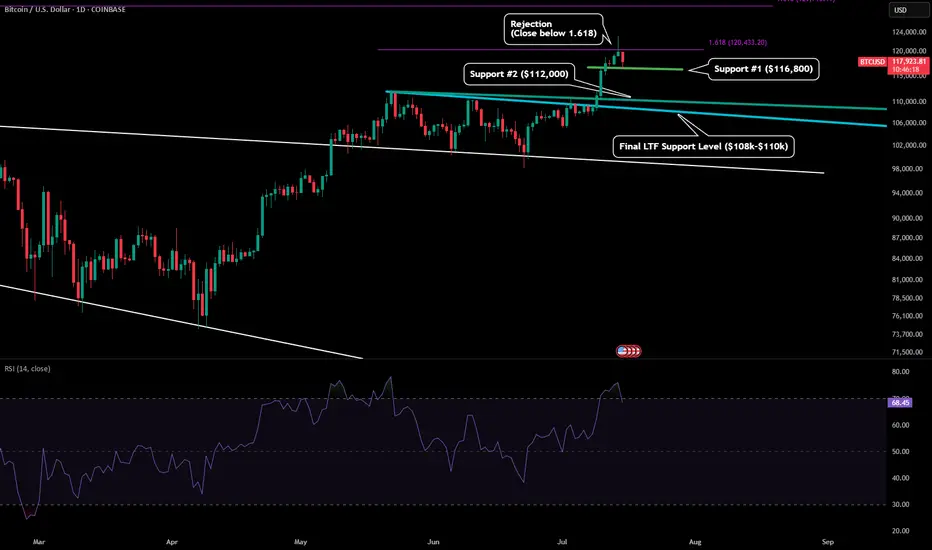
BTC - LTF Retracement TargetsPlease refer to our previous post:
After identifying our first target right around $120.4k we are seeing the first signs of a cooloff. Until we get a daily candle close above this level price is likely to flush some leverage. The main move to $140k area is still likely to happen, but if we see a retracement in the short term here are the LTF levels to watch.
Support level #1 has been established with most of the candle bodies around $116.8k. If we lose that level then price is likely to test our previous ATH.
Support level #2 would be a test of our previous ATH around $112k or our teal trendline that connects the wick tops.
The final support level would be our macro old ATH right around $108-$110k. There is also a trendline there (which depending on what time it could be tested) would also be right in line with those price targets.
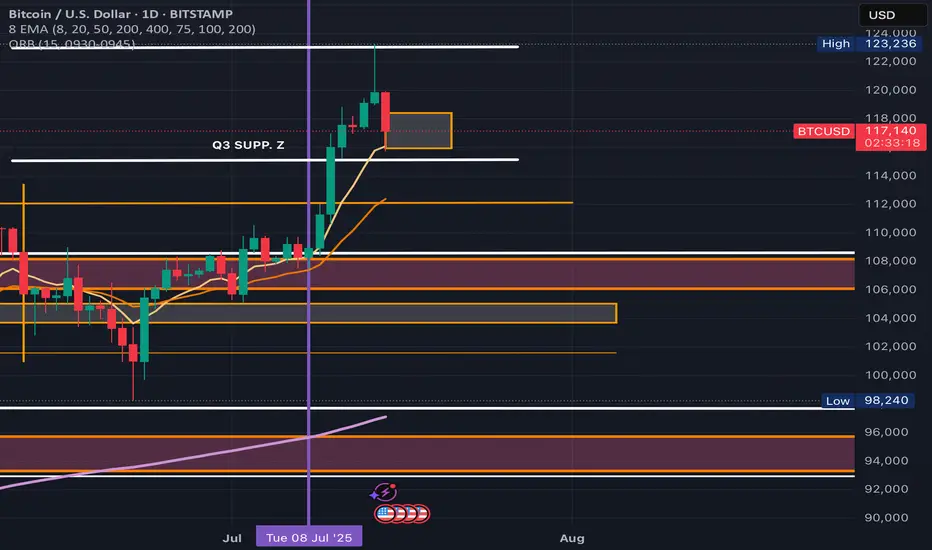
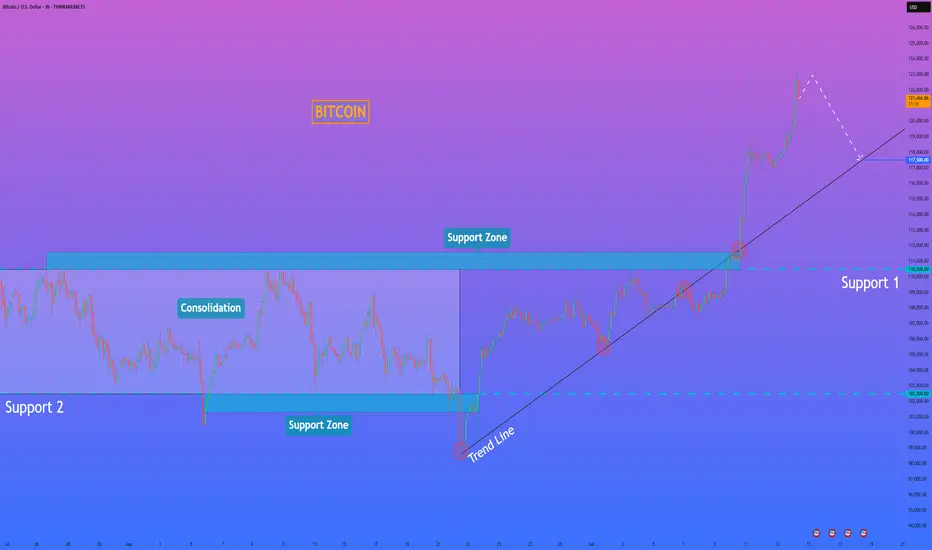
HelenP. I Bitcoin will go to a correction after a strong impulseHi folks today I'm prepared for you Bitcoin analytics. If we look at the chart, we can see that the price has recently made a powerful impulse upward, breaking out of a long consolidation range between 110500 and 102500. This range acted as a strong accumulation zone, where the price bounced multiple times from both support levels. After the breakout, Bitcoin gained momentum and pushed sharply toward the 122000 mark. Now, after this sharp rally, I believe a correction is highly probable. Often, after such strong bullish moves, the market tends to pull back to retest the trend line or previous breakout zones. In this case, the trend line has been respected several times and now aligns with the 117500 area, which also acts as local support. That’s why I consider this zone to be a logical target for the correction. I expect BTCUSD can drop from the current highs and retest the trend line near 117500 points - that is my main goal for this setup. If the trend line holds, buyers may return to the market and push price higher again. Given the strong impulse, the breakout from consolidation, and the importance of the trend line, I remain bearish short-term and expect a drop toward 117500 points. If you like my analytics you may support me with your like/comment ❤️
Disclaimer: As part of ThinkMarkets’ Influencer Program, I am sponsored to share and publish their charts in my analysis.
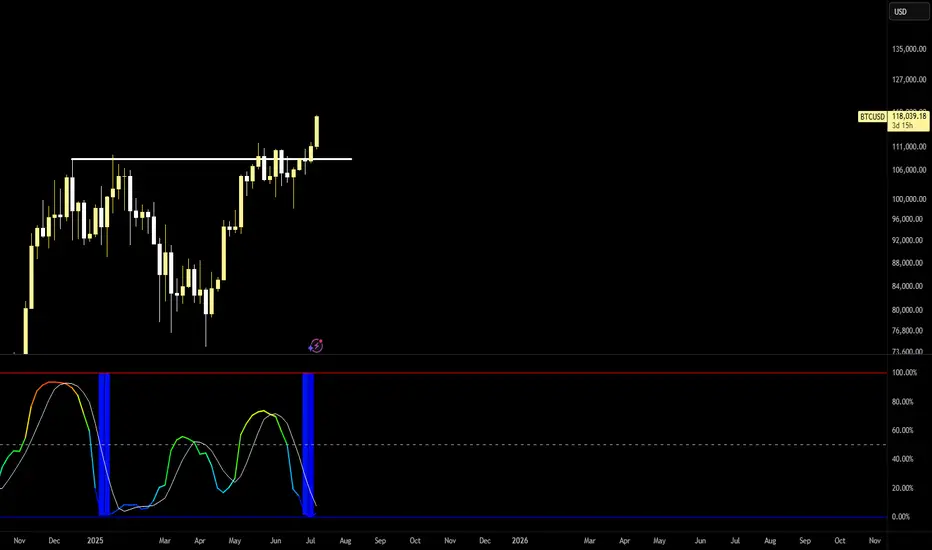
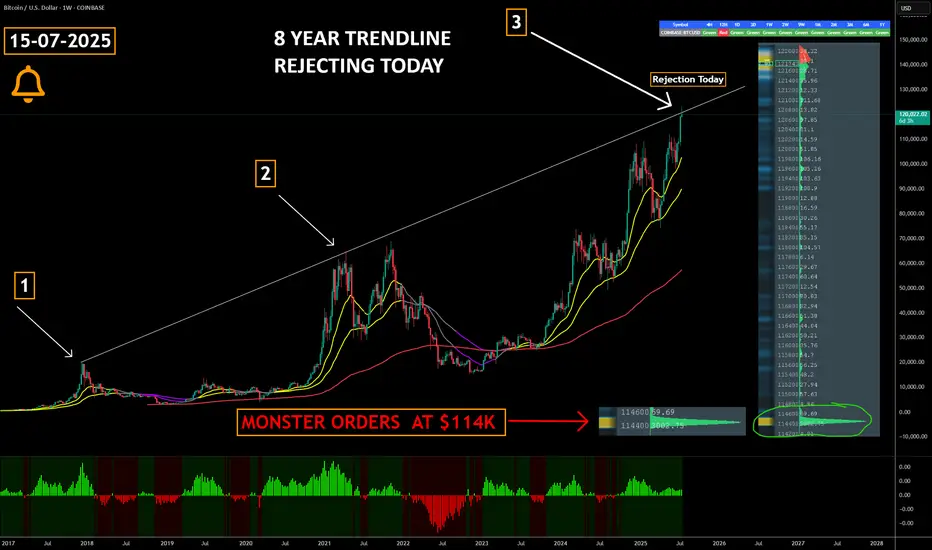
Did Bitcoin Just TOP OUT ??????
COINBASE:BTCUSD has just collided with an 8-year rising trendline that capped the market’s last two cyclical peaks—historically, this level has triggered multi-month corrections and Bear Markets.
Triple-test significance : a third touch of a long-term trendline ➜ heightened odds of a reaction; failure to break cleanly often confirms a major top.
Watch for confirmation signals —weekly bearish RSI divergence, waning volume, or rejection wicks can validate a reversal scenario.
Breakout = regime change : a decisive close and hold above the line flips it to support, opening the door to fresh price discovery and potential parabolic upside.
Large Orders at $114k create a visible demand wall in the order book, signalling that whales / institutions are ready to absorb a dip and accumulate at that level.
Risk-management alert : consider tightening stops, reducing leverage, or hedging until trendline fate is resolved.
The buy pressure has been relentless but this is always worth paying attention to
Marty Boots | 17-Year Trader — smash that , hit LIKE & SUBSCRIBE, and share your views in the comments below so we can make better trades & grow together!
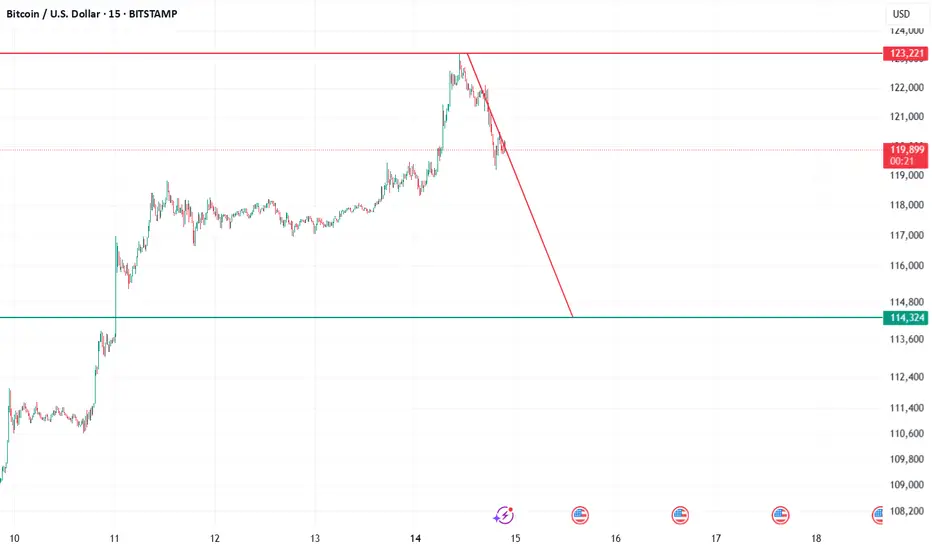
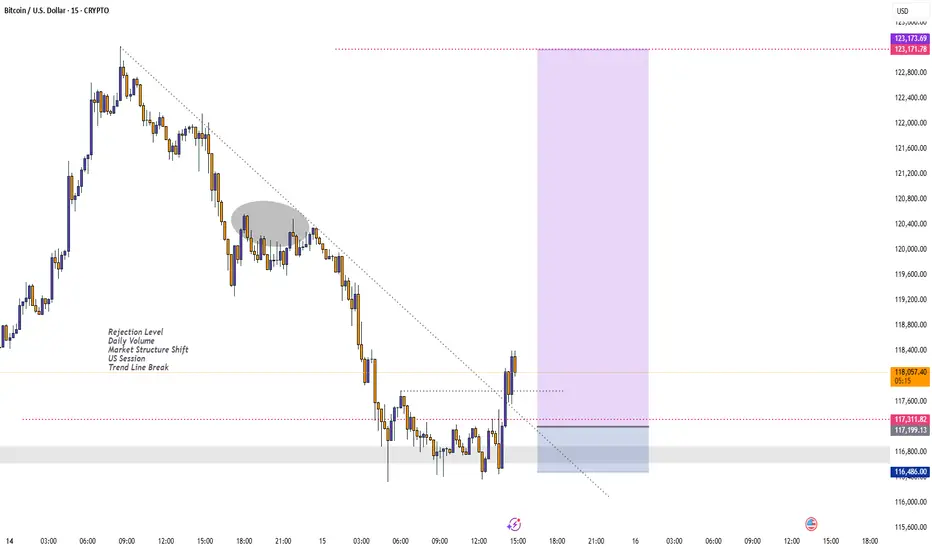
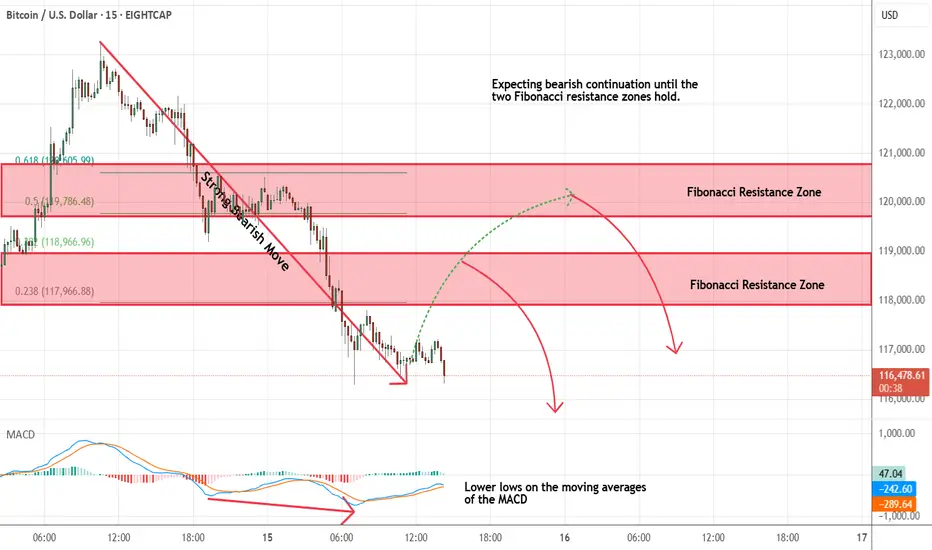
Bitcoin - Looking To Sell Pullbacks In The Short TermM15 - Strong bearish move.
Lower lows on the moving averages of the MACD.
No opposite signs.
Currently it looks like a pullback is happening.
Expecting bearish continuation until the two Fibonacci resistance zones hold.
If you enjoy this idea, don’t forget to LIKE 👍, FOLLOW ✅, SHARE 🙌, and COMMENT ✍! Drop your thoughts and charts below to keep the discussion going. Your support helps keep this content free and reach more people! 🚀
--------------------------------------------------------------------------------------------------------------------
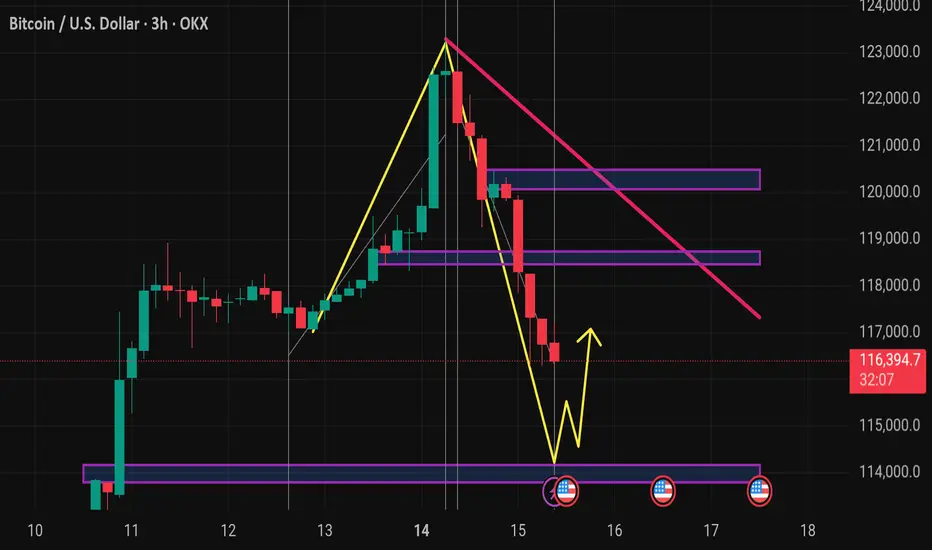
Btcusd techinical analysis.This chart displays the Bitcoin (BTC/USD) 3-hour price action with several technical indicators and patterns annotated. Here's a breakdown of what it shows:
Key Observations:
1. Price Action:
BTC is currently priced around $116,386, showing a -2.93% drop.
A strong downtrend has formed after a significant upward move, possibly forming a bearish ABCD pattern.
2. Harmonic Pattern:
The chart appears to reflect a completed harmonic retracement, with a deep retracement (near 0.88 Fibonacci level).
This suggests a potential reversal or bounce zone.
3. Support & Resistance Zones:
Several purple horizontal boxes indicate key support and resistance zones.
The current price is approaching a major support zone near $114,000–$115,000, which has been tested previously (visible on the left side).
4. Trend Lines:
A pink downward trend line suggests ongoing bearish momentum.
Price may need to break above this line to confirm a reversal.
5. Yellow Zig-Zag Path:
Indicates a possible bullish reversal scenario, predicting a bounce off the lower support zone followed by a move upward.
6. Event Markers:
Red circular icons (with flags) near the support zone hint at upcoming fundamental news/events that may influence price action.
---
Interpretation:
Short-term bias: Bearish until strong support holds (~$114,000–$115,000).
Possible trade setup: Watch for bullish reversal signals at support (candlestick patterns, RSI divergence, etc.) before entering long.
**Risk