ROS #Repeat of structureROS #Repeat of structure
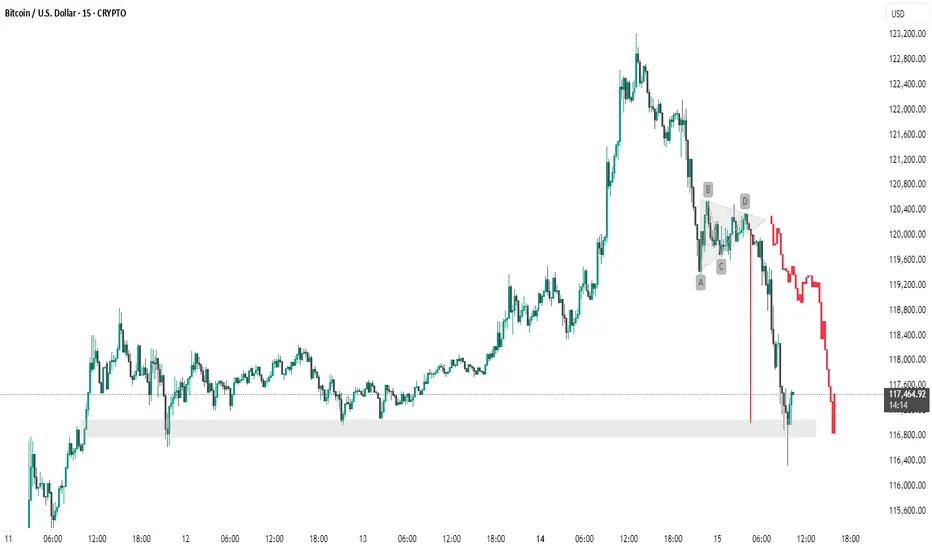
The chart you've provided is a 15-minute candlestick chart of **Bitcoin (BTC) / USD**, showing a recent price action pattern followed by a significant drop. Here are the **key points** identified on the chart:
**Key Support Zone**
* Highlighted in **light gray** at the bottom.
* Range: **\~116,800 to \~117,500 USD**
* This zone has acted as **support multiple times** (seen around July 11–12 and now again on July 15).
* Price **bounced** off this area during the most recent dip, but the current candle is testing it again.
---
**Chart Pattern: Bearish Triangle (ABCD Structure)**
Marked by the labels **A, B, C, D**, forming a **descending triangle**, typically a **bearish continuation pattern**:
* **A to B:** Sharp drop (initial leg down).
* **B to C:** Rebound, but fails to reclaim highs.
* **C to D:** Tightening price action inside the triangle.
* After **D**, there’s a **breakdown**, leading to heavy selling.
---
**Breakdown and Sharp Decline**
* Price **breaks below the triangle support** with a long red candle.
* Massive sell-off continues, pushing BTC below **\$118,000**.
* The current price is around **\$117,481**, hovering near the key support zone.
---
**Trend Observation**
* Before the triangle, there was a **strong uptrend** leading up to \~\$123,000.
* The triangle acted as a **distribution zone** before the **reversal** began.
* The trend has shifted from **bullish** to **bearish** post-pattern.
---
🔍 Summary of Key Levels:
| Level Type | Price Range |
| ---------------- | ------------------- |
| Resistance (Top) | \~\$123,000 |
| Breakdown Point | \~\$120,400 |
| Support Zone | \~\$116,800–117,500 |
thanking u
BTCUSD trade ideas
BTC: Swimming with sharks!BTC: Swimming with sharks!
.
Wait for a shakeout, and join the plan.
The target is still up ahead!
.
US STOCKS- WALL STREET DREAM- LET'S THE MARKET SPEAK!
BTCUSD🚨 BITCOIN IS ABOUT TO TAKE OFF AGAIN – DON’T MISS IT! 🚀
We’re seeing a healthy pullback in play – exactly the kind of mean reversion smart money watches for. BTC is currently retracing to test the standard deviation from the 200 EMA on the 30-minute chart ⏱️📉
🔍 There are two key demand zones setting up as high-probability buy areas:
1️⃣ Zone 1 – First reaction level: ideal for aggressive entries if momentum picks up.
2️⃣ Zone 2 – Deeper support: strong confluence with fibs + previous liquidity sweep. A goldmine for patient bulls. 💰
This isn’t just another dip – it’s a technical setup with potential for explosive upside. 📊
Stay sharp. Stay ready. BTC doesn’t wait. ⚡
#Bitcoin #BTC #CryptoTrading #BuyTheDip #EMA200 #TechnicalAnalysis #CryptoAlerts 🔥
Analysis of the possibility of a high point before a pullbackAnalysis of the possibility of a high point before a pullback
The upper boundary pressure of the local rising range, the whole rising callback is half broken through the rising range and continued to fall, the overall sideways trend
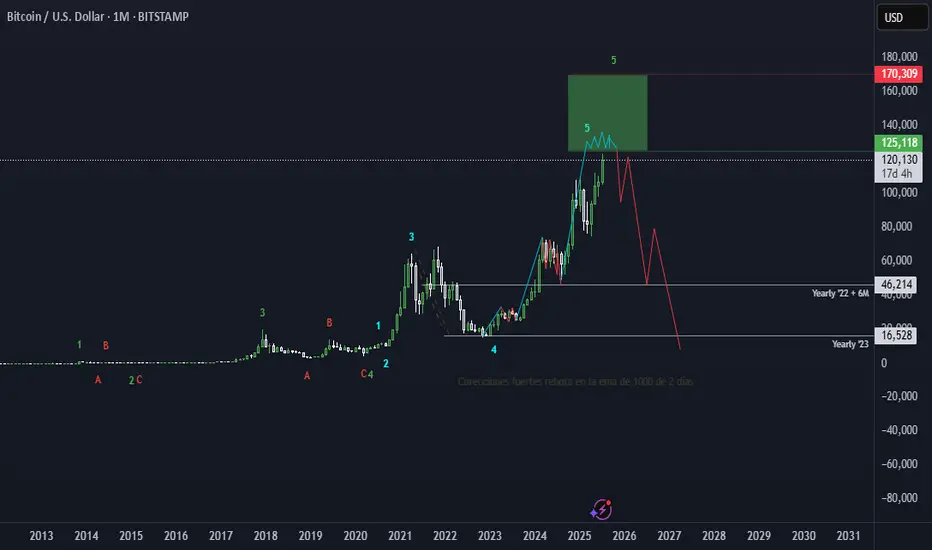
Bitcoin still a long: Target remains at $124,632This is an update to the wave counts for Bitcoin. We are in the final wave 5 of 5 of 3 and the target remains at around $124,632.
The stop can be adjusted to around $120,433, below the wave 2 of 5 of 3.

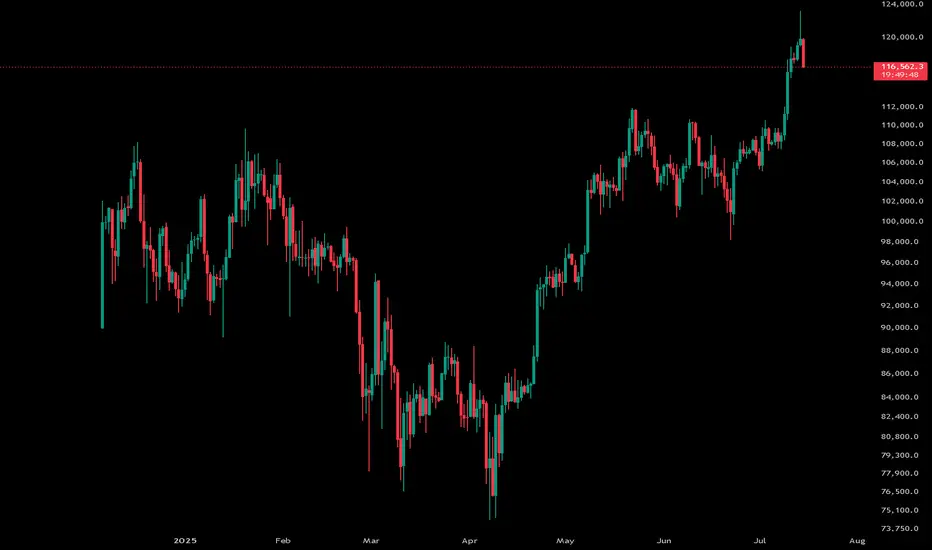
Bitcoin Cycle PredictionThis "Bitcoin Cycle Prediction" chart utilizes a long-term logarithmic view of BTC/USD price action on a weekly timeframe (1W) via Kraken exchange data, highlighting the cyclical nature of Bitcoin's market behavior across past, present, and projected future cycles.
Key features include:
Parabolic Growth Curves: Three completed macro cycles and a fourth projected cycle are visualized with rounded cup-like formations, indicating historical accumulation phases followed by exponential bull runs.
Fibonacci Retracement & Extension Levels: Each major bull run is annotated with Fibonacci retracement and extension zones, helping identify historical resistance and support levels, as well as potential future price targets. Extensions like 1.618, 2.618, and 3.0 are used to forecast upper bounds.
RSI (Relative Strength Index) : Positioned at the bottom, the RSI gives insight into historical overbought and oversold conditions, aligning well with the cycle peaks and troughs.
MACD (Moving Average Convergence Divergence): MACD crossovers and histogram movements reinforce the timing of bullish and bearish phases within each cycle.
Cycle Timing Marker: The vertical green line marks a projected inflection point around January 2026, suggesting the anticipated peak of the next bull cycle based on previous timing patterns.
Price Targets: Based on previous Fibonacci multiples, projected price targets for the upcoming cycle could reach extensions between $195,000 and $665,000+, if historical behavior repeats.
This chart is a speculative but historically informed visualization designed for educational and analytical purposes, offering long-term investors and cycle theorists a structured look at Bitcoin's repeating macro trends.
Divergence on all 3 RSI VOLUME AND TTMWe might have a large pullback if the weekly closes below the 1.272 Fib and there's a divergence on RSI VOLUME AND TTM I'm saying might nothing is 100% good luck to everyone I hope we all eat good
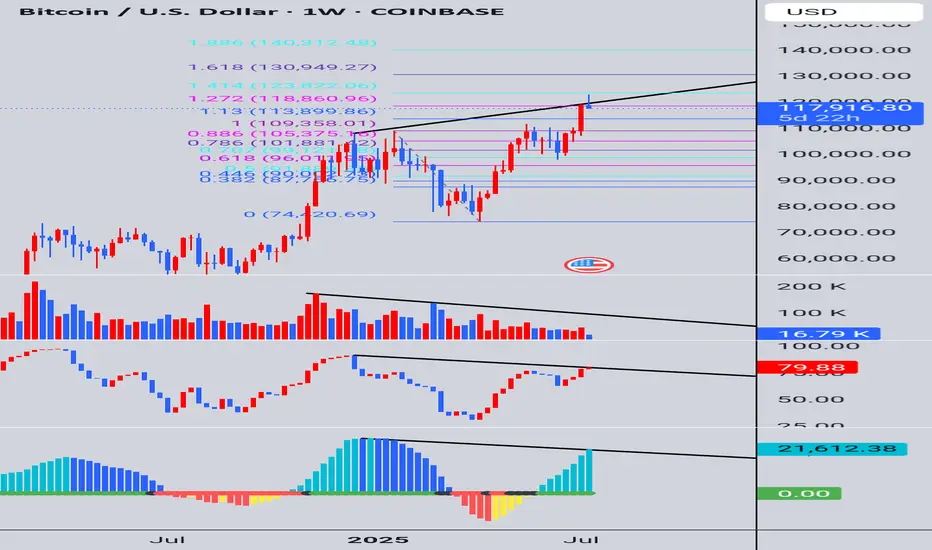
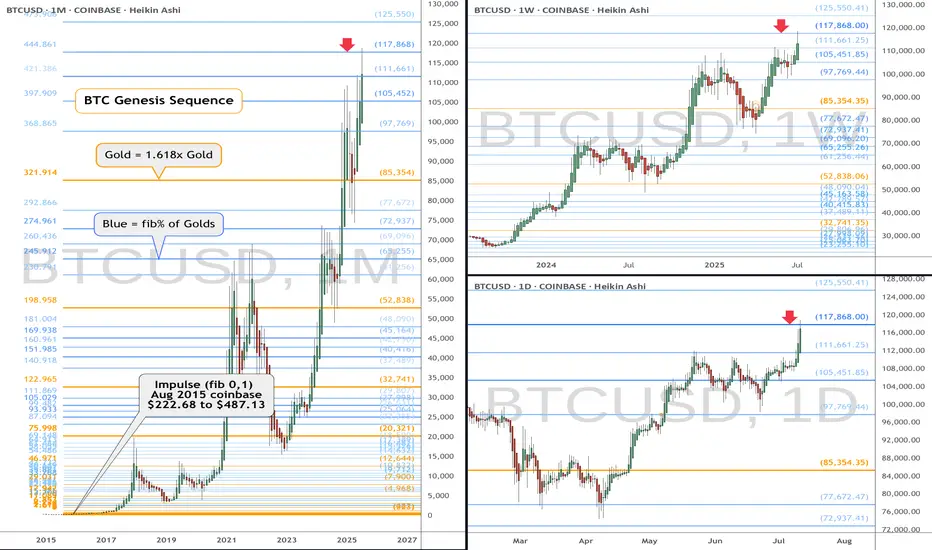
BTC eyes on $117,868: SemiMajor Genesis fib to Orbit a few times\Shown here is a single fib series in three different time-frames.
The "Genesis Sequence" has called all major turns since 2015.
This are "High Gravity" Fibs try to capture price into Orbit.
$ 117,668.00 (Coinbase) is the exact level of interest.
$ 111,661.25 is the first support below, a minor ratio.
$ 105,451.85 is semi-major and MUST hold fib below.
$ 125,550.41 is the next target above, a minor ratio.
See "Related Publications" for many PRECISE and TIMELY charts -------->>>>>>>
.
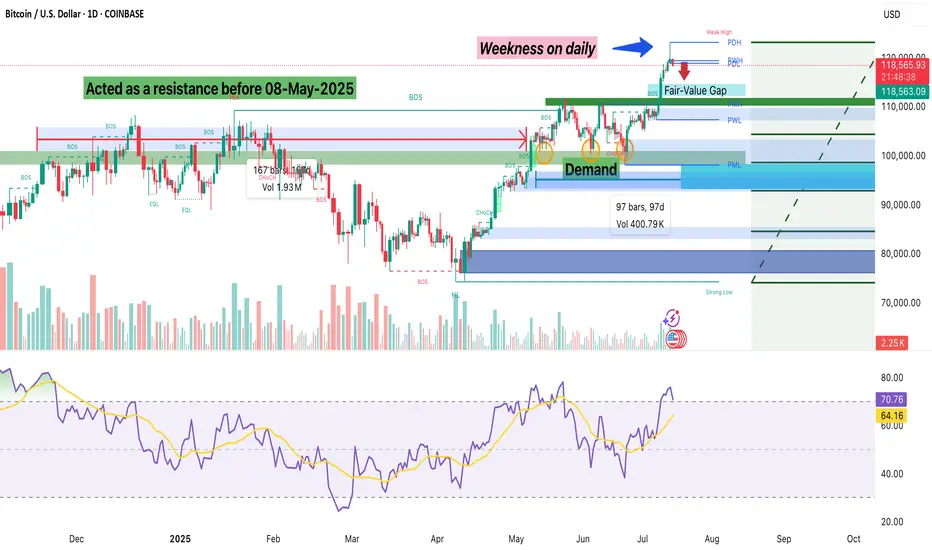
Signs of Weekness: Is Bitcoin Losing Momentum?Last week, Bitcoin made a new all-time high and gave bulls some serious profits. Price action has been looking solid and strong ever since it broke above the psychological and technical level of $110,000. But now, we’re starting to see signs that the market might need a healthy retracement.
On the daily chart, there’s a clear long wick at the top, which is a sign that buyers may be losing momentum up here. There’s also a Fair Value Gap (FVG) between roughly $115,200 and $112,200. In most cases, price tends to revisit these imbalances, so I wouldn’t be surprised if we dip back into that zone. I’m watching the midpoint around $113,700 because that could be a key level for a bounce if the bulls want to keep control.
If that zone fails to hold or we see a clean breakdown without much of a reaction, there’s a chance we revisit the $110,000 breakout level. From a Fibonacci standpoint, the 0.382 retracement of the recent move from around $98K to $120K also lands near $111.6K, which adds some confluence to that area.
Overall, I still think the trend is strong, but after this daily candle, I think that a 5–7% pullback wouldn’t be unusual or unhealthy. What are your thoughts? Are we just cooling off before another breakout, or is a deeper retracement on the table? Comments and suggestions?
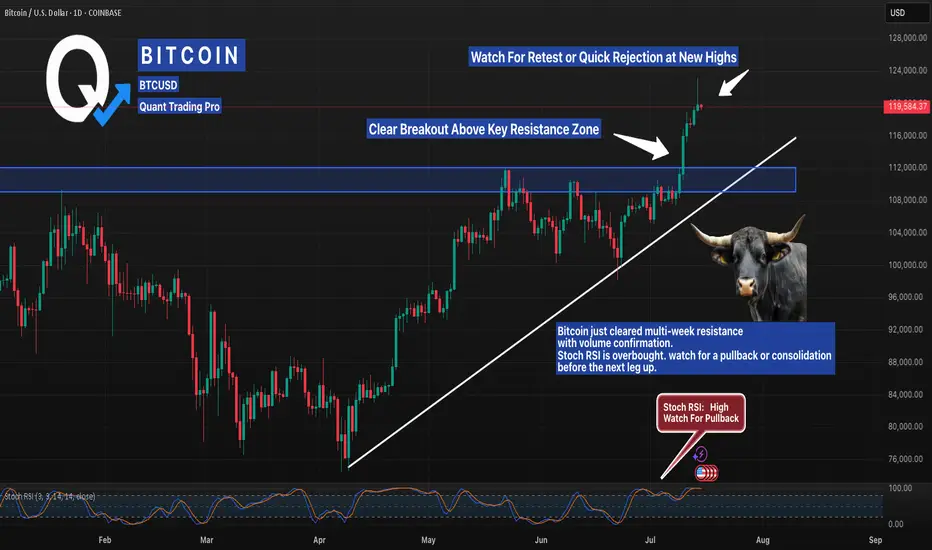
Bitcoin Just Shattered Resistance — Is a Pullback Coming Next? Bitcoin has exploded past a multi-month resistance zone with authority, confirming a breakout that’s been building for weeks. This move aligns perfectly with the rising trendline, signaling strong bullish structure. But here’s the catch — the Stochastic RSI is flashing overbought levels, a classic sign that momentum could be topping out short-term.
Smart traders are now watching two key scenarios: either we see a healthy pullback into the breakout zone (around $112K) for a textbook retest, or bulls keep control and push price into parabolic territory. If this level holds as new support, it could become the launchpad for the next major leg up.
Breakout traders, backtest your pullback strategies and manage risk — the next move could define the rest of the month.
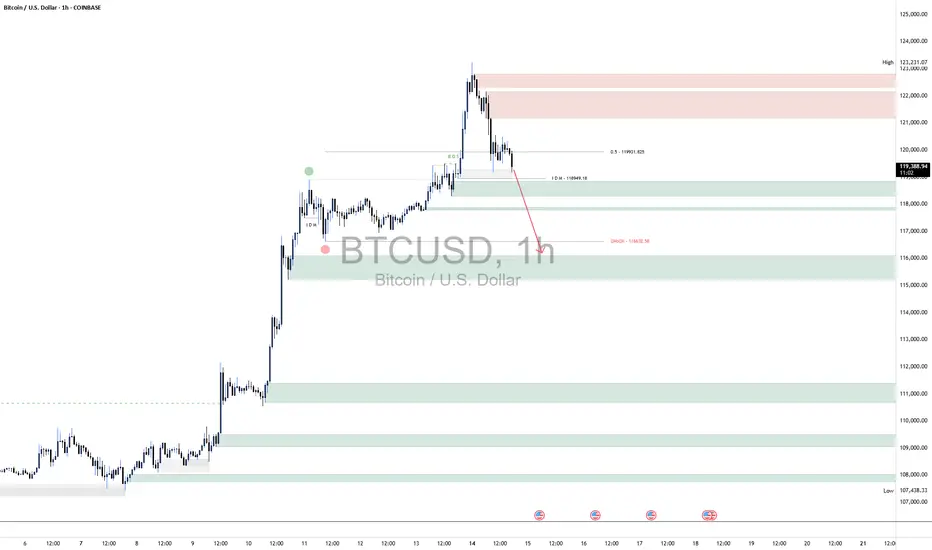
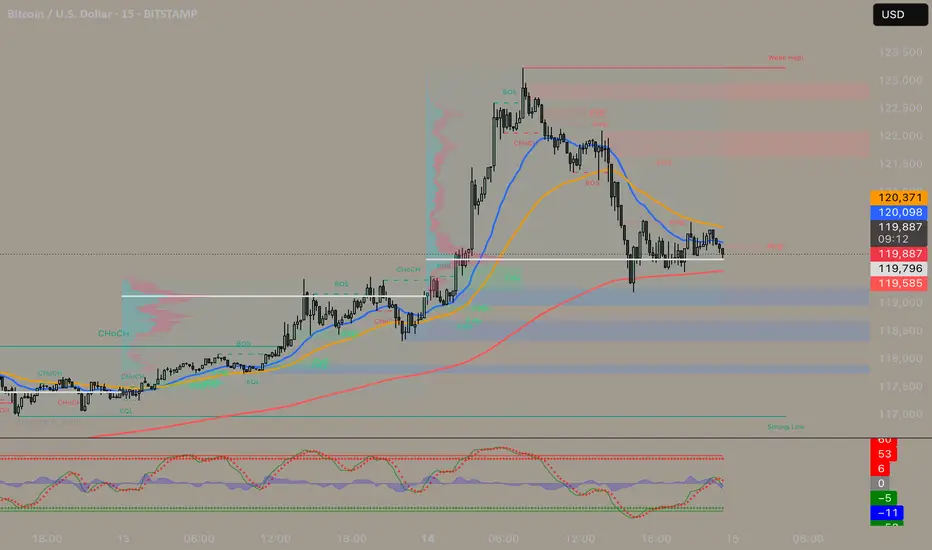
BTC ShortBTC’s 1‑hour structure is showing clear signs of weakness following rejection from the premium supply zone between 122 000 and 123 200. After sweeping equal highs and tapping into the 50 % internal retracement level around 119 900, price sold off sharply, breaking below the intraday demand at ~119 000. This shift in market structure signals bearish intent in the short term.
The strong rejection, combined with increased sell-side volume, indicates that the rally was more likely a liquidity grab than true bullish strength. As a result, BTC is now expected to continue lower toward the 117 000 level to clear resting liquidity beneath recent lows. This level aligns with the previous CHOCH (Change of Character) and is a key liquidity pocket.
Once BTC grabs the liquidity below 117 000, we anticipate a potential bullish reaction and reversal, as smart money may use this area to re-accumulate and drive price higher.
However, until that liquidity is collected, the bias remains bearish in the short term. As always, proper risk management is essential—define your invalidation clearly and manage position size responsibly to protect capital in this volatile environment.
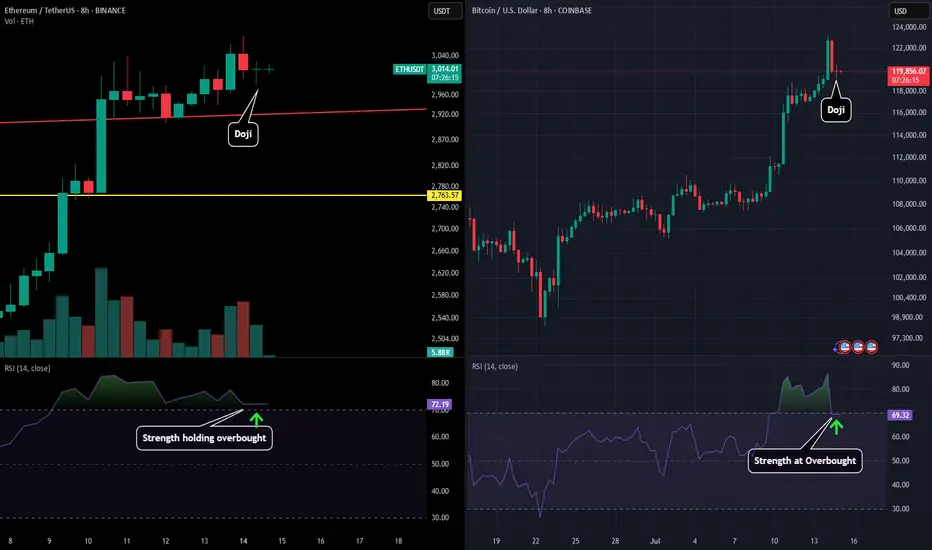
BTC & ETH - 8H Important DevelopmentWe have seen a very important development on the 8H chart for both BTC and ETH.
Both assets after seeing a selloff through the day then found some LTF support and ending up printing reversal dojis on the 8H.
Apart from the doji printing both assets are at extremely important levels for the RSI.
ETH is slight above overbought conditions meaning if we can see price start to go back up here the strength should get stronger which could help push price past the $3,100 level and towards that $3,400 level.
BTC is right at the 70 level. Therefore if price and push up here then the strength should follow and show a perfect test of overbought conditions as the support level. But if BTC price fails to maintain the strength, a dip below overbought conditions could send us further down towards the $112,000-$116,000 levels depending on how strength looks at that time. The would also coincide with a perfect retest, but the most important indicator in the short term will see how price reacts to this over the next 8 hours.
Analysis Btc 120K!Based on momentum and other technicals BITSTAMP:BTCUSD Is having some problems being in a Low volume node needing to through FVG in 15 min, 4 hr time frame. My personal bias is long but we have to break structure.
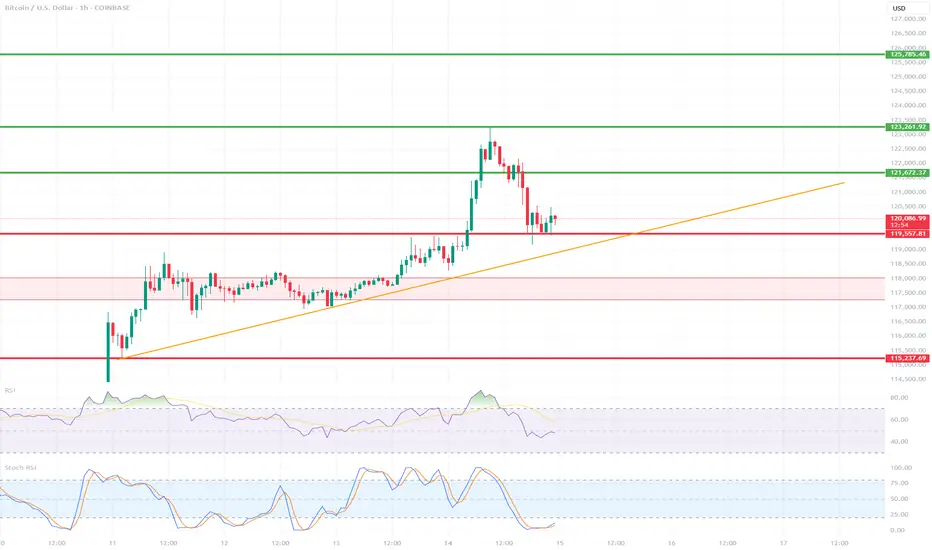
BTC/USD 1H ShortTerm🔍 Trend:
The short-term uptrend remains in effect, supported by the orange trendline.
The price has tested dynamic support but has not yet broken it.
🟥 Supports (Important Levels):
🔻 1. 119.550
Key support.
The price is currently testing it. Holding = potential upside rebound.
Breaking = greater downside risk.
🔻 2. 117.260–118.040 USD
Clear demand zone (reinforced by prior consolidation).
If the price breaks below current support, this is the next logical stopping point.
🔻 3. 115.237–115.500 USD
Strong weekly support – very important in the event of a stronger correction.
Historically, it has responded many times.
🟩 Resistance:
🔼 1. USD 121.673
The nearest local resistance – this could pose a problem for further growth.
🔼 2. USD 123.961
The last local high. Breaking it confirms the continuation of the uptrend.
🔼 3. USD 125.785
The next resistance – a potential target after a breakout to the upside.
📈 Technical Indicators:
RSI (classic):
Still below 50, but starting to reverse slightly upward – neutral with a slight potential for a rebound.
Stochastic RSI:
Gives a long signal – the lines have crossed in the oversold zone and are pointing upward.
📊 Scenarios:
🟢 Bullish:
Maintaining the current support zone (119.5–120k).
Breakout above 121.673 → target: 123.961.
Breakout of 123.961 = trend confirmation and target: 125.8k+
🔴 Bearish:
Break of the trend line and support at 119.550 → possible quick decline to 117.2k–118k.
If this doesn't hold, target: 115.2k
✅ Summary:
Decisive moment – tested trend line + support = rebound or breakout point.
The Stochastic RSI indicates a potential upside breakout, but the RSI needs confirmation.
Careful monitoring of volume and reaction to 120k in the coming hours.
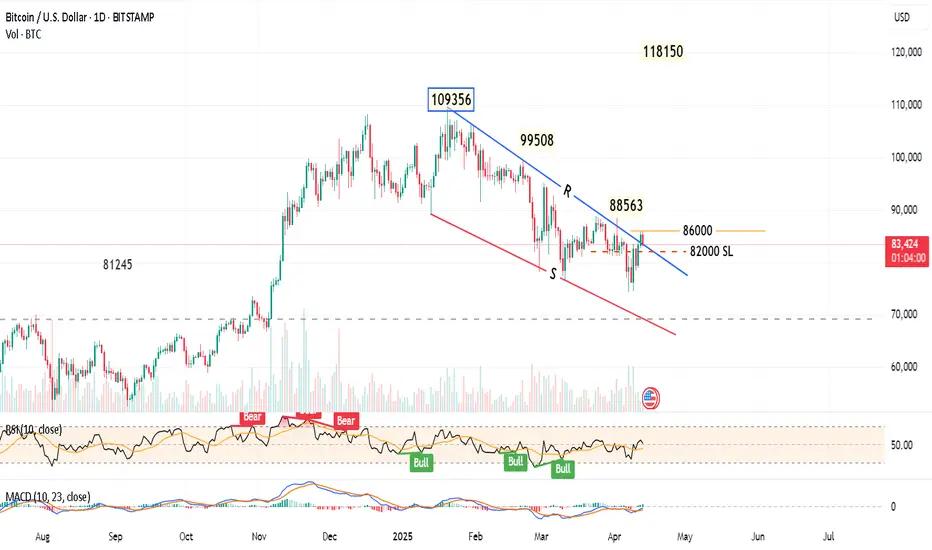
Bitcoin Towards $118KDaily chart,
The Bitcoin BITSTAMP:BTCUSD has just formed a falling wedge pattern, down from the highest High 109356.
Some consolidation may happen in the range 86000 to 82000.
Closing above 86000 for 2 days will give a strong buy signal for a bullish movement, and the target will be 118150 passing through the shown resistance levels.
Consider the Stop Loss below 82000
Note: Always place a near profit protection level, as the BTC is volatile.
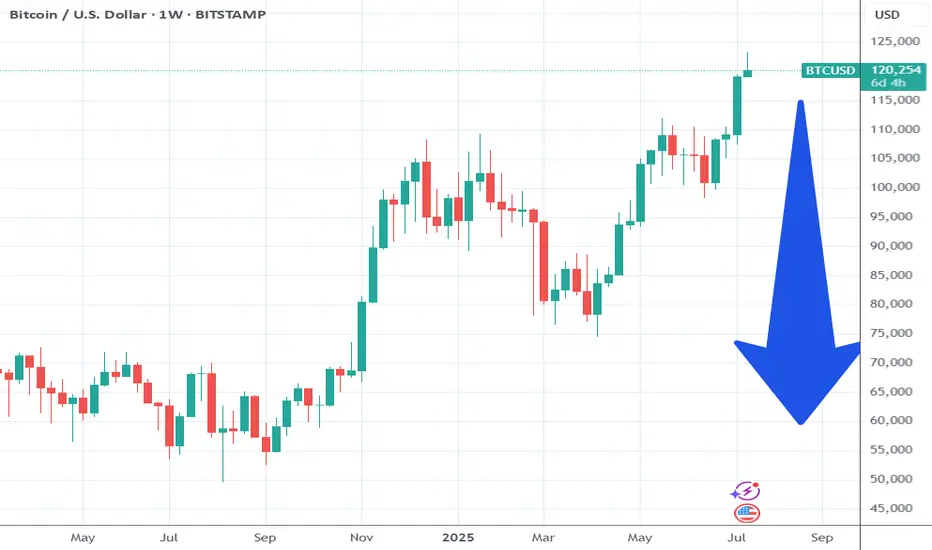
₿itcoin: Pushing Higher—But Watch for a Reversal AheadAfter taking a brief pause over the weekend, Bitcoin resumed its upward momentum early this morning, trading within the blue Target Zone between $117,553 and $130,891. This marks the first time the cryptocurrency giant has traded above the key $120,000 level. Within this zone, and in line with our primary scenario, we continue to anticipate the peak of the corrective wave B rally, followed by a trend reversal to the downside. We expect a significant wave C decline, targeting the lower blue zone between $62,395 and $51,323. As such, prices in the upper blue Target Zone may present an opportunity to take (partial) profits on existing long positions and, where appropriate, to initiate potential short positions as a hedge. These shorts could be protected with a stop 1% above the upper boundary of the zone, given there remains a 35% probability that Bitcoin could break directly above the $130,891 resistance and set a new high as blue wave alt.(i).
📈 Over 190 precise analyses, clear entry points, and defined Target Zones - that's what we do.

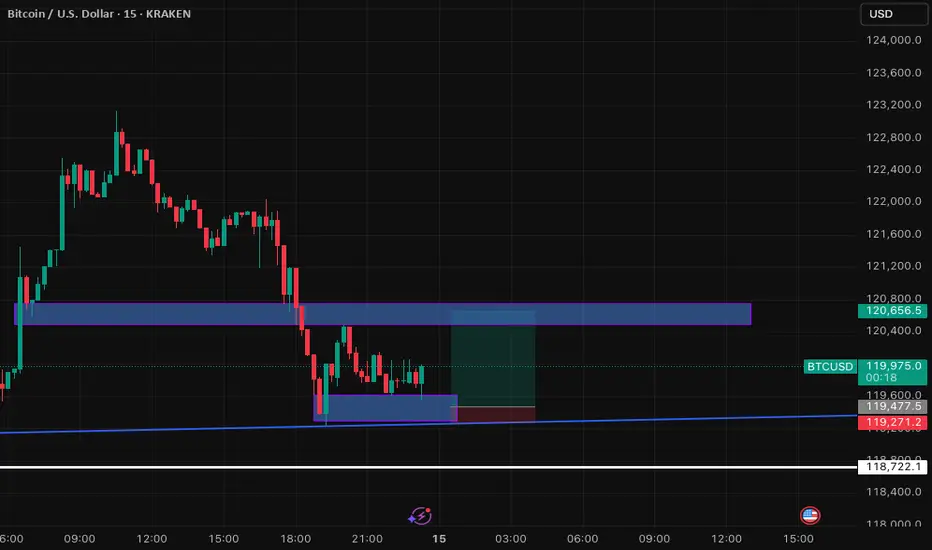
BTC/USD: 15-Min Reversal Attempt at Key Trendline SupportThis 15-minute chart for BTC/USD highlights a potential reversal opportunity following a significant downtrend. Price has found support at a confluence of a rising long-term trendline and a defined demand zone around 119,271 - 119,477.5. The analysis focuses on the current consolidation at this support, looking for bullish candlestick patterns to confirm a move towards retesting the prior breakdown level (now resistance) at 120,500 - 120,700. Key observations include the breakdown from a previous support, the current bounce, and the defined risk-reward setup for a potential long entry."
Bitcoin Pump & Dump.. Something Nobody Is Mentioning.A massive Bitcoin correction is coming. This was the peak imo.
Ask yourself this question.... Why did Bitcoin move now?
Simple answer it is a pump into events in a few months and will dump.
They pumped it and promoted the pump mainstream to get newbs to chase at the high.
Now the important part that nobody else is talking about except me!!!!
Look at Bitcoins chart over 15 years. It either drops or runs flat when the FED cuts rates.
What is coming soon? Multiple Fed cuts and a new FED chief. That is why they pumped it now.
Remember Bitcoin is traded against the dollar. When the dollar is cheap Bitcoin falls. When the dollar is expensive Bitcoin moves.
Form 2017 to 2020 the FEDs left rates unchanged and low... Bitcoin traded in the 7k-13k range for those 3- 4 years...
In October 2021... They dropped it hard from 60k to 16k in 2 years (shakeout). Used the Sam Bankman story as the catalyst.. Investors knew rates were going back up in the near term so they got people out.
What happened in 2022 after Covid to justify this 3 year bull run.... FEDS KEPT RAISING RATES AND KEEPING THEM HIGH and here we are at the end of that cycle.
Expecting this to slowly start dropping at this level, for the next year or 2.
What no one expects will happen with BitcoinAll markets go through expansion phases and correction phases. As hard as it may be to believe, Bitcoin and the entire crypto space will also face their macro correction at some point.
That doesn’t mean it’s going to crash into oblivion or that it’s all a scam — not at all. What I believe is that when that major correction hits, it will open the door to real buying opportunities.
And maybe, in 10 or 15 years, once the bear cycle has fully played out, Bitcoin will be ready to climb to 200k, 400k, 600k — or wherever the next cycle takes us.
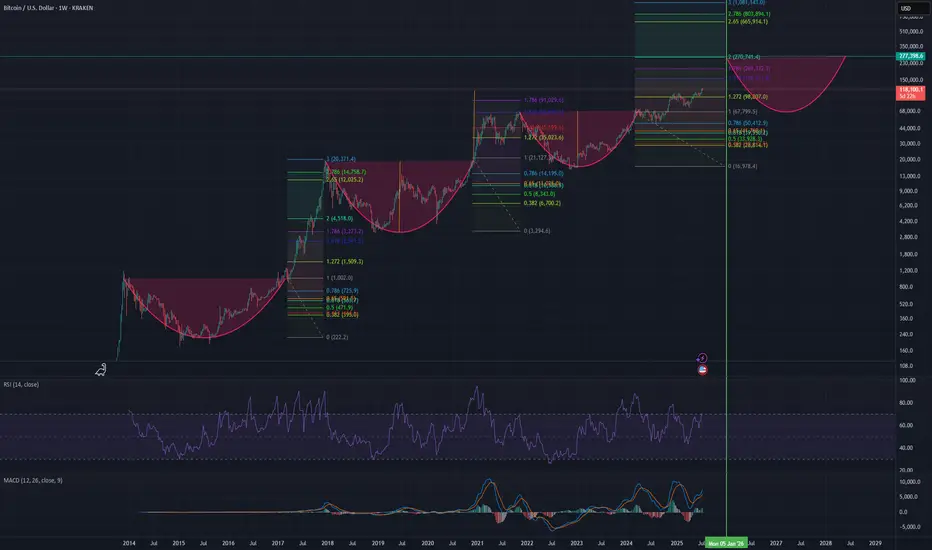
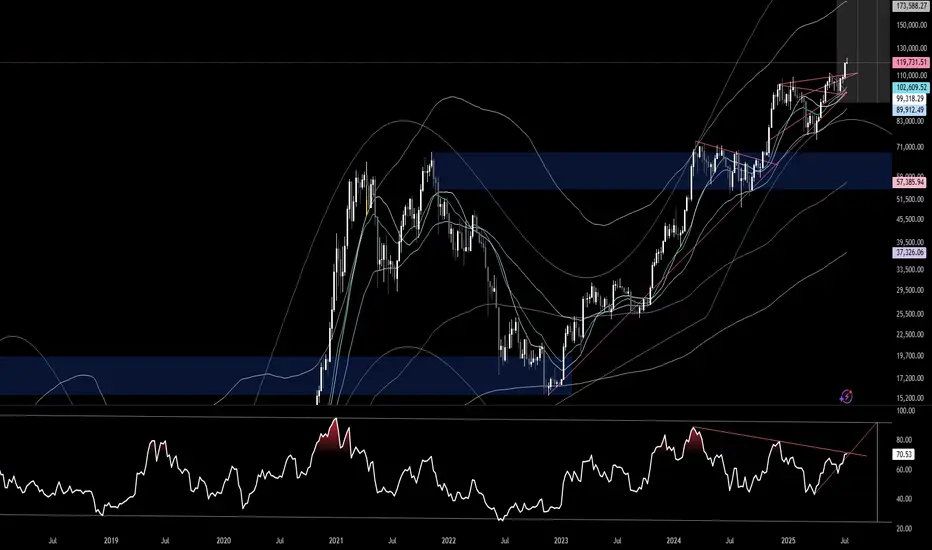
BTC 1W RSIThe BTC 1W RSI is on the verge of breaking above the down sloping trend. Once above it, the sky is the limit. The question is, when will it happen and how high will it go?
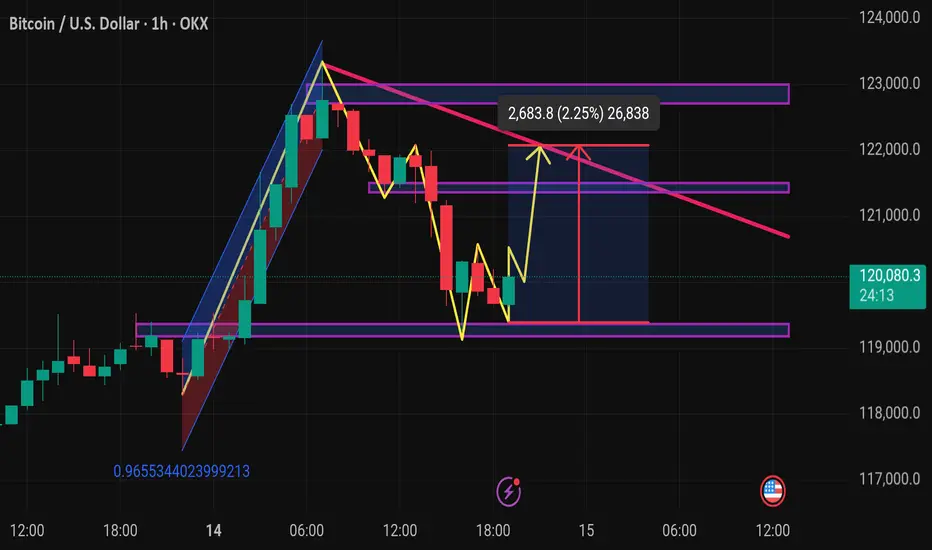
Btcusd techinical analysis.This chart is a 1-hour candlestick chart for Bitcoin/US Dollar (BTC/USD) from OKX, analyzed using TradingView. Here's a breakdown of the technical elements:
---
🔍 Key Observations:
1. Current Price
$120,054.6 with a +0.77% gain.
Price appears to be rebounding from recent support.
2. Chart Patterns & Annotations
Yellow Zigzag Lines: Indicate recent price action and a potential bullish reversal pattern forming.
Purple Zones: Likely represent key support and resistance levels.
Pink Downtrend Line: A descending trendline showing the bearish resistance.
Blue Box Area: Suggests a potential price movement range—either up or down.
---
📈 Technical Analysis Insights
✅ Bullish Case (Upside Scenario)
Break above descending trendline could lead BTC to:
Target: ~122,800 - 123,000
Potential
Retail in?After almost 3 decades as a trader, if there is one thing I have learned over the years, significant highs are made when sentiment is at extremes. Whether it is "mom and pop" or the "shoeshine guy" calling the top, it's when the buying (or selling) by retail is at a fever pitch. These days, you can't find a bear in Bitcoin, and the days on end of reports preaching "record inflows" is almost deafening.
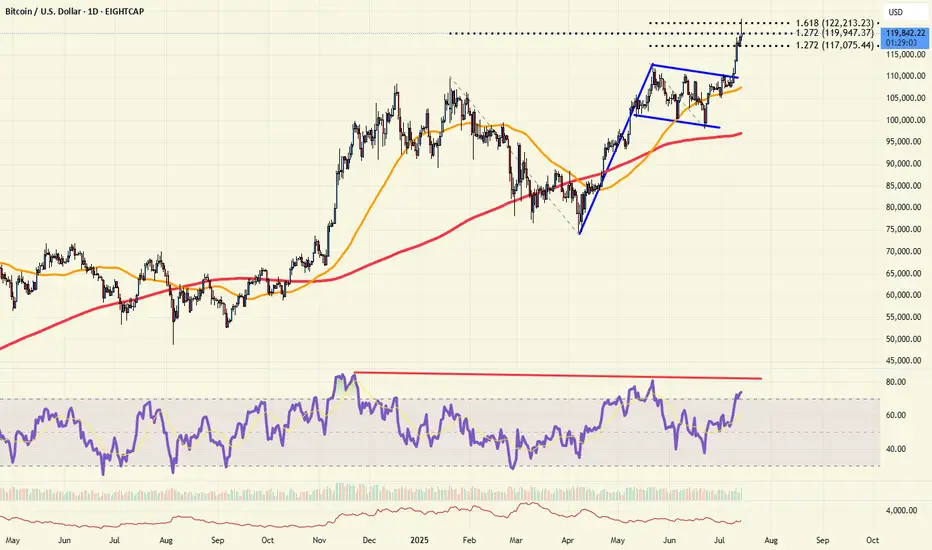
Technically, Bitcoin is probing some key resistance today. It's stalled by the 161% Fibonacci extension of the recent early May highs to June lows. More importantly is the 127% extension of the January highs to April lows. RSI is very divergent as price hits new highs. And with sentiment at near extremes, bulls should be careful now. And a break back below the 112k level would be a very bearish "topping pattern" event.
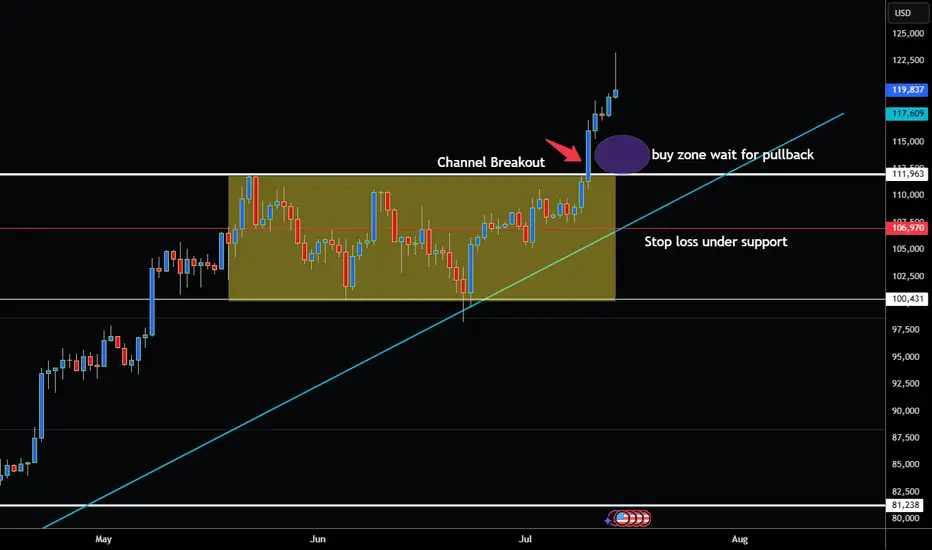
BITCOIN BREAKS OUT OF CHANNEL AND NOW AT ALL TIME HIGHS!Hey Traders wow just a few week ago I was watching to see if it was going to pullback instead smashes above all time high. Thats how quick these markets can change in the blink of an eye!
Lesson here (Always Expect the Unexpected in the Markets!) 😁
Ok so now we have channel breakout above resistance at 112,100. About 70% of the time market will retest this level before continuing the trend.
This could be a great place to buy on the pullback!
So if your bullish buy around $112,100-113,000 I would recommend a wide stop to give the market room to breath around 106,970.
However if bearish I would not consider selling unless market has complete reversal and has daily close below uptrendline at 106,000 .
Bears Be careful because this Bull looks like it has Horns!
Good Luck & Always use Risk Management!
(Just in we are wrong in our analysis most experts recommend never to risk more than 2% of your account equity on any given trade.)
Hope This Helps Your Trading 😃
Clifford