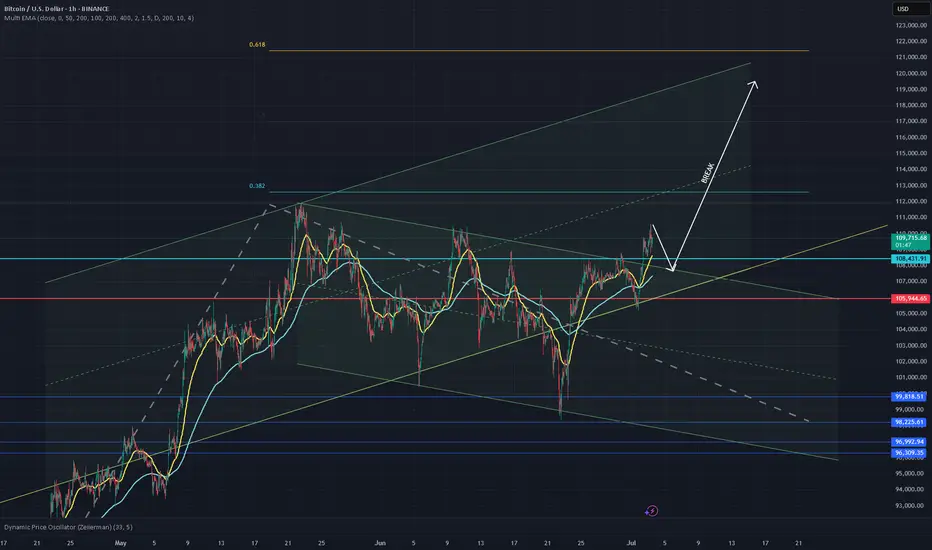
Major Flag Breakout Meets Multi-Year Resistance – What’s Next?After breaking out of the large flag pattern that had been forming on the daily chart, Bitcoin pushed upward with conviction — fueled by a clean 4-hour impulse move. This move carried price directly into a major resistance zone that has held for the past 7–8 years.
I was initially skeptical of a full continuation here, given the historic strength of this zone. But observing how price behaved — especially the smooth structural advance, EMA alignment, and volume absorption — I’ve revised my bias.
We’ve seen liquidity swept from the downside, and price continues to find support in every micro-dip. Given the compression and resilience at these levels, I now expect the market to push further.
Key zone to watch: If we reclaim the midrange after this consolidation, a clean extension beyond the resistance becomes increasingly likely.
Caution: This is not a blind long — entries must be placed with discipline, especially as we test macro resistance.
#BTC #PriceAction #TradingView #CryptoAnalysis #Breakout
BTCUSD trade ideas
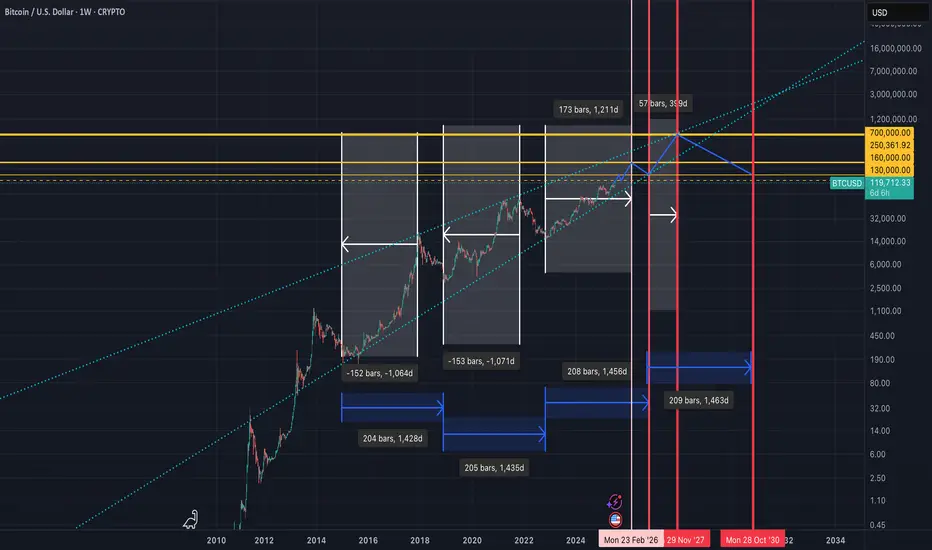
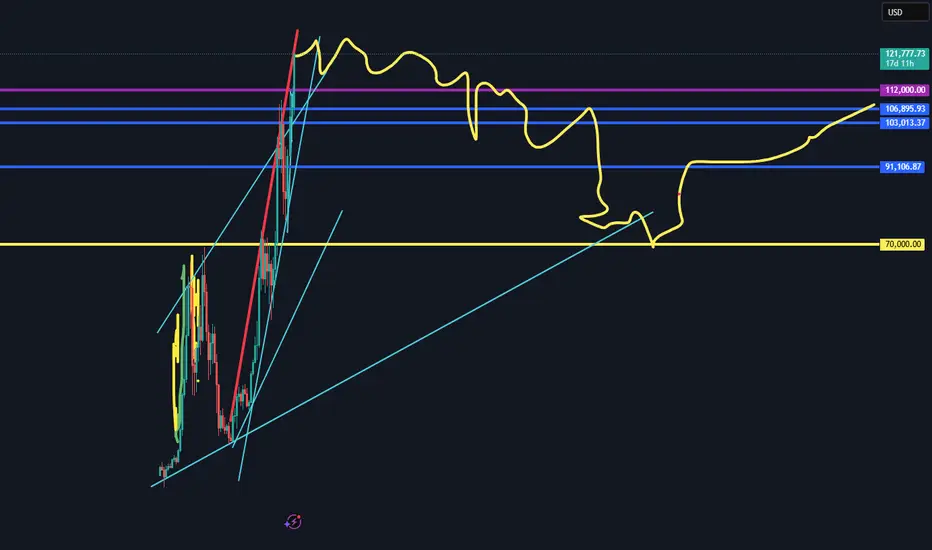
What if Analysis for BitcoinNormal Cycles are dead!! According to extended measurements, elliot waves, fib retracements, trend analysis, cyclic lines and QE timeframes, we might see a different play this time, which will leave everyone sidelined i.e Max Pain. We saw for the first time a Bitcoin bull run while we are in a Quantitative Environment. This means that BTC from now on works as a risk off asset. So, imagine we have a local top on September 2025, where the normal cycle ends around 160k then a quick drop at 130k where everyone thinks the bear market is here and after that quick pump on 250k. Then 9 months bear market (usually 12 months) but now shorter cause we have an extended short term cycle for bull run and after that we hit on 2027 directly 700k USD, where we find the huge bear market which will last longer than usual leading to 100k usd on 2030. The target of 700k usd alligns perfectly with fib levels, trend resistances Larry Fink prediction of BTC going to 700k and lastly and most important due to the published data of FED of wanting to revalue gold to buy 1 million btc in the next years. If we multiply gold's price around 3400k per ounce, multiply USA gold reserves (which is in tons, so we have to convert ounces to tons) and then divide that number with 1,000,000 BTC, guess the price--> yes correctly 700k per BTC!!!!!!!!! Let's go boyz!
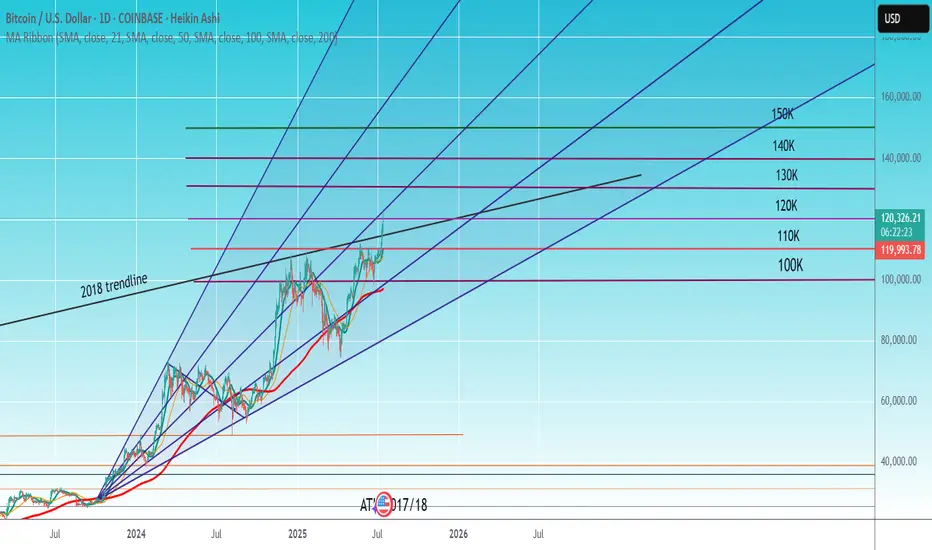
BTC price discoveryBroke the 2018 ATH Trendline. I won't day trade BTC, just gives me a feel on alts and crypto stocks.
BTCUSDBTCUSD is currently trading at 120,246, presenting a favorable buy zone near the current price.
The first resistance level lies at 123,352, where price may face initial selling pressure.
The second resistance is stronger at 125,857, indicating a more significant hurdle for upward momentum.
A confirmation of bullish strength will be established if BTCUSD breaks and holds above 126,857.
Traders can consider entering long positions around 120,000–120,300, aligning with the current market level.
To manage risk, a stop-loss should be placed just below the key support at 117,988.

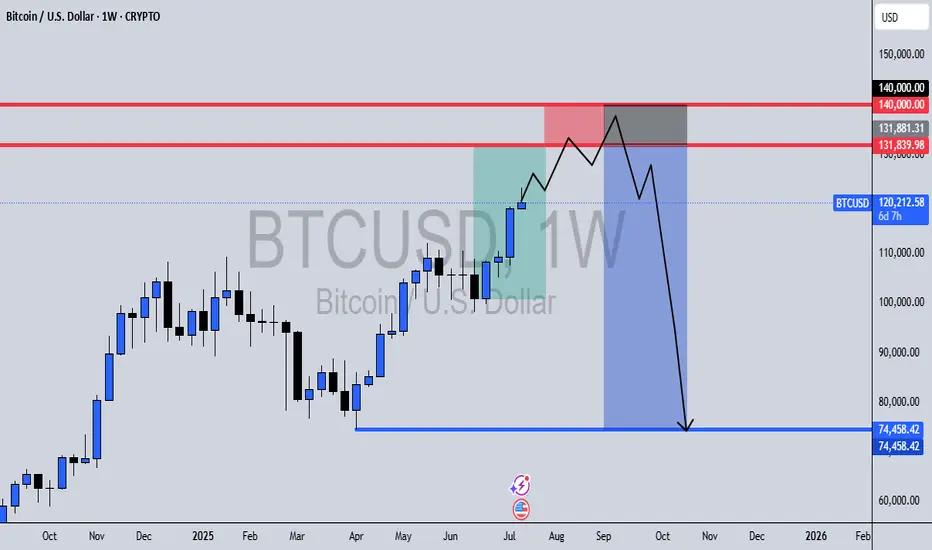
BTCUSD Weekly Outlook📅 Date: July 14, 2025
📍 Timeframe: 1W (Weekly)
🔍 Key Zones:
🔴 $131,839 – $140,000: Major liquidity pool & reversal zone
🔵 $74,458: External range liquidity target
Bitcoin has been pushing higher week after week, but this setup hints at a trap for late bulls.
Here’s what I’m watching:
Reversal Zone Between $131K – $140K
Price is approaching a critical area packed with buy-side liquidity, where I anticipate a liquidity sweep followed by a shift in market structure. This area also aligns with previous highs and psychological resistance.
Liquidity Sweep & Break of Structure
Once price sweeps the highs and takes out weak hands, I expect a bearish breaker block to form as the reversal confirms. This will be the key signal for a move down.
Targeting External Range Liquidity at $74K
The sharp decline afterward is expected to reach the external range liquidity around $74,458, taking out long-term resting liquidity. This aligns with clean inefficiencies and unmitigated imbalances on the chart.
🔔 Conclusion:
While the short-term bias may remain bullish into the red zone, I’m prepping for a high-probability swing short after signs of exhaustion and confirmation at the top. This is a classic smart money play—liquidity grab, breaker, and redistribution.
📌 Set alerts around $131K – $140K and monitor for structure breaks and bearish rejections.
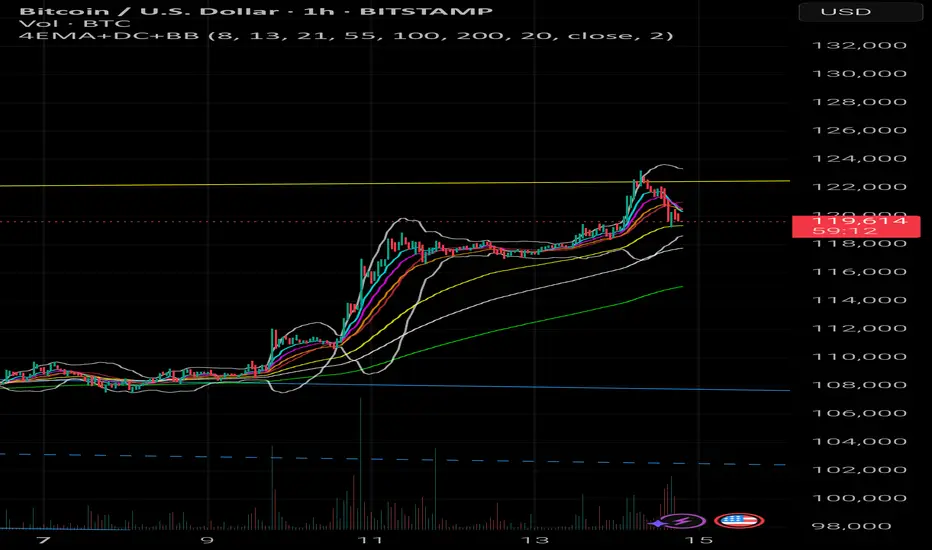
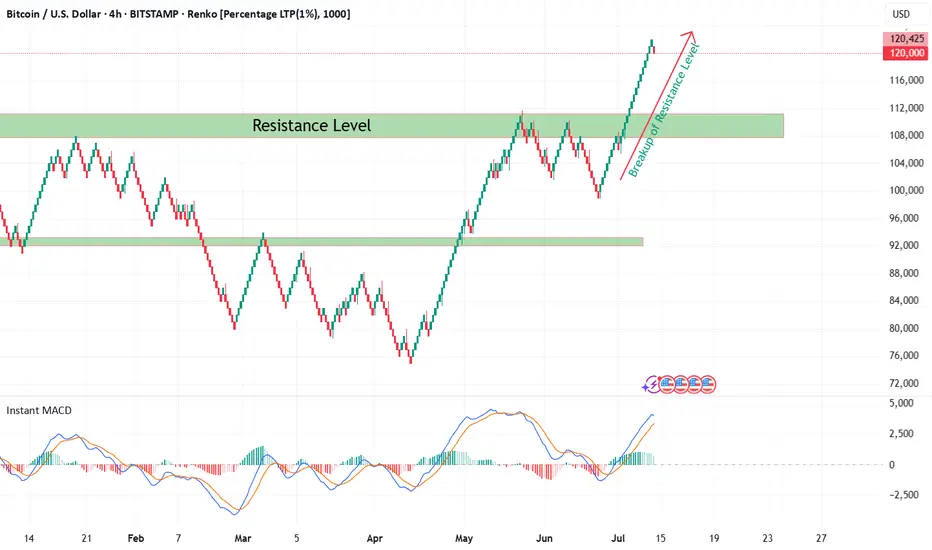
Bitcoin Renko Breakout Confirmation with CryptoQuant NetflowFrom late 2024 till now, Bitcoin (BTC/USD) was consolidating within a broad sideways range between well-defined support and resistance levels on the 4H Renko chart. During this time, market indecision was obvious as neither bulls nor bears could establish dominance.
Recently, BTC has decisively broken out above the major resistance zone at ~$108,000 — as seen with my custom Renko + Decision Tree + S/R Channel script ( ). This breakout above resistance technically suggests the end of range-bound price action and the potential start of a new bullish trend, especially when confirmed by on-chain data.
On-Chain Netflow Confirmation
As I originally highlighted in my CryptoQuant Netflow analysis (published under the username ‘cryptoonchain’ on CryptoQuant platform):
Total Exchange Netflow for Bitcoin has recently dropped to its lowest level since February 16, 2023 — at which point the last bullish cycle began.
Negative Netflow means more BTC is being withdrawn from exchanges than deposited, indicating reduced selling pressure and strong holder conviction.
Binance-specific Netflow also confirms massive outflows, a sign whales and large traders are accumulating and withdrawing funds from trading venues.
Historically, this combination — a technical breakout (Renko) and deep negative on-chain netflow (dataset: CryptoQuant) — has preceded major bull runs.
Summary
Based on both my Renko model and current on-chain flows:
The breakout above 108,000 resistance marks the start of a likely new uptrend for BTC (now 119,000).
On-chain data via CryptoQuant strongly supports the bullish scenario.
Invalidation
If BTC returns below $108,000 and consolidates there, this bullish outlook is invalidated and a reassessment is required.
BTC POTENTIAL PULL BACK ????Will Bitcoin continue going higher or will it crash a bit? Its something we have to wait and see. We have to be ready and prepared for what it wants to do!!!
Here is my technical analysis, but may the Lord lead you as you trade and invest. May you allow Him to show you where to cast your nets!!! (John 21:6 KJV)

symmetrical triangle in progressBitcoin has been consolidating at this level for several weeks, easing some of the pressure in order to push above 120K. As of today, we have a clear formation—a large symmetrical triangle—which confirms the continuation of the upward trend and rules out any possibility of returning to lower levels.
BTC/USDT HIDDEN PATTERN! SM, FIB AND MORE COMFIRMED!Price Resilience Amid Geopolitical Stress
Bitcoin demonstrated remarkable strength during the Israel-Iran conflict, briefly dipping to ~$98K but swiftly rebounding above $105K. This aligns with historical patterns where BTC initially sells off on geopolitical shocks but recovers aggressively within weeks, outperforming gold and equities by 15-60% post-crisis. There is a $96K-$94K "footprint" that coincided with institutional accumulation, evidenced by $1.37B in spot ETF inflows during the conflict week, led by BlackRock's IBIT ($240M single-day inflow) according to official information. This institutional backstop and many others might single-handedly prevented a deeper correction for now, remember that smart money psychology is to create cause out of thin air and buy during selling and indecisive times.
Critical Levels to Watch
Immediate Support: $108k area is vital. A sustained hold here maintains short-term bullish momentum. The 50-day SMA near $102.8K (tested during June 13 conflict sell-off) remains a macro support floor.
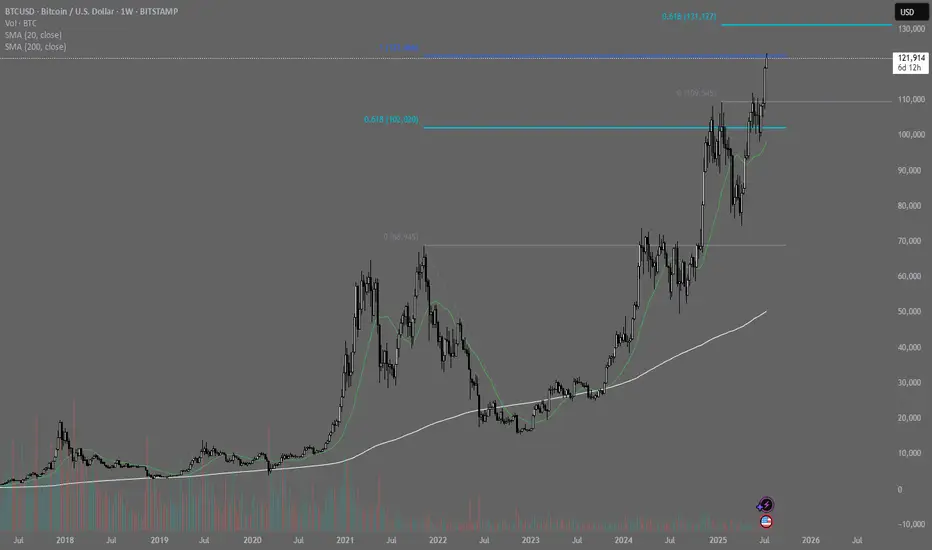
Resistance & Targets: The $112K ATH is the near-term ceiling. Breaking this requires stronger spot demand—currently, net exchange inflows are negative, indicating weak retail participation or traders that are backing off for now.There's a $120K target (0.618 Fib) aligned with Standard Chartered’s $150K year-end model if ETF inflows persist.
Risk Zones: A close below $108.3K risks a slide to $105K. Failure here opens path to $96K and a further break of this 92k to 96k zone could lead directly to 70k area or even lower if economical and social activities are not favorable in the near to medium future.Dominance above 55% (currently 65%) delays alt season, but a break below 60% could ignite alts in a positive way.
Macro Catalysts & Market Sentiment
Policy Tailwinds: Trump’s "One Big Beautiful Bill" (proposing $5T debt ceiling hike and U.S. strategic BTC reserves) could weaken the USD, boosting BTC’s "digital gold" narrative. DXY’s -9% YTD drop already correlates with BTC’s 54% post-election rally.
Fed Influence: Pressure to cut rates (amid cooling employment data) may accelerate institutional rotation into BTC. ETF inflows hit $2.75B in late June, signaling renewed institutional FOMO.
Geopolitical Cooling: Iran-Israel ceasefire talks reduced immediate panic, but residual volatility risk remains. Traders note BTC often rallies 20-40% within 60 days of conflict events.
Structural Challenges
Liquidity Fragility: Whale moves (for example: 10K BTC sell orders) now impact prices more due to ETF-driven liquidity concentration. Recent $98K flash crash exemplified this.
Regulatory Overhang: MiCA compliance costs in the EU and U.S. security-reclassification proposals could pressure smaller tokens, though BTC’s status appears secure 28.
Seasonal Slump: July historically sees 6.1% of annual crypto volume—low volatility may delay breakouts until August 4.
Strategic Outlook
A July breakout above $112K could ignite the next leg to $120K, but a retest of $107K-$105K is likely first. Altcoins remain subdued until BTC dominance breaks <55%—select projects with institutional backing (for example, ETF candidates) or real-world utility for asymmetric opportunities.
Conclusion: BTC’s resilience amid chaos confirms its institutional maturity. Trade the $108.3K-$112K range aggressively, with a break above ATH targeting $120K by September. Always hedge tail risks (escalations, regulatory shocks) in this volatility-rich asset class. While this great surge in institutional inflow is good for BTC it also indicates a reduction or slower pace of other crypto currencies.
This is my analysis for BTC, let me know what you think and I hope you like it!
It is over moonboysMajor correction on the way. I saw many billboards in my country this week for buying Bitcoin. Strong sell signal. It is happening. Bog boys needs liquidity for selling.

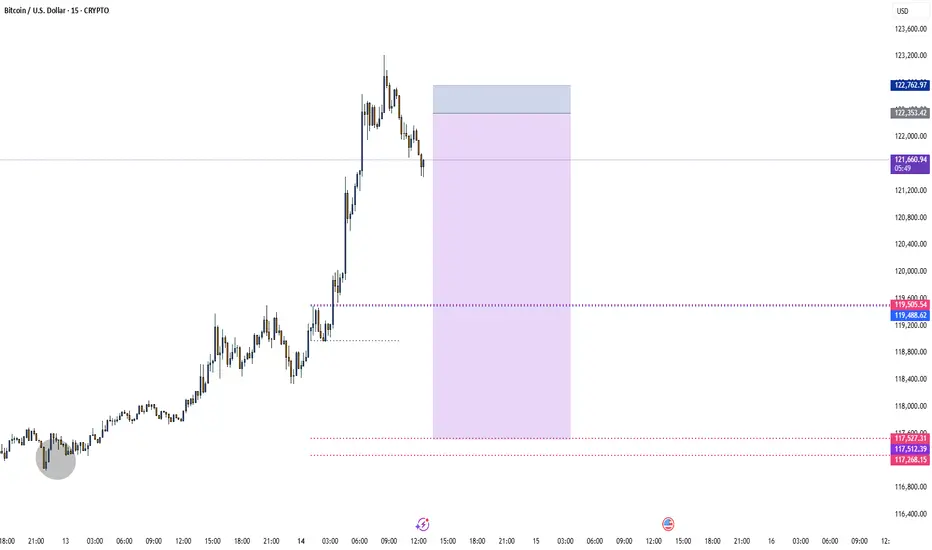
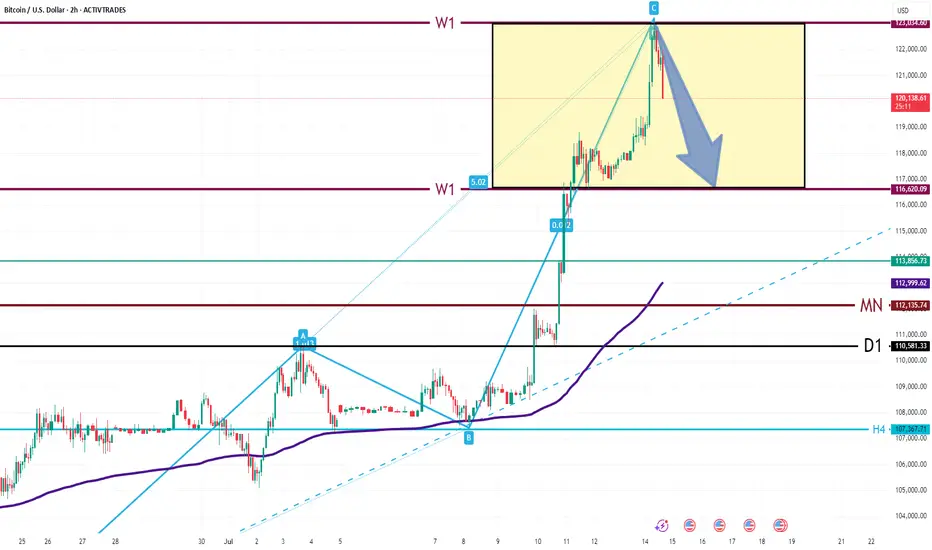
BTC/USD: Rejection from 123,000 Triggers Correction Market Overview:
Bitcoin surged to the 123,000 resistance zone, completing a potential ABC bullish pattern. The price has since pulled back sharply, indicating the start of a correction. Current price action suggests consolidation within the 116,600 – 123,000 range, as traders lock in profits and reassess direction.
Technical Signals & Formations:
— ABC bullish pattern completed at the top
— Strong weekly resistance at 123,000
— Horizontal support at 116,600 acting as key pivot
— EMA(144) far below, suggesting room for deeper correction if weakness persists
Key Levels:
Resistance: 123,000, 126,000
Support: 116,600, 113,800, 113,000, 110,580
Scenario:
Primary: continued pullback toward 116,600. A breakdown below this level may lead to further downside targeting 113,800–113,000.
Alternative: stabilization within the range, followed by a rebound and potential retest of 123,000.
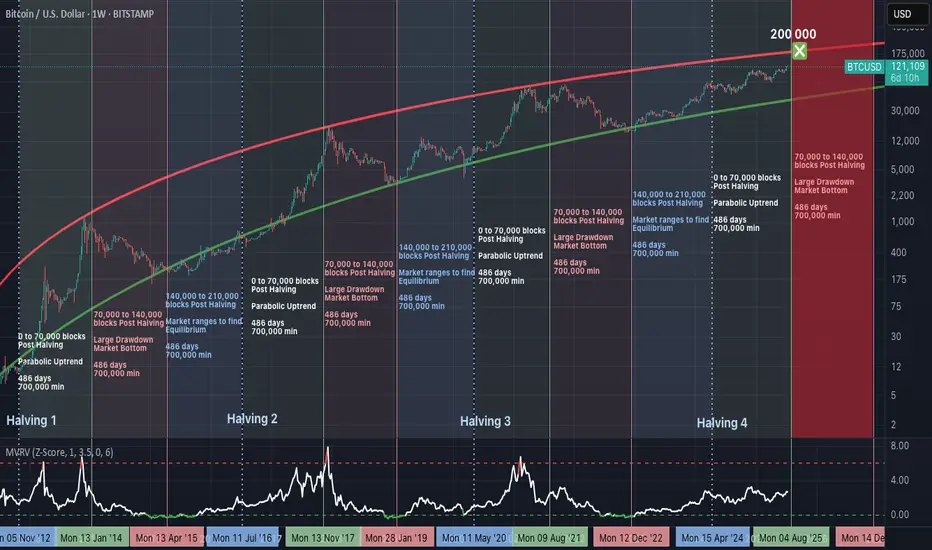
Bitcoin’s 486-Day Halving Blueprint: The $200,000 Blowoff?Summary
Bitcoin’s price consistently follows a 3-phase structure after each halving, with ~486 days per phase. If history repeats, we are nearing the end of the parabolic phase, with a potential peak around $200,000, before entering a structured drawdown.
Halving Cycles: The Real Clock Behind Bitcoin
Bitcoin’s monetary policy is pre-programmed.
A halving occurs approximately every 210,000 blocks (~4 years), and market behaviour after each halving follows this repeating pattern:
Phase 1: Parabolic Rally (0 to 70,000 blocks post-halving).
Phase 2: Major Drawdown (70,000 to 140,000 blocks).
Phase 3: Equilibrium Phase (140,000 to 210,000 blocks).
Each phase lasts approximately 486 days, and this structure has repeated reliably since 2012.
Phase 1: The Parabolic Rally (Current Phase)
We are currently in the growth segment of the cycle:
Price rising rapidly.
Miner profitability at highs.
Hashrate and network security increasing.
MVRV Z-Score steadily climbing, but not yet overextended.
Roughly 700,000 BTC are mined during this period, creating a supply shock as issuance is halved while demand accelerates.
Phase 2: The Drawdown (Expected Next)
Historically begins between block 70,000 to 140,000 post-halving.
Market peaks and begins to correct.
Miner margins compress.
Hashrate may plateau or decline.
Forced selling and miner capitulation drive volatility.
Price retraces significantly from the peak.
This phase resets the market and eliminates unsustainable excess.
Phase 3: The Equilibrium Phase
Occurs between block 140,000 to 210,000 post-halving.
Price enters consolidation.
Realized value and market price converge.
Ideal accumulation period for long-term investors.
Network fundamentals stabilize ahead of the next halving.
This phase is critical in building the base for the next cycle.
MVRV Z-Score: Market Thermometer
The chart includes the MVRV Z-Score, a key metric showing how far price deviates from realized value:
Readings above 6.0 have consistently marked cycle tops.
Readings near or below 0 have marked major bottoms.
Current value is around 2.67 — indicating a rising trend, but not overheated.
This metric reflects market-wide profitability and speculative pressure.
Why $200,000 Is in Sight
The projected resistance curve on the chart suggests that:
$200,000 aligns with the top of the long-term parabolic channel.
It corresponds with the expected end of the parabolic phase (Q1–Q2 2026).
It fits prior extension patterns following each halving.
It is a strong psychological target, likely to trigger heavy profit-taking.
This price level is not arbitrary—it is derived from the same structure that defined previous peaks.
What Comes After
If the historical cycle structure remains intact:
The peak should occur before mid-2026.
A deep correction phase follows, likely into 2027.
True bottoms tend to occur as miner capitulation concludes and difficulty adjusts downward.
This is where conviction and preparation matter most.
Final Thoughts
Bitcoin cycles are not random. They are structured around block height, issuance, and miner economics.
Every cycle since 2012 has followed this 486-day framework, divided across parabola, crash, and reset. This model has outperformed calendar-based predictions and technical narratives.
Disclaimer
This content is for educational and informational purposes only and does not constitute financial, investment, or trading advice. Past performance is not indicative of future results. Always do your own research and consult with a qualified financial advisor before making investment decisions. The author holds no responsibility for any losses incurred as a result of using the information presented herein.
BTCUSD : b-e-c-a-r-e-f-u-lMaybe price is just trying to buy back what was sold previously.
Of course, now at a higher price.
By the look of it, there isn't any new 'supply'.
Do you think price can move higher if there is NO supply - no one 'selling'?
Good luck.
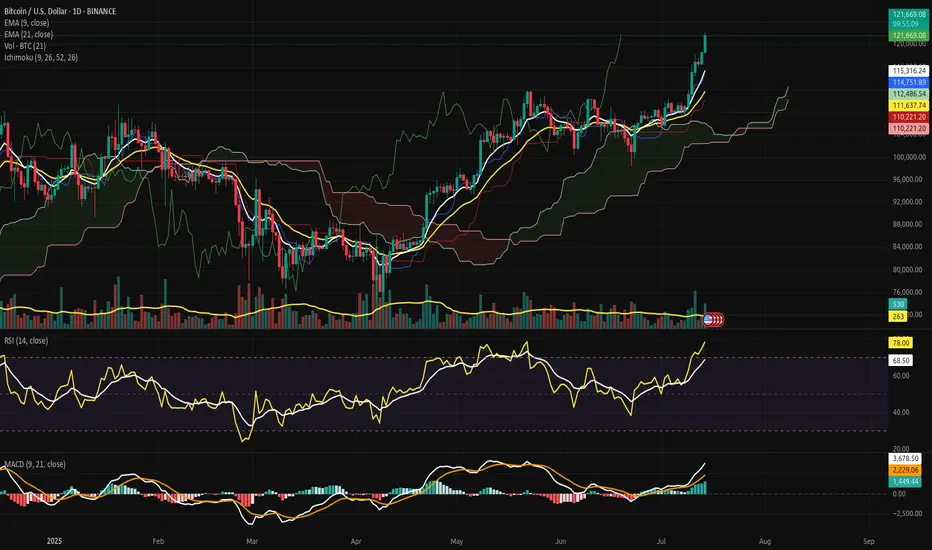
Bitcoin Ascends into the Clear Sky: Structural Break Confirmed.⊣
⟁ BTC/USD - BINANCE - (CHART: 1D) - (Jul 14, 2025).
◇ Analysis Price: $121,662.29.
⊣
⨀ I. Temporal Axis - Strategic Interval - (1D):
▦ EMA9 - ($115,313.08):
∴ The EMA9 is aggressively sloped upward, serving as dynamic support during the latest expansion phase.
✴️ Conclusion: Bullish control confirmed; momentum is guided tightly by the EMA9 anchor.
⊣
▦ EMA21 - ($111,636.30):
∴ EMA21 remains positively inclined, acting as a structural trend base beneath price and volume clusters.
✴️ Conclusion: Market remains structurally sound as long as price stays above the 21-day mean.
⊣
▦ Volume + EMA21 - (Volume: 497.79 BTC - EMA21: 262 BTC):
∴ Volume surge surpasses the rolling average, confirming institutional participation and breakout legitimacy.
✴️ Conclusion: Volume expansion validates price movement - no signs of divergence or exhaustion detected.
⊣
▦ RSI + EMA9 - (RSI: 77.99 - EMA9: 68.49):
∴ RSI has entered overbought territory, yet its trajectory remains upward and wide above its smoothing band.
✴️ Conclusion: Bullish momentum sustained; overbought conditions not yet reversing.
⊣
▦ MACD - (9, 21, 9) + EMA's smoothing:
∴ MACD: 3,271.60 | Signal: 2,013.81 | Divergence: +1,257.79;
∴ The MACD line is expanding positively over its signal, confirming momentum acceleration.
✴️ Conclusion: Technical conviction favors bullish continuation; signal remains clean and unsaturated.
⊣
▦ Ichimoku Cloud - (9, 26, 52, 26):
∴ Price is decisively above the Kumo cloud - “Clear Sky” territory;
∴ Senkou Span A = 121,653.30 | Senkou Span B = 112,486.54;
∴ Tenkan and Kijun lines are sharply elevated, confirming trend authority.
✴️ Conclusion: Zero resistance above; cloud projection supports further upward development.
⊣
🜎 Strategic Insight - Technical Oracle:
∴ All indicators are aligned in a rare harmonic convergence, signaling trend expansion with no current topping structure;
∴ Market shows the behavior of an advanced impulse wave entering Phase II expansion;
∴ Strategic play remains bullish - pullbacks, if any, should be shallow and fast.
⊣
𓂀 Stoic-Structural Interpretation:
∴ Structurally Bullish – Tactically Advancing
⊢
⧉
Cryptorvm Dominvs · ⚜️ MAGISTER ARCANVM ⚜️ · Vox Primordialis
⌬ - Wisdom begins in silence. Precision unfolds in strategy - ⌬
⧉
⊢
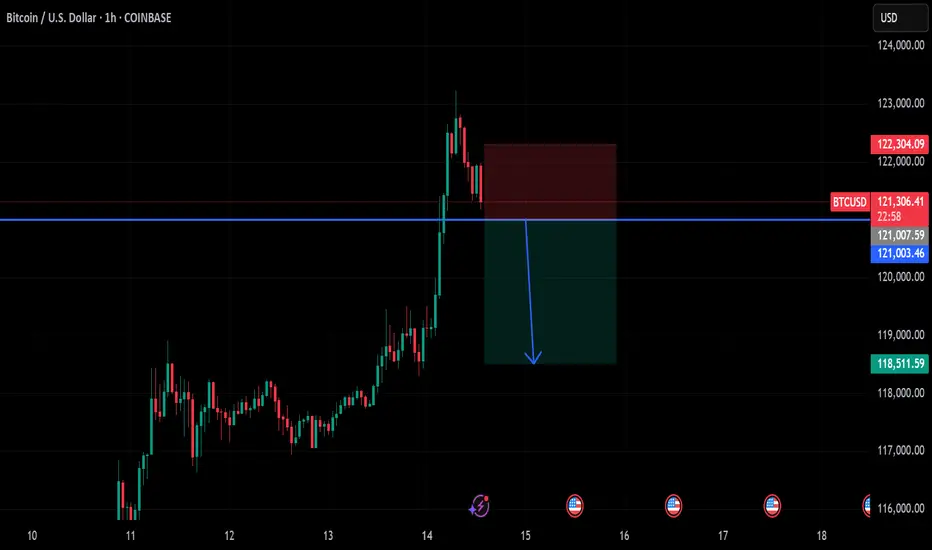
btc on sell below 121k#BTCUSD price now on reverse, expected entry below 121k on H1 closure.
Target 118500, Stop loss 122300. First short TP at 120500 for possible reverse on buy.
Bullish can take place if the H1 doesn't close below the sell entry, any breakout above 123k again will reach 125k.
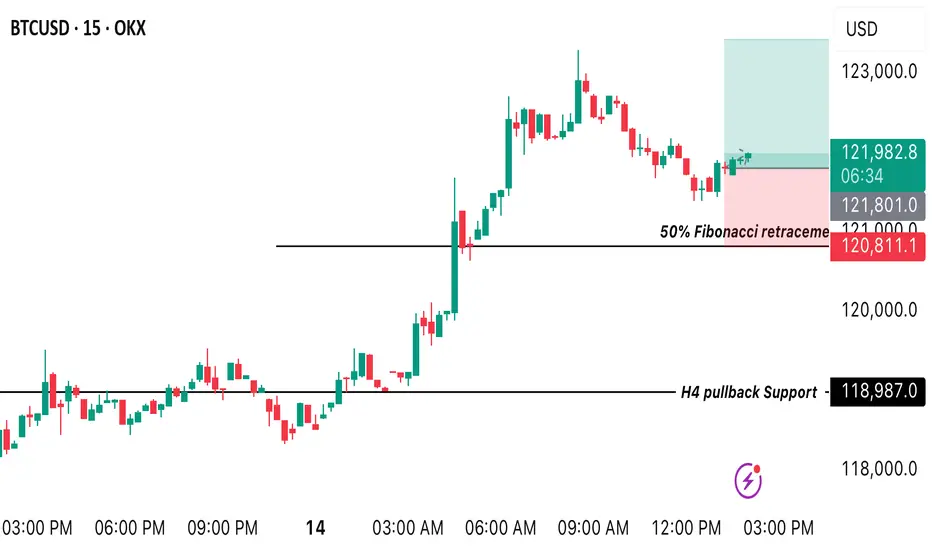
BTC/USD BUY OPPORTUNITY We’re looking at the market structures BTC is making from the M15 timeframe and we can spot a nice buy opportunity around the 38.2% fibo retracement of the recent impulse like pattern created in H4 I still believe price is going to trade bullish up onto $123419 A buy opportunity is envisaged from the current market price.
BTC TOP AND BEARISH AND CONTUNITY PREDICTION This chart is purely based on technical analysis. The RSI is still not oversold on the monthly chart, which means there might be a little more upside to this. But from the trendline, a serious reversal appears due. I could be wrong, but we'll all see. Profit taking may commence bit by bit.
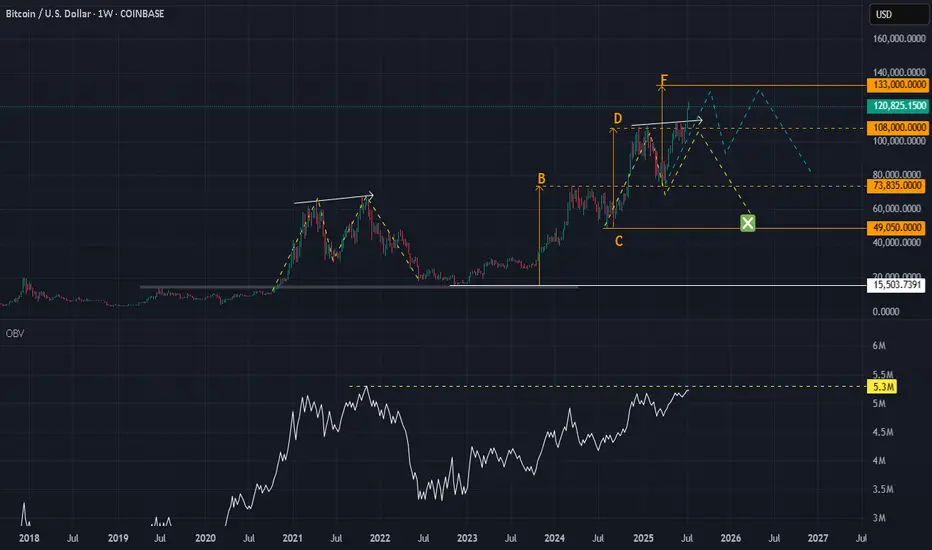
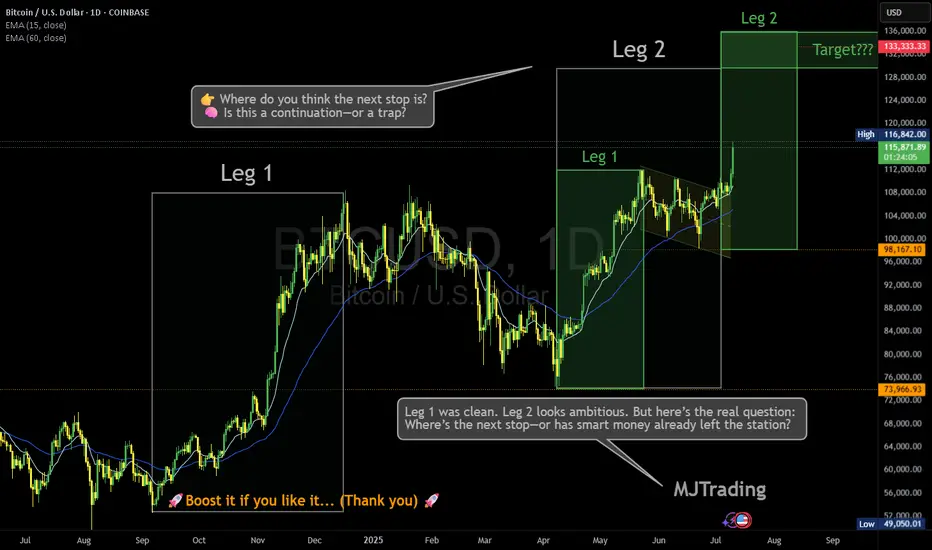
Where is the next stop? 133,333?Leg 1 was clean. Leg 2 looks ambitious. But here’s the real question: Where’s the next stop—or has smart money already left the station?
BTC just sliced through both EMAs with conviction, now hovering above $116K. Volume’s decent, sentiment’s euphoric… but is this rally genuine markup, or a cleverly disguised distribution phase?
🔍 Price targets like $133K are seductive—but what if consolidation isn’t horizontal anymore?
Vertical consolidation is real. And it’s where retail gets baited hardest.
📊 Leg 2 might still play out—but don’t ignore the possibility that this is the final markup before a liquidity sweep.
👉 Where do you think the next stop is? 🧠 Is this a continuation—or a trap?
Drop your guess...
Who has entered here:?
Who can let the winners run in this situation:
#MJTrading #ATH
#Bitcoin #BTC #CryptoTrading #SmartMoney #MarketStructure #WyckoffMethod #LiquiditySweep #DistributionPhase #TechnicalAnalysis #TradingView #CryptoChart #PriceAction #EMA #Consolidation #CryptoStrategy #TrendReversal #CryptoCommunity
Bitcoin hits second target MacroBitcoin just hits second target, Volume is getting smaller, could indicate that buyers are weakening. We should keep an eye, maybe a corection is soon to be seen.
$BTC - Bitcoin Elliot Wave Analysis UpdateHello fellow gamblers,
Bitcoin hit my target zone and we could now see a retracement for Wave 4 or a bullish continuation into ATH.
I am also bringing a new update on Bitcoin and showing you all an alternative count that could take us way above our current targets.
- If we do have a Wave 4 retracement, I'm expecting price to find support at that 116.7k level.
- Levels to watch: 116.7k, 112k-110.4k

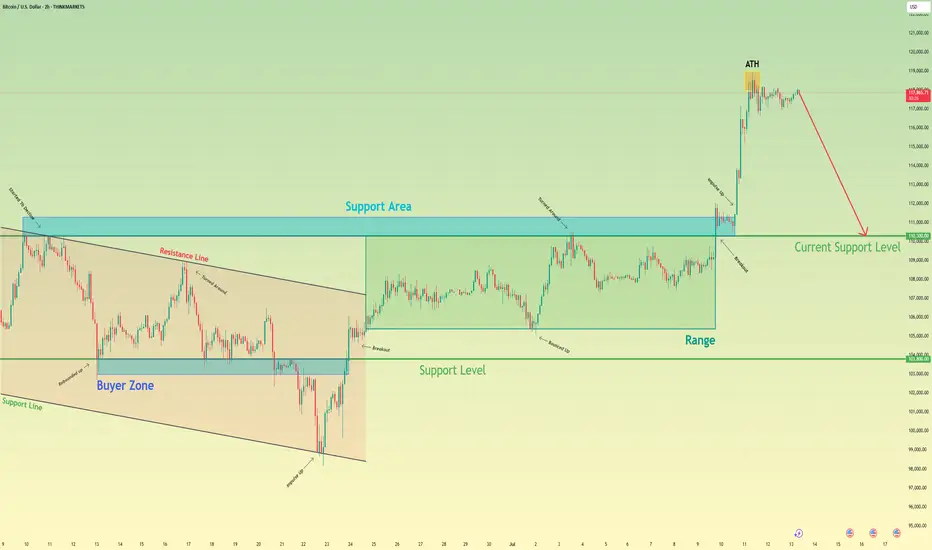
Bitcoin may make correction movement to support levelHello traders, I want share with you my opinion about Bitcoin. Price recently printed a new ATH at 118800 points and then began to show signs of correction. Before this breakout, the price was stuck in a long downward channel, where it bounced inside the buyer zone (103000–103800) several times and reversed upward. After the final breakout, BTC entered a range phase between the support level (103800) and the support area (110300–111300), building energy before the massive move. Once the price escaped this range, a strong impulse up followed, pushing BTC above all major levels and reaching a new high. However, after hitting the ATH, the price started to stall and consolidate. Currently, we can see signs of weakness at the top — the structure is forming lower highs and looks unstable, which may indicate a potential retracement. Now the price is trading above the support area, but I expect a corrective move back toward the current support level at 110300. This level aligns with the top of the previous range and now acts as strong demand. That’s why I’ve set my TP at 110300 level — right at the beginning of potential buyer interest. Please share this idea with your friends and click Boost 🚀
Disclaimer: As part of ThinkMarkets’ Influencer Program, I am sponsored to share and publish their charts in my analysis.
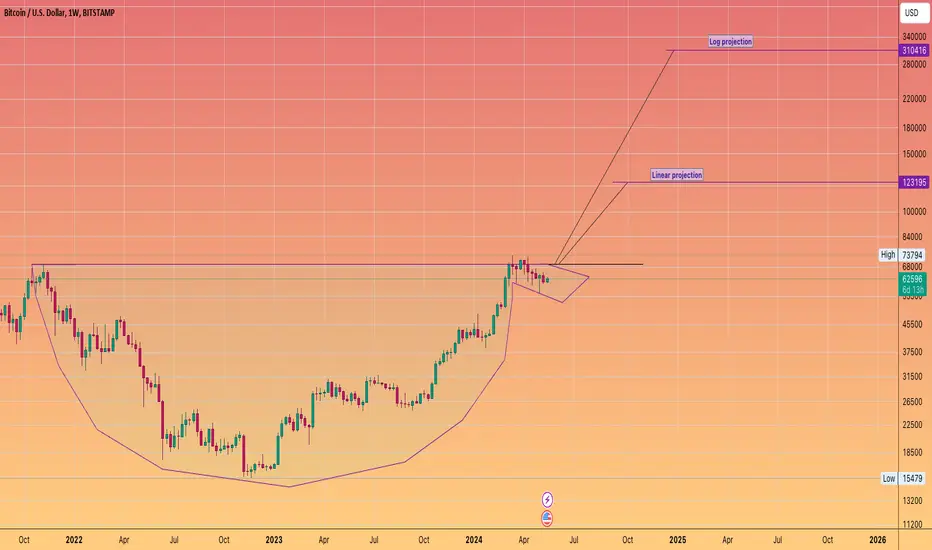
Balla is still Bullish on BITCOIN. Cup & Handle pattern. The trend is still our friend.
I still see bullish developments in the price action.
We must have patience.
Dips still must be bought.
The plan hasn't changed.
We still aiming for that time period of 9 -15 months post #BTC Halving.
We are only one month down :)
SellTrend Line Break
Previous Day Volume
Rejection Point
Untapped Order Point
London Session
High Structure Swing