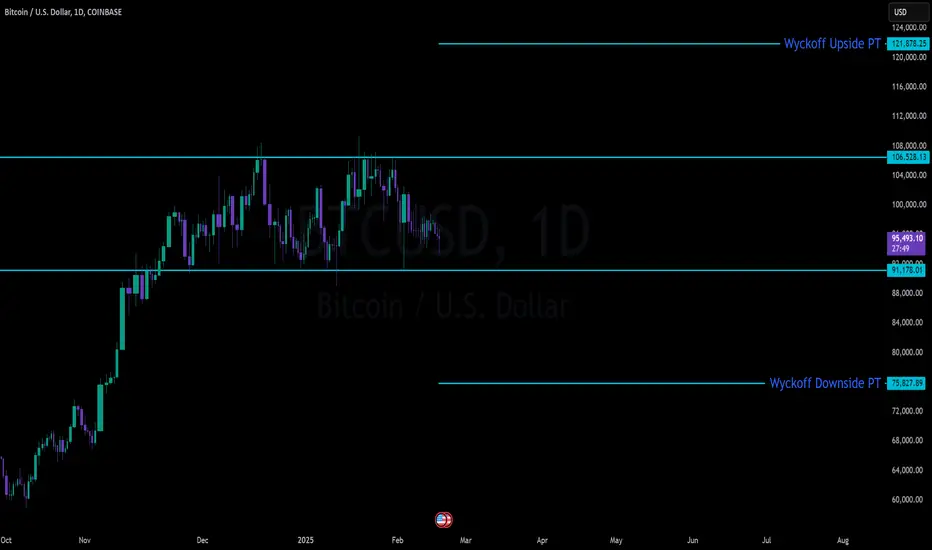
BTC Massive SetupConsolidation for months between 91k and 106k
- Classic Wyckoff setup as an accumulation/distribution
- Price targets of: 121.878 (122k is the popular target) to the upside with 75,827 on the down
- Saylor today put out news to be raising another $2 billion to buy BTC. Either he is going to be able to hold the floor or get washed out
- Trade can be taken with confirmation of breakout on either side pretty easily as momentum will be so strong that being on the wrong side will most likely be an immediate stop out
BTCUSD trade ideas
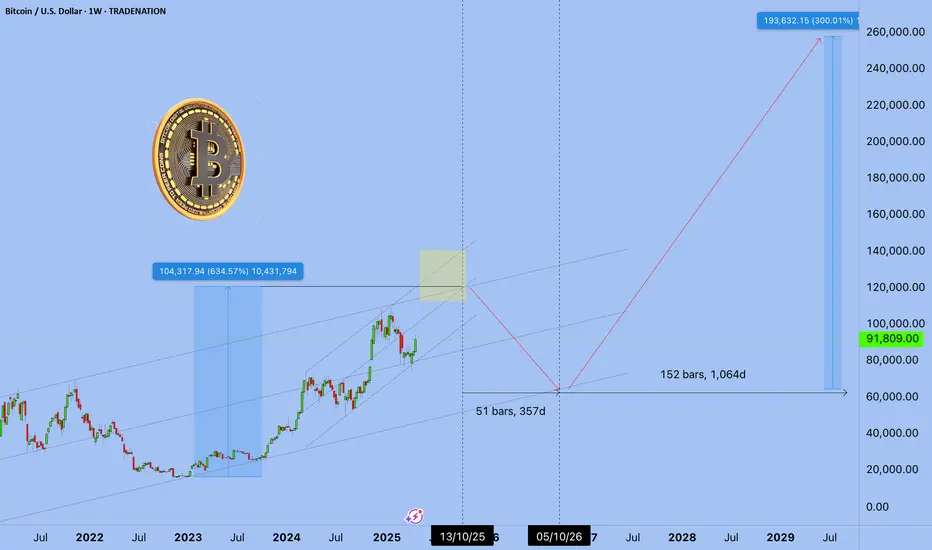
Bitcoin Price Prediction and TimelineThe Chart clearly shows everything. 100 days remain until the top. about 240000-260000
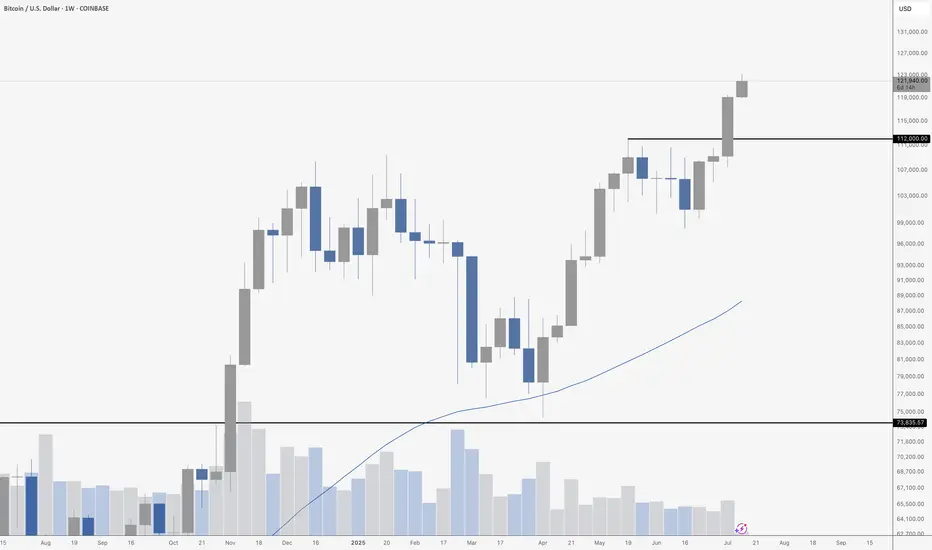
Bitcoin's Blue SkyBitcoin just closed another weekly candle near its highs – and this one confirmed what the last few were hinting at: the bulls are fully in charge. Price exploded through the \$112,000 resistance level, turned it into support, and barely looked back. The move wasn’t subtle either – it was loud, confident, and backed by a strong candle with virtually no upper wick. That tells you all you need to know: there’s no hesitation here, just buyers pushing price higher. If this were a poker game, Bitcoin just went all-in on momentum, and no one at the table seems brave enough to call its bluff.
Even more impressive is how clean the breakout structure looks. After consolidating under \$112K for weeks, BTC finally made its move, leaving behind a textbook support/resistance flip. As long as that zone holds, the path of least resistance is clearly up. There’s no major historical resistance overhead, which means we’re officially in price discovery – that magical place where technicals matter less and raw sentiment takes the wheel. The music is playing, and Bitcoin’s dancing like no one’s watching.
Volume has been quietly rising, even if it’s not screaming just yet. That’s a sign of real interest – not a frenzy, but sustained institutional nibbling and long-term conviction. The 50-week moving average is lagging far behind (hovering somewhere in the \$80K range), which tells you how strong this trend really is. That line’s not catching up anytime soon – it’s gasping for air while price is sprinting ahead.
Could we get a pullback? Sure. That’s always on the table. But unless BTC fumbles back below \$112K, the bulls aren’t just in control – they’re rewriting the rules. Next major psychological zones are \$125K, \$130K, and \$135K, and with each passing week, they’re looking less like distant targets and more like stepping stones. Buckle up.
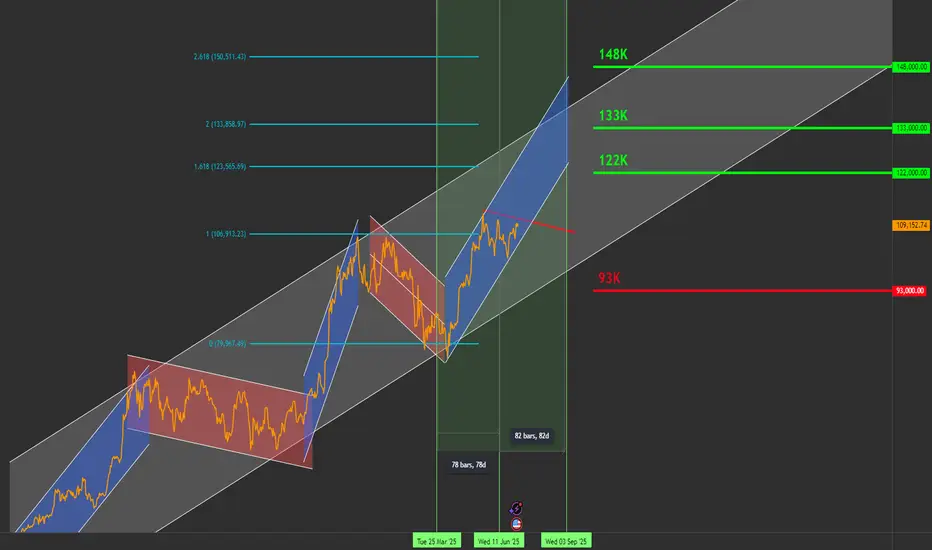
Bitcoin Roadmap to $144K by September – Daily Chart Breakout SetHello traders,
I'm sharing my current outlook on Bitcoin using the daily timeframe. Price is ~109K below a key descending trendline (in red), which has defined the structure since 21 May.
🔍 Key Levels to Watch:
Resistance: $111,000
Support: $91,000
Current Price: ~$109,000
⚡ Breakout Scenario:
If Bitcoin closes above $111K on the daily chart, backed by strong volume (ideally 30% above the 20-day average), I expect the next targets to unfold as:
✅ $122,000
✅ $133,000
✅ $144,000
🗓️ Target date for $144K: Around 22 September 2025
This projection is based on a pivot structure I’m tracking:
🟢 25 March 2025: Pivot low at ~$84K
🔴 12 June 2025: Pivot high
🟡 Expected pivot high: ~4 September 2025 (if symmetry holds)
This pattern suggests a 1-2-3 formation that could lead to a breakout move.
🧯 Failure Scenario:
If BTC fails to break out, I’m watching for a pullback toward the $91K support zone.
🛑 Current Stance:
I’m not in a position yet. Waiting for a daily candle close above $111K with volume confirmation and momentum indicators.
📣 Stay Updated
I’ll be sharing daily updates as the price action evolves.
Follow me here on TradingView, and feel free to share your analysis or ask questions in the comments!
🏷️ Hashtags:
#BTCUSD #BitcoinAnalysis #CryptoTrading #BTC #TechnicalAnalysis #SwingTrade #BreakoutSetup
Let me know your comments.
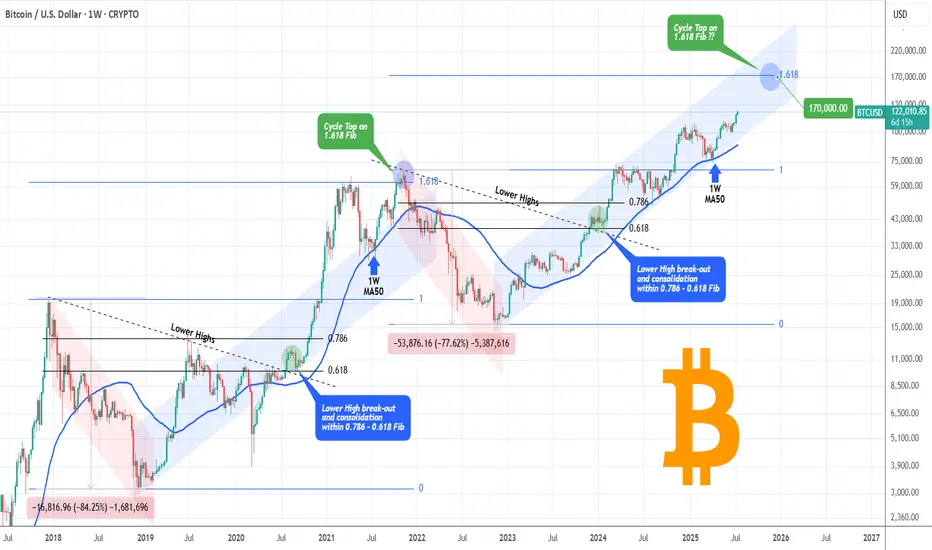
BITCOIN High after High going for the Cycle Top!Bitcoin (BTCUSD) made a new All Time High (ATH) today, just north of $123000 and shows absolutely no signs of stopping there!
The brilliantly structured 2.5-year Channel Up (blue) that has been dominating the entirety of the current Bull Cycle since the November 2022 market bottom, has been on its latest Bullish Leg since the April 07 2025 rebound on the 1W MA50 (blue trend-line).
The 1W MA50 has been the Cycle's natural Support level since the March 13 2023 bullish break-out, never broken after, just like it has been for the 2019 - 2021 Bull Cycle (excluding of course the Black Swan event of the March 2020 COVID crash).
In fact the similarities of the whole 2022 - 2025 Cycle are strong with the 2018 - 2021 Cycle. Similar Bear Cycles of -80% on average, followed by strong Lower Highs break-outs and subsequent consolidations within the 0.786 - 0.618 Fibonacci range, takes us to today with the April 2025 1W MA50 bounce resembling the July 2021 one.
Eventually, that Bullish Leg led to the Cycle's Top a little above the 1.618 Fibonacci extension. The market seems to be only one step away of completing that past pattern and if it does, BTC may hit $170000 before the Cycle peaks.
Do you think that is a likely scenario after today's new fresh ATH? Feel free to let us know in the comments section below!
-------------------------------------------------------------------------------
** Please LIKE 👍, FOLLOW ✅, SHARE 🙌 and COMMENT ✍ if you enjoy this idea! Also share your ideas and charts in the comments section below! This is best way to keep it relevant, support us, keep the content here free and allow the idea to reach as many people as possible. **
-------------------------------------------------------------------------------
💸💸💸💸💸💸
👇 👇 👇 👇 👇 👇
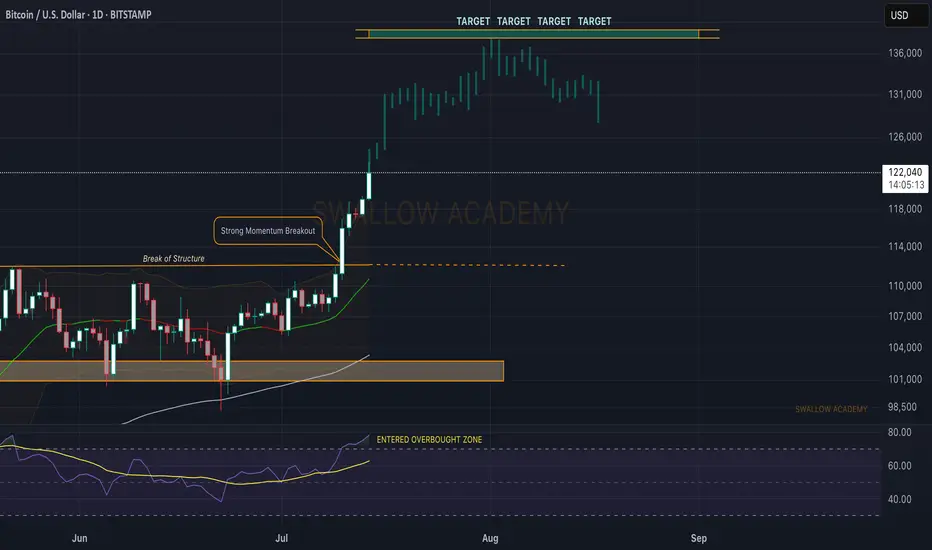
Bitcoin (BTC): Targeting $140K | Our ATH for This Bullish Cycle$120K was broken too easily, and we are now setting our new ATH to $140K, which will be our last target and local top before entering into a bearish market.
Now, as we recently had a strong break of structure that was not retested properly (meaning buyers have not secured this area), combined with the RSI being in the overbought zone, we might see some pullback happening anytime from here so keep an eye out for it.
About RSI, our yellow line is still in the neutral area, and we see the demand and buyside volume growing, so we are going to look for that line to also enter into overbought zones before looking for potential selloffs.
Swallow Academy
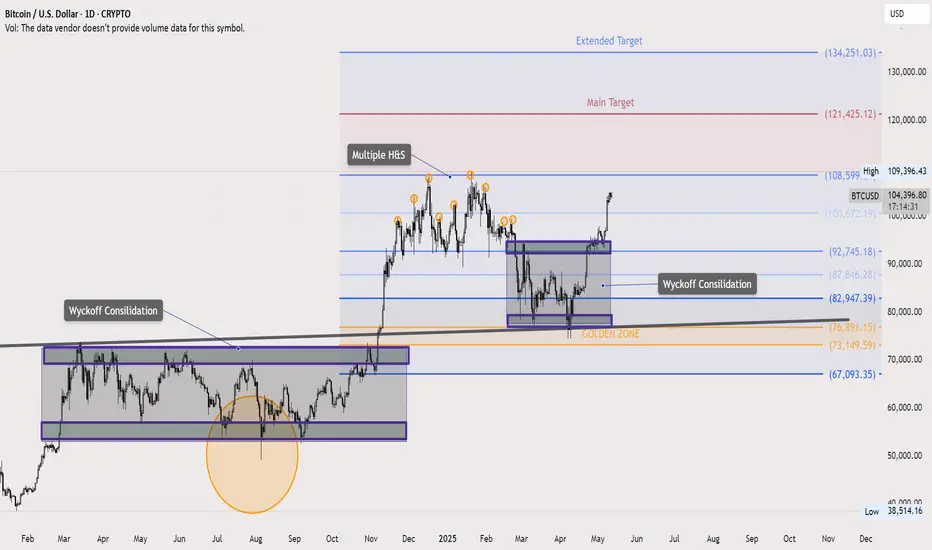
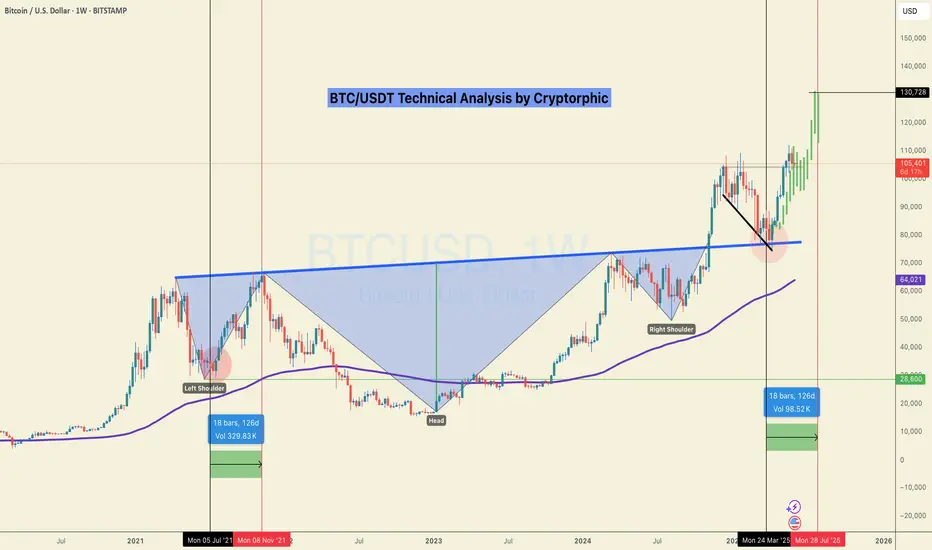
Rally! : My Target in Sight, and It’s Only a Matter of TimeInverted Head&Shouldres -- Breakout -- Double top -- Retest Neckline -- BOOM !!

Bitcoin Update – Textbook Patterns Playing OutIn last week’s Bitcoin idea, I highlighted a key technical setup: price retested the neckline of a massive inverted Head & Shoulders pattern and launched a strong move upward. Let’s dive into what’s unfolding on the daily chart.
We’re seeing classic Wyckoff consolidation behavior—appearing right before the breakout and again after the neckline retest. Multiple smaller Head & Shoulders patterns have also formed and hit their targets cleanly.
The Volunacci pattern came alive after a precise bounce from the Golden Zone, adding more fuel to the bullish narrative.
Next major level in focus: $120K. Will Bitcoin reach it? Let the market decide.
Are you falling for 141k?The bull run on BTCUSD was not sudden, it corrected properly making a flat from 98K and breaking out the structure. this upward impulse looks too sharp to peirce 120-122k range its 1.618 fib extension of the broken structure.
Be cautious with the sell though, any rejection followed by a bear flag could be a great short with Stop above the top.
Good luck.
Bitcoin - Bitcoin, Unrivaled in the Market!Bitcoin is above the EMA50 and EMA200 on the four-hour timeframe and is in its ascending channel. Bitcoin’s current upward momentum has the potential to reach the target of $130,000. If it corrects, Bitcoin buying opportunities can be sought from the specified demand zones.
It should be noted that there is a possibility of heavy fluctuations and shadows due to the movement of whales in the market and compliance with capital management in the cryptocurrency market will be more important. If the downward trend continues, we can buy within the demand area.
In recent days, Bitcoin has managed to set a new historical high by crossing the $118,000 level; a jump that followed the strong accumulation of institutional capital, the upward trend of spot ETFs and the remarkable consolidation of such indices. This growth is not only the result of technical conditions or short-term market excitement, but is a clear reflection of the structural maturity of the Bitcoin ecosystem in the second half of 2025. A careful and comprehensive examination of the fundamental parameters shows that Bitcoin is moving differently than in the past: slower, but with much stronger support. On the other hand, more than $205 million in Bitcoin short selling positions have been liquidated following the jump in the price of Bitcoin and its crossing the $122,000 level.
First, the flow of investment from Bitcoin spot ETFs has broken records over the past week. In one day, more than $1.18 billion entered these funds, and the total annual inflow of these financial instruments has reached more than $51 billion. This is while ETFs such as IBIT (managed by BlackRock) and FBTC (managed by Fidelity) are attracting hundreds of Bitcoins daily, without causing any negative divergence in price indices. This phenomenon clearly shows that the participation of institutional investors through regulated channels is not only stable, but also accelerating. Along with this flow of capital, the parameters of the chain also paint a picture of a market with a balance of supply and demand. The MVRV ratio, an indicator for measuring market profitability, fluctuates between 2.2 and 2.34, meaning that the market is in a reasonably profitable state, but is still some way from the warning zone of profit saturation. Meanwhile, long-term holders (LTHs) are also continuing to accumulate. Long-term wallet holdings have reached a record high of 14.7 million BTC, representing nearly 70% of the total supply. In the last quarter alone, more than 13,000 BTC have been added to this group’s reserves.
On the other hand, the SOPR indicator, which measures realized profit ratio, shows that profit-taking is taking place at a gentle slope in the market, away from heavy selling pressure. This logical trend of profit-taking is a testament to mature investor behavior. Bitcoin flows to exchanges are also at very low levels; Bitcoin held on exchanges now account for just 1.25% of the total supply—the lowest level in over a decade. This significant reduction in potential selling pressure has kept Bitcoin’s price stable in the face of short-term volatility.
Behaviorally, the market is also showing signs of maturation. The number of daily active addresses has remained stable, but unlike during the buying frenzy, we are no longer seeing retail traders rushing into exchanges or mass wallet outflows. In other words, on-chain activity has stabilized, similar to the behavior of traditional mature markets—markets driven by data and structure, not emotion. From a macro perspective, the outlook for Bitcoin in the medium term is also positive. Many analysts and institutions, including Global X ETFs, see Bitcoin’s growth to $200,000 within the next 12 months as achievable. Technical analysis from some sources has also outlined the $140,000 range as the next price target in the next 100 days, provided that the VIX volatility index remains low and macroeconomic data maintains its current trajectory. However, a more conservative scenario sees a price consolidation in the $95,000-$100,000 range if geopolitical pressures increase or ETF inflows weaken.
Overall, Bitcoin is moving ahead in the summer of 2025 not only on the back of crypto market excitement, but also on the back of strong fundamentals and structured institutional capital inflows. Accumulation by long-term holders, a steady decline in supply on exchanges, a reasonable profit-taking balance, and a formal investment structure via ETFs have all combined to bring the market to a stable state and ready for further increases. If this trend holds, levels of $125,000-$140,000 in the short term, and a range of $180,000-$200,000 by the end of the year, are not far off!
On the other hand, BlackRock’s Bitcoin ETF (IBIT) managed to record the fastest growth in history among all ETFs, surpassing $80 billion in assets in just 374 days! For comparison, it should be noted that the S&P500 Index ETF needed about 5 times this time! BlackRock now holds about 706,000 Bitcoins (equivalent to 56% of the total ETF share).
BTC CUP and HANDLE?BTC made triple top not it is making cup and handle pattern. If it successfully brakes the handle it might reach to 120-122K

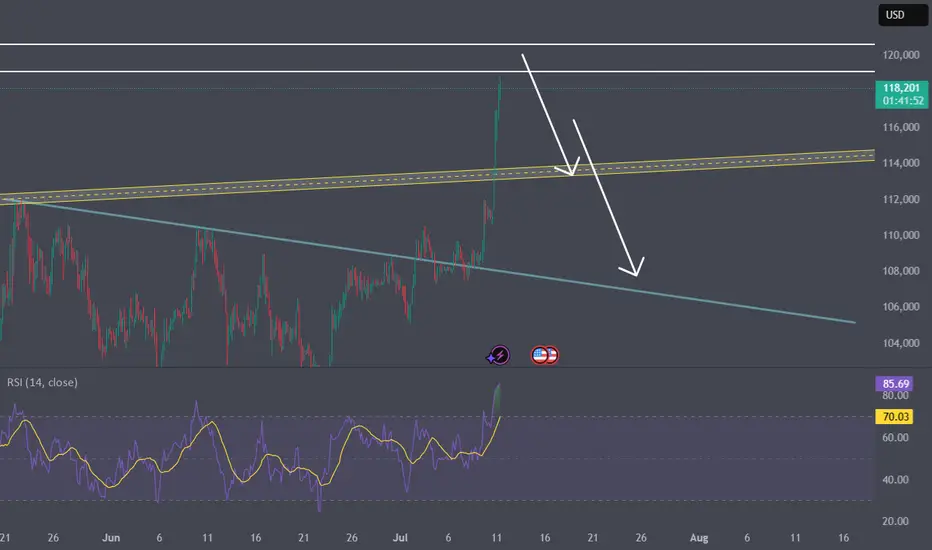
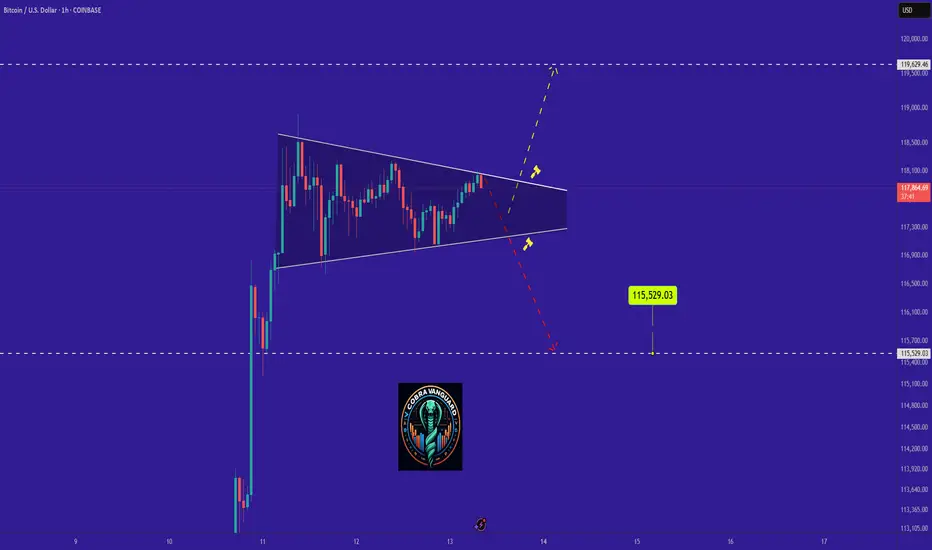
BITCOIN's Situation (1h) !!!The triangle pattern will break in the direction it is breached, and the price will move in that direction. In my opinion, the price could be corrective and may correct down to $115K.
BTC PRICE PROJECTION ANALYSIS. HOW MUCH FURTHER UPSIDE???In this video, I'm just excited to see the cup and handle analysis done on October 19th, 2024 reach it's target. It's amazing!
I decided to do some predictive analysis using Elliott wave concept and Fibonacci extensions to see how far Bitcoin will go.
I am convinced that on the timeframe analyzed, this is onto a wave 5 and so pullbacks are going to be a great opportunity to grab some while a lot people will think this is madness.
My cup and handle analysis and targets getting hit has taught me a great lesson to always look at the bigger picture while taking advantage of the micro view.
Cheer to all the longs and Bitcoin believers. With only 1.11 Million Bitcoin available for grabs and Institutional confidence behind the asset, I am confident the projected price targets are highly likely and in sight soon.

Bitcoin Hits First Target: What I Traded and What Comes NextBitcoin just hit my first target. I went long on BTC, XRP, Chainlink, and more. Booked profits and jumped into two new breakouts with better risk-reward. In this video, I break down my trades, the setup, and why I’m still bullish between 116K and 120K. I also explain how crypto deregulation and the Genius Act could fuel the next move.
Let me know in the comments how you traded this breakout.
This content is not directed to residents of the EU or UK. Any opinions, news, research, analyses, prices or other information contained on this website is provided as general market commentary and does not constitute investment advice. ThinkMarkets will not accept liability for any loss or damage including, without limitation, to any loss of profit which may arise directly or indirectly from use of or reliance on such information.

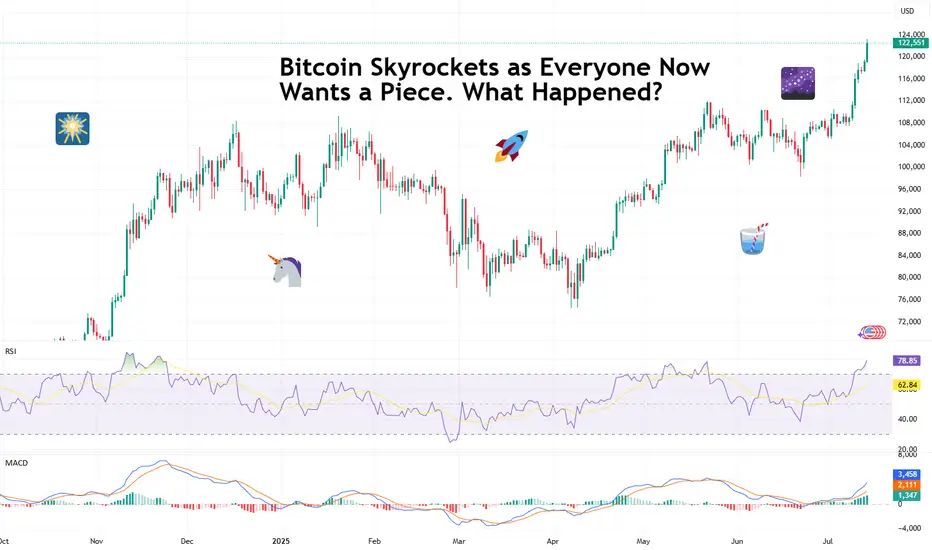
Bitcoin Skyrockets as Everyone Now Wants a Piece. What Happened?If you took a few days off last week and went to get coffee this morning, you likely missed Bitcoin torching its all-time high and soaring into the uncharted.
The world’s most popular digital asset took off in an unstoppable rocket ride, smashing records so fast that even the always-wired-in day traders couldn’t keep up.
Bitcoin BITSTAMP:BTCUSD blasted through $122,000 Monday morning after gobbling up sell walls at $120,000 and $121,000 in less than one hour. That’s not a typo.
That’s an actual snapshot of what happens when you mix onchain whale movements, fresh institutional FOMO, and traders rediscovering their appetite for risk. Billions upon billions swirled up and Bitcoin passed $2.3 trillion in market cap (ref: our Crypto Heatmap ).
🙌 Bow Down Before the King
Bitcoin has officially reminded every altcoin who wears the crown when markets go haywire. While some tiny tokens get to pump 100% on hype alone, Bitcoin does it with the weight of its market cap behind it — which now surpasses the GDP of entire countries.
Its dominance share has climbed back above 64%, a level we haven’t seen since the last time crypto Twitter argued whether “flippening” would happen by next Thursday (spoiler: it didn’t, and we mean 2021). And right now, all eyes are pinned on that round, meme-ready milestone: $125,000 or even $150,000.
Why these levels? Because traders love round numbers. They’re clean, symbolic, and if that next ceiling shatters, the chain reaction of liquidated shorts and new leveraged longs can turn an orderly bull run into pure market mayhem.
📈 Institutional Hoarding: The Secret Fuel
If you think this is just retail traders YOLO’ing in from their parents’ basement, think again. Onchain data showed earlier this month that this moon mission was being quietly underwritten by the big boys — institutional funds, overflowing Bitcoin ETFs , and corporate treasuries that once scoffed at Bitcoin as “magic internet money.”
Does this mean Bitcoin is becoming boring? Not quite. It means the foundation for this rally is sturdier than the TikTok-fueled moonshots of yesteryear. Think steady inflows, regulated vehicles, and balance sheets that no longer flinch when they see “digital assets” on a line item.
👀 So, Why Now?
Bitcoin doesn’t need much of a reason to get volatile — you know that. But a few more stars than usual aligned to give this surge its lift-off moment.
First, the macro backdrop: US inflation is at 2.4% (next ECONOMICS:USCPI report coming Wednesday, pay attention to the Economic Calendar ), which makes a Fed rate cut more likely later this year.
Lower rates mean cheaper dollars, weaker bond yields, and renewed appetite for risk assets. Oh, and don’t forget about gold OANDA:XAUUSD — the OG “no yield, no problem” hedge.
Second, corporate treasuries are all-in on Bitcoin again. If Michael Saylor’s Strategy NASDAQ:MSTR (formerly MicroStrategy — we all know what business they’re really in) keeps adding coins and onboarding new public companies like GameStop NYSE:GME , you know the institutions smell long-term value. Add Trump’s full-throated crypto endorsement and you’ve got a narrative tailwind no trader wants to miss.
🥂 Record Highs Everywhere — COINcidence?
Now let’s go back to those aligning stars. Bitcoin’s fresh all-time high didn’t happen in a vacuum. The S&P 500 SP:SPX , the Nasdaq Composite NASDAQ:IXIC , and Nvidia NASDAQ:NVDA — the world’s most expensive company — all clocked record closing highs last week.
So, is this a “rising tide lifts all boats” moment? Or are we partying on borrowed time? Equities are riding a wave of hope that the Fed will start easing soon, and any whiff of a rate cut is pure oxygen for risk assets.
But seasoned traders know that record highs can sometimes be the most dangerous places to FOMO in. Ask anyone who went all-in on dot-com stocks in 1999.
🏹 Eyes on the Big 120K — Will It Hold the Line?
Short-term, the $120,000 milestone is the line in the sand everyone’s watching. Break it decisively, see if it holds above it for a week or so, and the floodgates of speculative capital might open for another leg higher. Stall out below it? You could see a healthy round of profit-taking and some bruised egos during quiet dinners.
Macro factors will loom large: the Fed’s policy meeting, surprise tariff talks from the White House, or an unexpected bout of inflation could swing sentiment overnight. But for now, the mood is simple: bullish, frothy, and more than a little bit greedy.
💭 Final Take: From Moonshots to Maturity?
The shift from whales to suits means fewer wild swings but steadier institutional demand. The days of “Lambo tomorrow” might be giving way to “slow grind higher for the next 5 years.” For the retirement portfolio, that’s not the worst outcome.
For the traders who crave the adrenaline, there’s still plenty of room to catch the waves — just don’t expect them to come as easily or as frequently as they did in the wild west days.
📢 Your Turn: Moon or Swoon?
Over to you: is Bitcoin ready to break out above $125,000 and send shorts scrambling for cover? Or is this just another overbought stall before a healthy pullback?
Either way, grab your popcorn — and your stop-loss — because if there’s one thing crypto never does, it’s sit still for long. Drop your hot take below — and may your diamond hands be stronger than your coffee.
Key Insights: Financial Markets Transformation by 2030For years, this page has been my space to share in-depth market research and personal insights into key financial trends. This post reflects my perspective — a strategic outlook on where I believe the digital finance industry is heading.
The financial world is evolving at an unprecedented pace, and it's easy to overlook subtle shifts. But the undeniable fact is that we are now standing at the intersection of three powerful industries — financial markets, blockchain, and artificial intelligence. We are positioned at the cutting edge of technology, where innovation is not a future concept but a present reality.
This post serves as a reference point for future trends and a guide to understanding the transformative forces shaping financial markets by 2030. These are not just facts, but my vision of the opportunities and challenges ahead in this rapidly converging digital ecosystem. Staying ahead today means more than following the market — it means recognizing that we are part of a technological shift redefining the core of global finance.
📈 1. Electronic Trading Evolution
Full transition from traditional trading floors to AI-driven digital platforms.
Integration of blockchain and smart contracts ensures transparency, automation, and risk reduction.
Real-time data analytics democratizes market access and enhances strategic decision-making.
🤖 2. Algorithmic Trading Growth
Accelerated by AI, machine learning, and big data analytics.
High-frequency trading (HFT) boosts efficiency but introduces new volatility factors.
Adaptive algorithms dynamically adjust strategies in real time.
Strong focus on regulatory compliance and ethical standards.
🔗 3. Tokenization of Real World Assets (RWA)
Transforming asset management with projected growth to $18.9 trillion by 2033. (now 18.85B)
Enhances liquidity, accessibility, and transparency via blockchain.
Institutional adoption is driving mainstream acceptance.
Evolving regulations (DLT Act, MiCA) support secure tokenized ecosystems.
🏦 4. Institutional Adoption & Regulatory Frameworks
Digitalization of fixed income markets and exponential growth in institutional DeFi participation.
Key drivers: compliance, custody solutions, and advanced infrastructure.
Global regulatory harmonization and smart contract-based compliance automation are reshaping governance.
💳 5. Embedded Finance & Smart Connectivity
Embedded finance market to hit $7.2 trillion by 2030.
Seamless integration of financial services into everyday platforms (e-commerce, mobility, etc.).
AI, blockchain, and IoT power real-time, personalized financial ecosystems.
Smart contracts reduce operational friction and enhance user experience.
🛡 6. Financial Crime Risk Management
Market expected to reach $30.28 billion by 2030.
AI-driven threat detection and anomaly monitoring strengthen AML compliance.
Blockchain ensures data integrity and automates cross-border regulatory adherence.
Global collaboration (FATF, EU AML) fortifies defenses against evolving financial crimes.
🌍 7. Consumer Behavior & Financial Inclusion
Digital banking bridges the gap for underbanked populations, especially in emerging markets.
Mobile solutions like M-Pesa revolutionize access to financial services.
Biometrics, microfinance, and AI-powered engagement tools foster inclusive economic participation.
🚀 Conclusion
By 2030, financial markets will be defined by technology-driven efficiency, regulatory adaptability, and inclusive growth.
Success will favor those who embrace innovation, leverage automation, and engage in cross-sector collaboration.
The future belongs to agile stakeholders navigating a landscape shaped by AI, blockchain, tokenization, and smart finance connectivity.
Best regards, EXCAVO
_____________________
Disclosure: I am part of Trade Nation's Influencer program and receive a monthly fee for using their TradingView charts in my analysis.
#BTC/USDT It's not over yet! Eying at 130K +ALTCOIN CHEAT SHEET!The last time I shared this chart was on April 14th, when Bitcoin was trading around $84,000 — right when panic was setting in across the market.
The message back then was simple: don’t panic, it’s just a retest.
And here we are again, revisiting the same sentiment with a new chart!
There are a lot of “double top” charts circulating in the space right now, but let me be clear: it’s not over yet.
Before jumping to conclusions, go through this chart and analysis to understand the full picture.
Bitcoin closed the week at $105,705 — certainly higher than most expected just a few days ago.
This marks the first red weekly candle after seven consecutive green closes, which is normal in the context of a healthy uptrend. We're still midway toward the broader target, so there’s no reason to panic or shift into disbelief.
Yes, we may see further corrections in BTC over the coming days or week, potentially down to $98K, and in a less likely scenario, even $ 92K. But this time, Ethereum is showing signs of strength and is likely to outperform Bitcoin, creating high-quality entry opportunities across the altcoin market. In other words, this phase is not a threat, it's an opportunity. BTC is still destined to hit $130k+ as per charts and other important metrics.
Here’s a typical market structure and reaction flow to help put things in perspective:
1. Bitcoin rallies — Altcoins underperform or get suppressed due to capital rotation into BTC.
2. Bitcoin corrects — Altcoins correct further as fear increases and dominance rises.
3. Bitcoin stabilises — Ethereum begins to gain strength, often leading the altcoin recovery.
4. ETH/BTC ratio increases — Ethereum holds up better while many altcoins continue to lag.
5. Bitcoin breaks ATH — This triggers a gradual recovery in altcoins.
6. BTC dominance peaks — Altcoins start gaining serious momentum.
7. Capital rotates from BTC and ETH into altcoins — Sectors tied to the current narrative (like meme coins this cycle, and Metaverse/NFTs in the last one) begin to lead.
8. Altcoin season begins — Utility and mid-cap tokens follow, often delivering strong returns in the final phase.
This pattern has repeated across cycles. Currently, we appear to be in the transition between Bitcoin stabilising and Ethereum gaining dominance — typically the stage that precedes a strong altcoin rally.
Now is not the time to assume the move is over. Stay objective, monitor capital rotation closely, and prepare for what comes next.
If your views resonate with mine, or if this post adds any value to you, please boost with a like and share your views in the comments.
Thank you
#PEACE
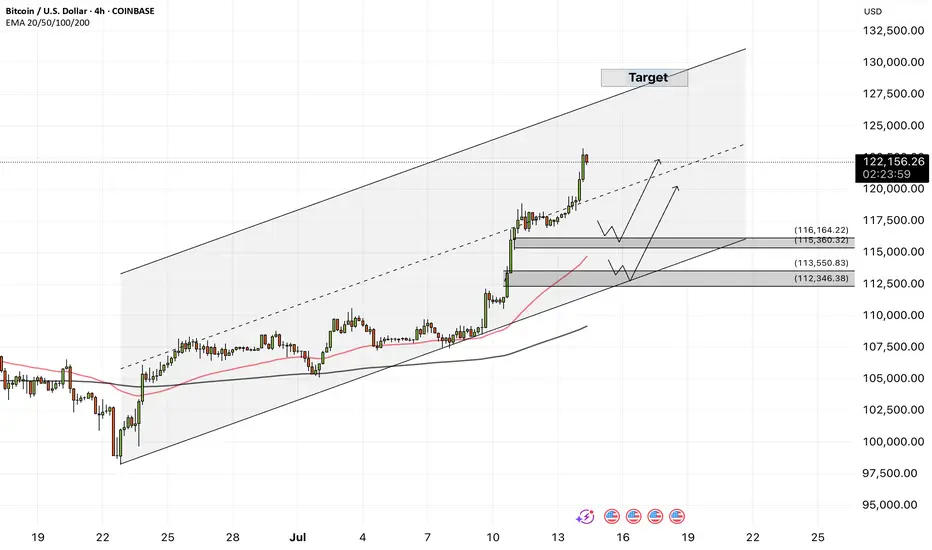
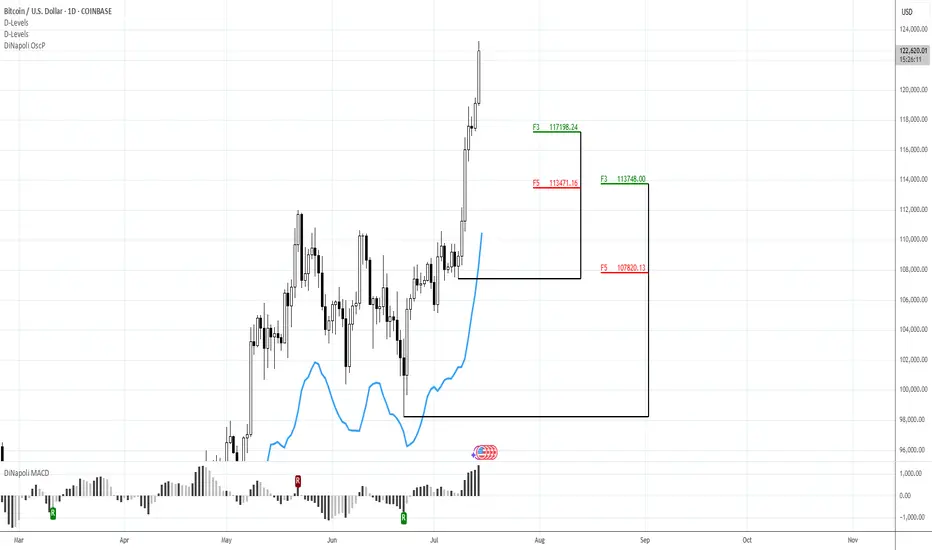
127KMorning folks,
So, BTC shows even better performance that we thought, although it obviously something stands behind, this is not market-natural motion. Anyway, we consider 127K level as all-time nearest target that stands on monthly chart.
If any pullback starts (BTC now is at daily overbought and near Yearly Resistance Pivot), we keep an eye on 117.2K and 113.5K levels to decide on long entry
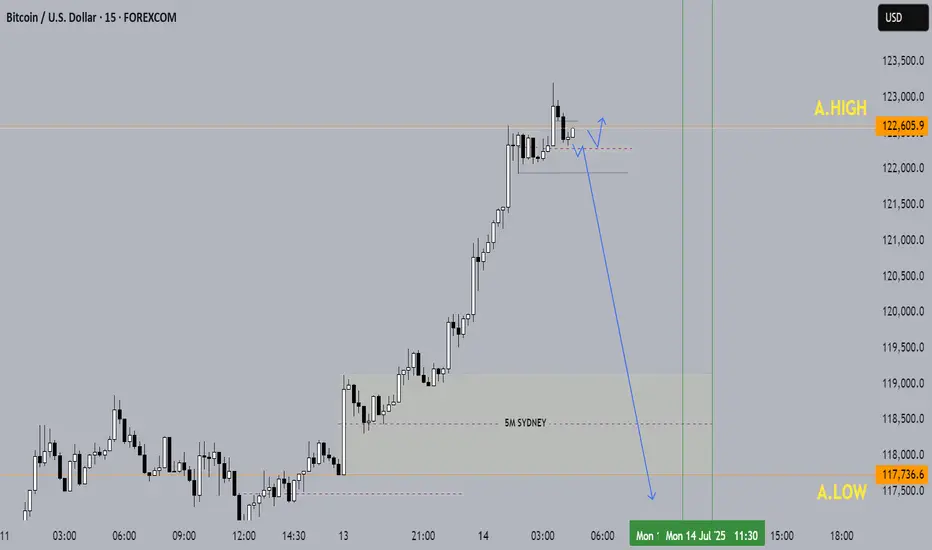
BTUUSD ASIAN HIGH/LOW LIQUIDITY PURGESweeps often happen early in the London session
Price reverses back inside the range or moves strongly in opposite direction.
Next stop 125 can we go to 145 k?This channel is not providing individualized trading or investment advice, nor is it a banking service, brokerage service, trading service, investment service or money management service

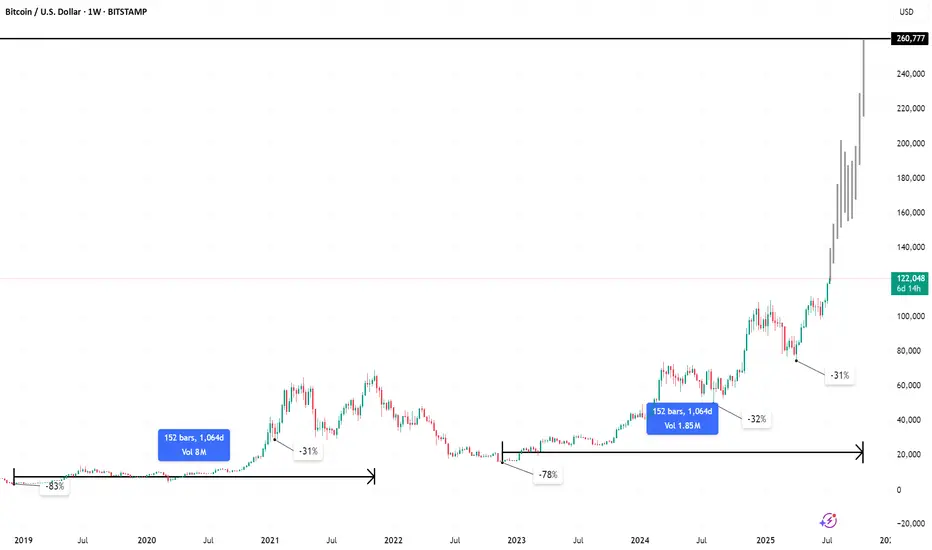
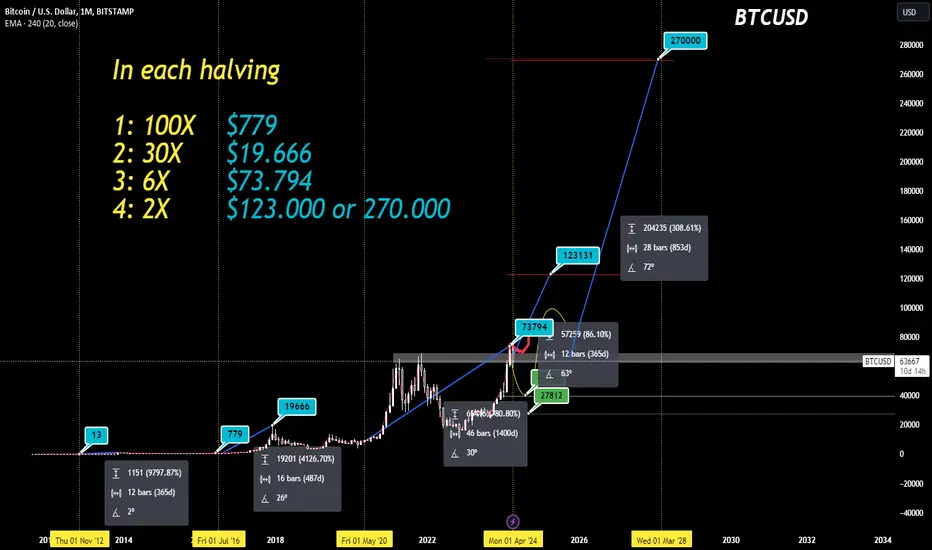
BTC: Next price Halving 📊Analysis by AhmadArz: #BTCUSD
By calculating the price growth in the 4-year halving time frame, we came to the conclusion that with the growth of the Bitcoin market cap, its growth will be halved and we can expect $120,000 from Bitcoin, and it is expected to grow up to 270,000 dollars in halvings.
🔗"Uncover new opportunities in the world of cryptocurrencies with AhmadArz.
💡Join us on TradingView and expand your investment knowledge with our five years of experience in financial markets."
🚀Please boost and💬 comment to share your thoughts with us!
watch the laws, not just the charts.stablecoins were once the rebels of finance—anchored to fiat yet untethered from traditional banking laws, but the tides are turning. Across major economies, lawmakers are drawing up legal frameworks that place stablecoins inside the banking sector rather than outside of it. This shift could be the most pivotal regulatory development since Bitcoin was born.
But what does this really mean for traders, investors, and markets?
In this @TradingView blog we’ll unpack the new laws on stablecoins entering the banking realm, and what their ripple effect might look like, using past regulatory shifts as a lens to foresee market behavior.
🧾 Section 1: What the New Stablecoin Laws Say
Many regions—especially the EU, UK, Japan, and the US—are moving toward a model where stablecoin issuers must register as banks or hold full banking licenses, or at minimum, comply with banking-like oversight.
Key pillars of these laws include:
Full reserve requirements (1:1 backing in liquid assets)
Audited transparency on reserves and redemptions
KYC/AML compliance for users and issuers
Supervision by central banks or financial regulators
In the US, the House Financial Services Committee recently advanced a bill that would make the Fed the ultimate overseer of dollar-backed stablecoins.
In the EU, MiCA (Markets in Crypto-Assets) requires issuers of e-money tokens to be regulated financial institutions.
Japan now allows banks and trust companies to issue stablecoins under strict regulations.
💥 Section 2: Why This Is a Big Deal
Bringing stablecoins into the banking system could change how liquidity flows, how DeFi operates, and how capital moves across borders.
Potential market impacts:
Increased trust = more institutional money entering stablecoins and crypto markets.
DeFi restrictions = protocols may face scrutiny if they allow unverified stablecoin usage.
Flight from algorithmic or offshore stables to regulated, bank-issued stablecoins (e.g., USDC, PYUSD).
On-chain surveillance increases, potentially limiting pseudonymous finance.
Think of it as crypto’s "Too Big To Ignore" moment—where stablecoins become infrastructure, not outlaws.
📉 Section 3: Past Laws That Shaped Crypto Markets
Let’s examine how previous regulations have affected crypto markets—offering clues about what to expect.
🧱 1. China’s Crypto Ban (2017–2021)
Kicked off a massive market crash in 2018.
Pushed mining and trading activity overseas, especially to the US and Southeast Asia.
Resulted in more global decentralization, ironically strengthening Bitcoin’s resilience.
🪙 2. SEC Lawsuits Against XRP & ICO Projects
Ripple’s XRP lawsuit caused delistings and volatility.
Set a precedent for how tokens are treated under securities law.
Resulted in more structured token launches (via SAFEs, Reg D, etc.).
🧮 3. MiCA Regulation in Europe (2023 Onward)
Provided regulatory clarity, prompting institutions to engage more with regulated entities.
Boosted legitimacy of Euro-backed stablecoins like EURS and Circle’s Euro Coin.
Sparked a race among exchanges to gain EU registration (e.g., Binance France, Coinbase Ireland).
Each of these regulatory waves caused temporary volatility, followed by long-term growth—as clarity invited capital.
📊 Section 4: The Possible Scenarios for the Market
Here’s how things might play out as stablecoin laws become mainstream:
Golden Path-Regulated stablecoins coexist with DeFi; innovation meets compliance - Bullish for crypto adoption and capital inflows.
Walled Garden-Only bank-issued stablecoins are allowed; DeFi stifled -Neutral or bearish short-term, bullish long-term.
Backlash-Overregulation pushes stables offshore or into non-compliant zones - Bearish, liquidity fragmentation returns.
🔍 Nerdy Conclusion:
Stablecoins are no longer just tools for traders—they’re becoming the backbone of digital finance. Their formal entrance into banking law marks a turning point that traders must understand.
While regulation has historically caused short-term fear, it often leads to long-term maturity in crypto markets. The stablecoin laws now in motion could unlock the next chapter of institutional adoption, cross-border finance, and perhaps, the integration of crypto into the real-world economy at scale.
💡 Nerdy Thought:
When a technology becomes systemically important, it stops being ignored—it gets integrated. Stablecoins have reached that level.
put together by : @currencynerd as Pako Phutietsile
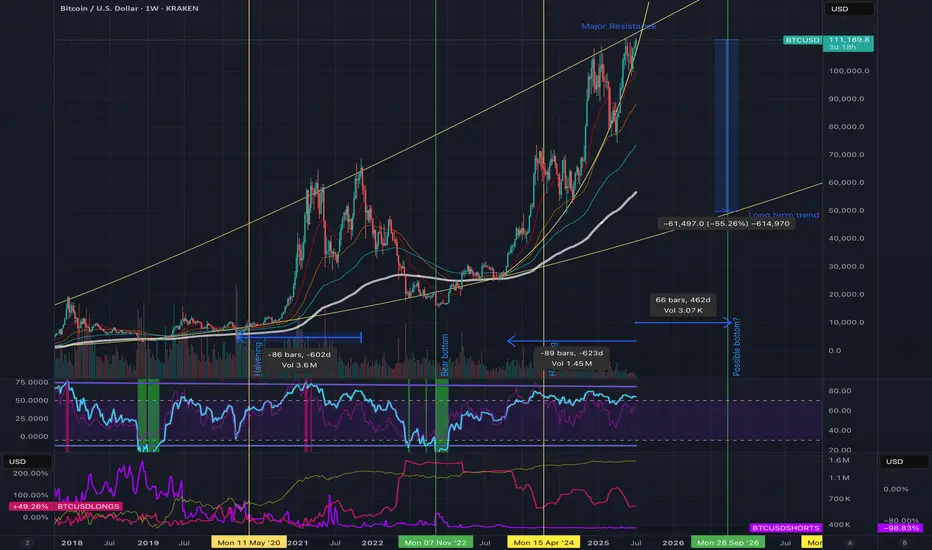
End in sight, Bull run near complete, don't be fooled. Bitcoin has experienced an incredible surge, rising from $15,000 to over $111,000 in this bull cycle so far. I expect the market peak to be around $114,000 to $115,000, with historical trends indicating strong resistance at these levels. As a long-term Bitcoin bull who has navigated through multiple cycles, I see several indicators suggesting we might be nearing a market top.
Firstly, this bull run has lasted 623 days, with only 462 days remaining until the predicted next cycle bottom. This could lead to a significant correction in the short term, potentially dropping prices by at least 50% down to below $40,000. Additionally, trading volume is declining; although exchange volume is decreasing, the number of trades per day is also dwindling. This means there’s less buying and selling pressure in the market. If this trend shifts to more selling pressure amidst such low volume, we could see a rapid decline. This scenario seems to align with what market whales may be anticipating.
MicroStrategy (MSTR) is certainly supporting the market, along with new institutional investors. However, we have yet to fully assess the impact of tariffs and other economic factors, which could result in fewer people willing to invest, especially in high-risk markets.
The Net Unrealized Profit/Loss (NUPL) has been high, remaining above 66 since March 2024, which also suggests that a correction is due, as many holders are currently in profit. Although institutional investment has been steadily increasing, we are now observing a plateau in the Accumulation/Ddistribution chart. The number of BTC long positions is decreasing, while shorts remain very low, indicating a lack of confidence that Bitcoin will rise significantly higher. This low interest in both longs and shorts suggests that market pressure could shift soon.
ETF inflows have remained stable, but profit-taking is likely to occur as investors seek to increase their positions in the bear market. While we all love Bitcoin and want the rally to continue, it's crucial to remember that a bear market will eventually happen, along with the next halving—it's just a matter of timing.
Looking at the charts, if anything signifies a market top more than “Laser Eyes,” it could very well be Trump coin. We might see another upward push, but history has shown that if everyone expects a massive rally in September or the fourth quarter, the opposite usually occurs; we end up buying the rumor and selling the news.
Safe trading, everyone! I remain a staunch Bitcoin bull, but I recognize that all good things must eventually come to an end and the next cycle will be so exciting, so make sure youe have the reserves to invest in the bear!