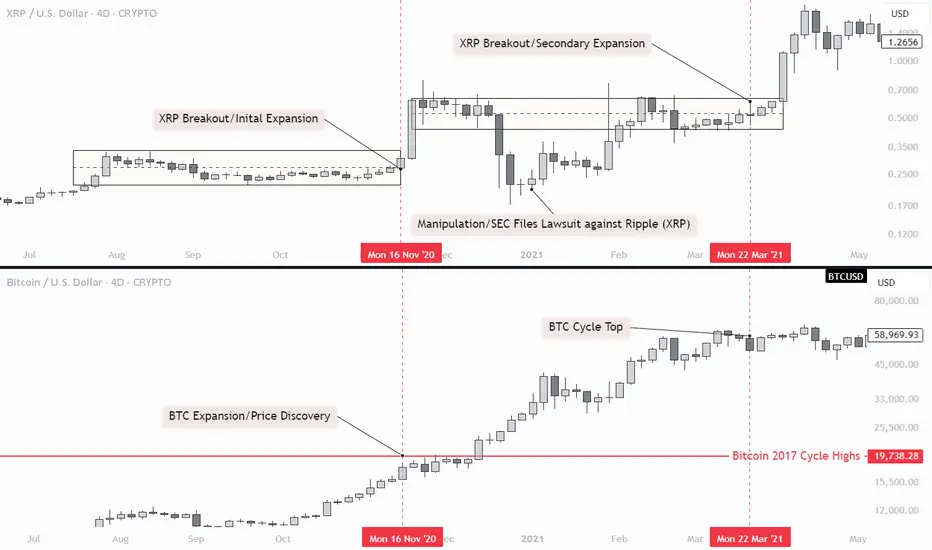
2021 - XRP Two MovesXRP typically moves twice during the cycle: once when BTC breaks its previous cycle highs, and again when BTC tops out at the end of the cycle. These moves often occur in waves of equal length within a 365-day window.
BTCUSD trade ideas
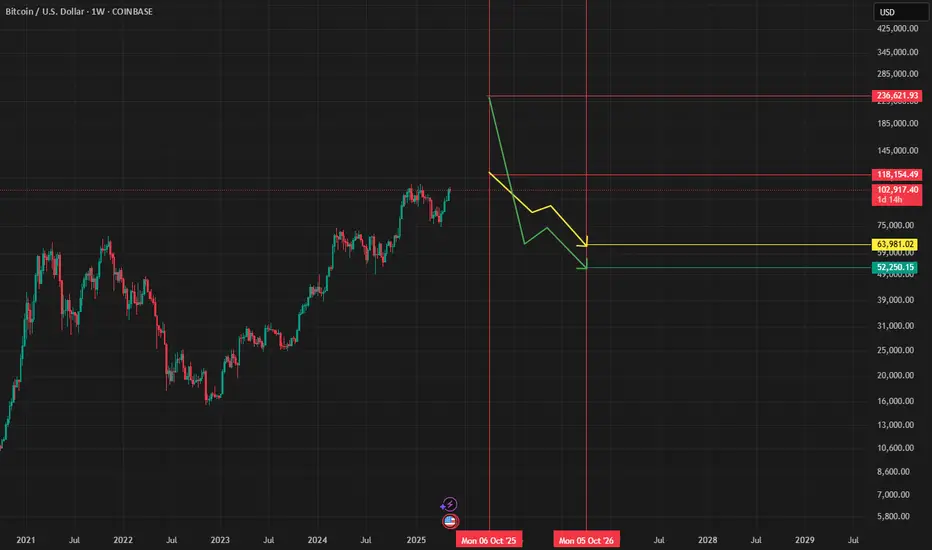
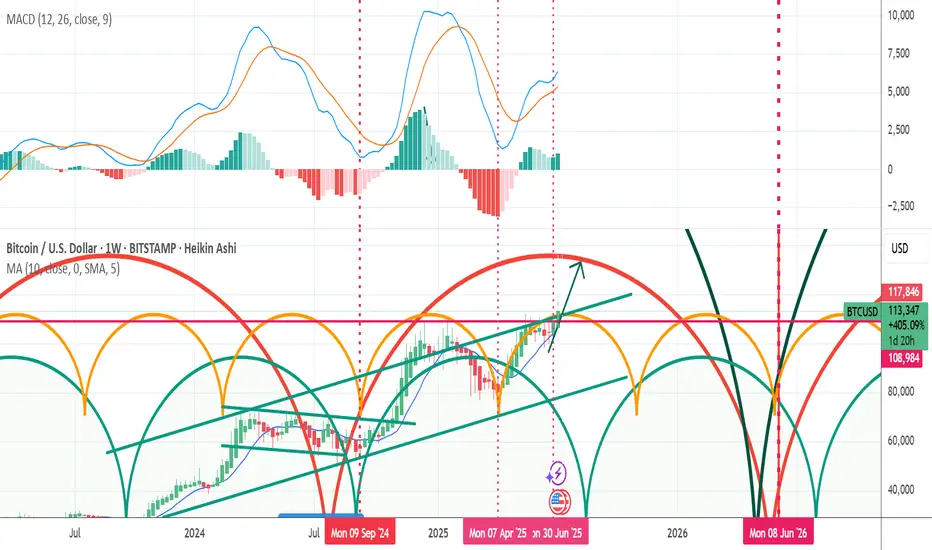
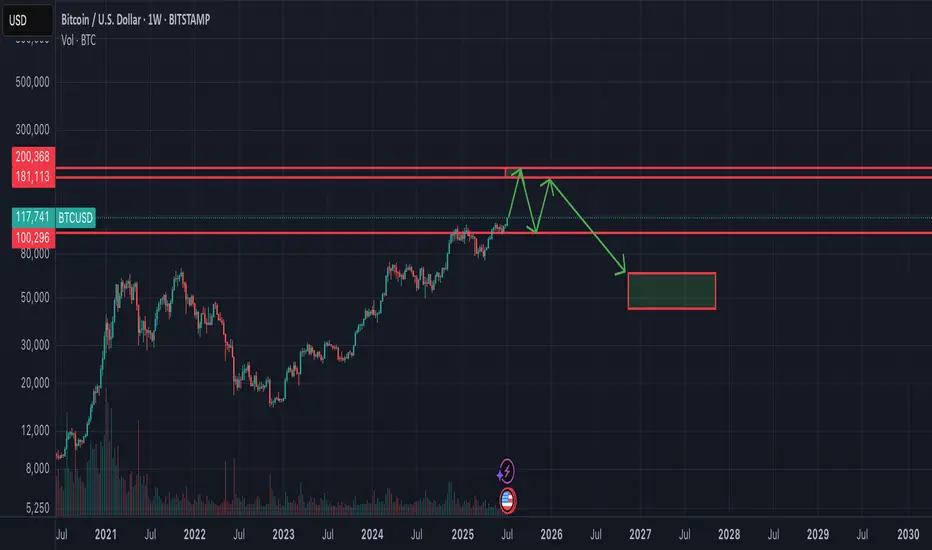
Two scenarios for Bitcoin's pathTwo scenarios for Bitcoin's path from October 2025 to October 2026: Growth to 118,000 and then a drop to 63-64,000 or growth to 236,000 and then a drop to 52,000. I currently give less weight to the second scenario. But the time frame in both scenarios is the same.
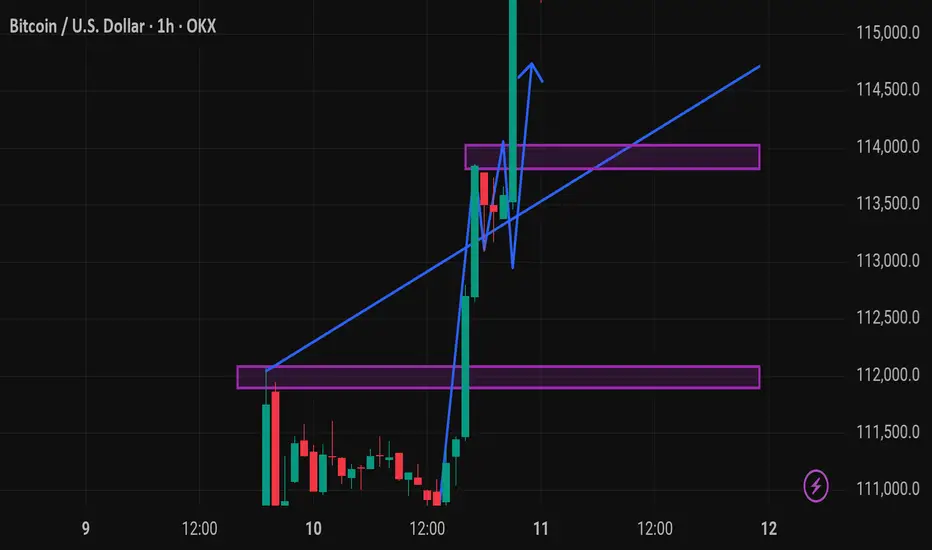
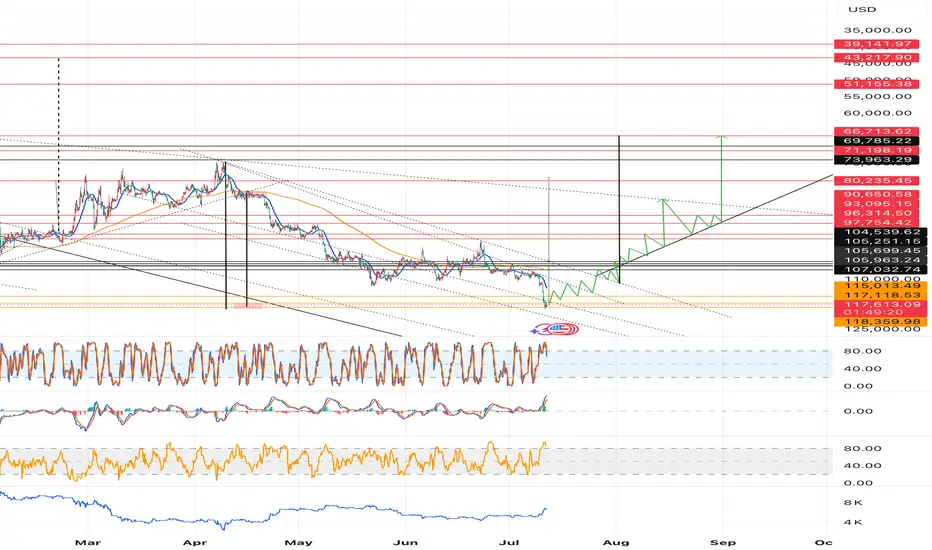
[VNFORECASTER][BTCUSD] Forecast the price action of BTCUSD Forecast the price action of BTCUSD on July 12, 2025
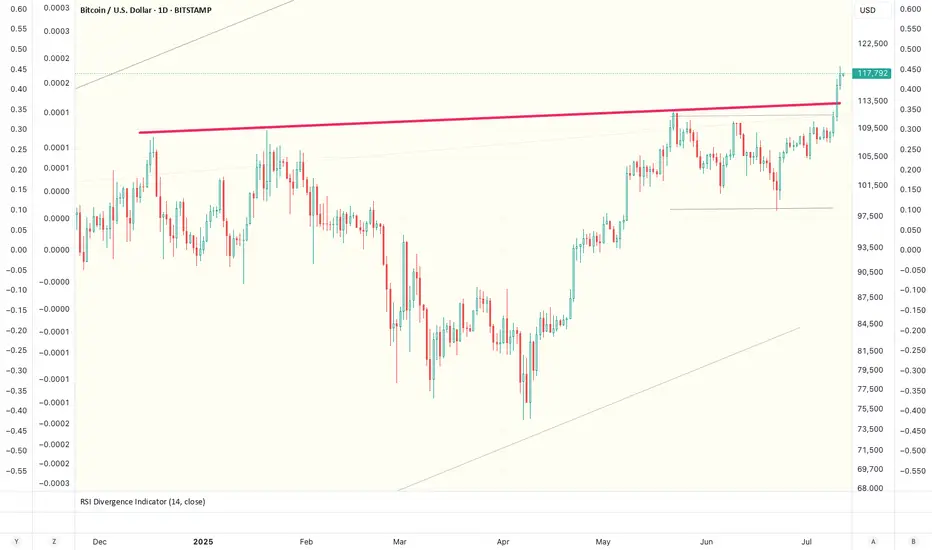
The price continue to move up about next 3-5 weeks
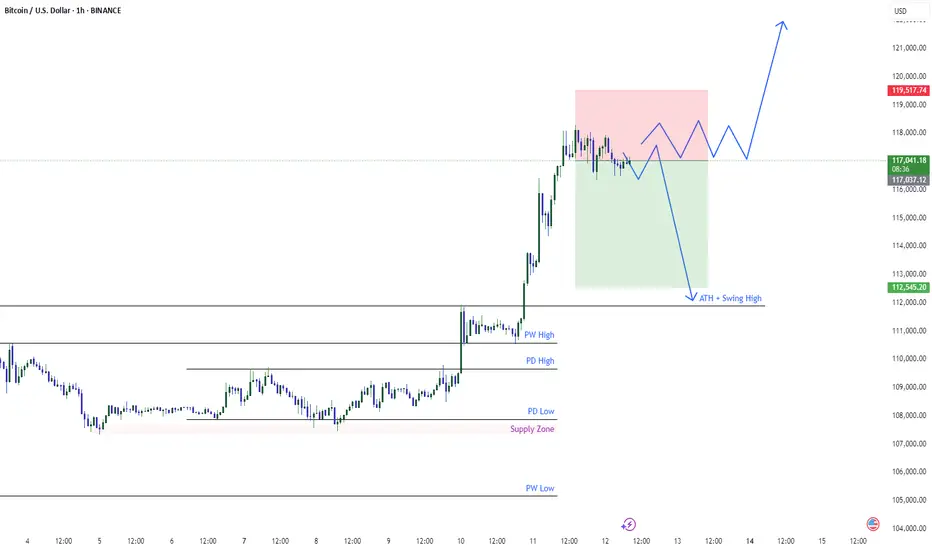
BTC Touching Heights !BTC Extremely bullish. BTC analysis shows that it touch supply zone of 107500 and later went to cross the day before previous day high which was residing on 109,684 and then swept previous week high which was 110,600 with strong buying. It hinted crossing the all time high. After crossing all time high of 111,900 gave a change of around 6000 dollars , At this position the BTC outlook shows it may show reversal of around 4K dollars change. The possibilities for the BTC are shown here. Take risk accordingly.
Disclaimer : It isn't a financial advice check my analysis and decide on your own.
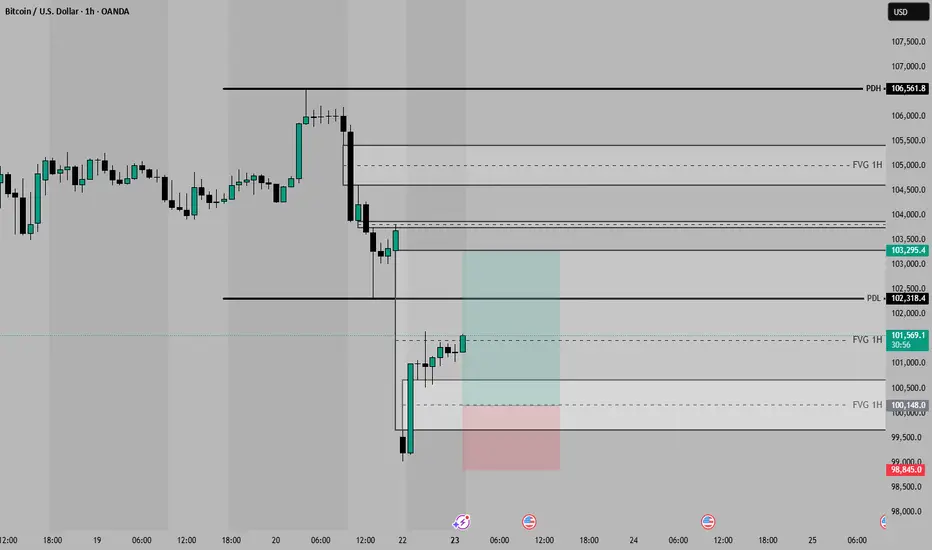
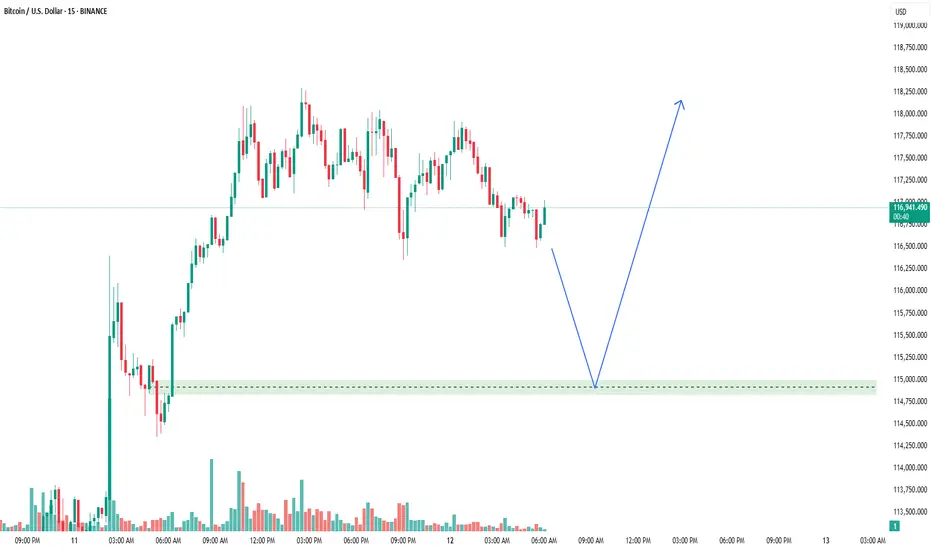
BTC TRADE IDEA 22/06/25There are some places where price needs to ATK
Wait for reversal before chase that gap
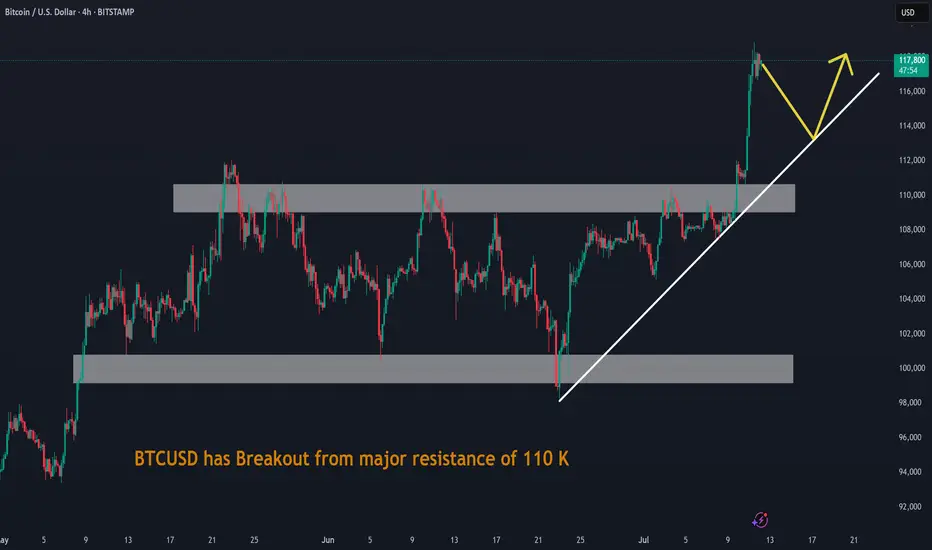
BTCUSD has Breakout from major resistance of 110 KBTCUSD has Breakout from major resistance of 110 K. It may retace before up momentum continues
BTC 150,000H&S
Money Flow in full force
BTC supported by CBs
YTD 26%
1 Year 70%
Now Target 150,000 by Dcc 25
BTCUSDT BUYING SETUP Bitcoin (BTCUSDT) is forming a strong buying setup as price holds above a key support area. This zone is showing early signs of bullish interest, which could lead to an upward move if momentum continues.
Traders should watch for confirmation signals such as bullish candlestick patterns, higher lows, or a breakout from consolidation before entering. A bounce here could trigger the next leg higher.
Be patient, wait for clear entry signals, and manage your risk carefully! 📈🔥
Technical Analysis by Ali Khan
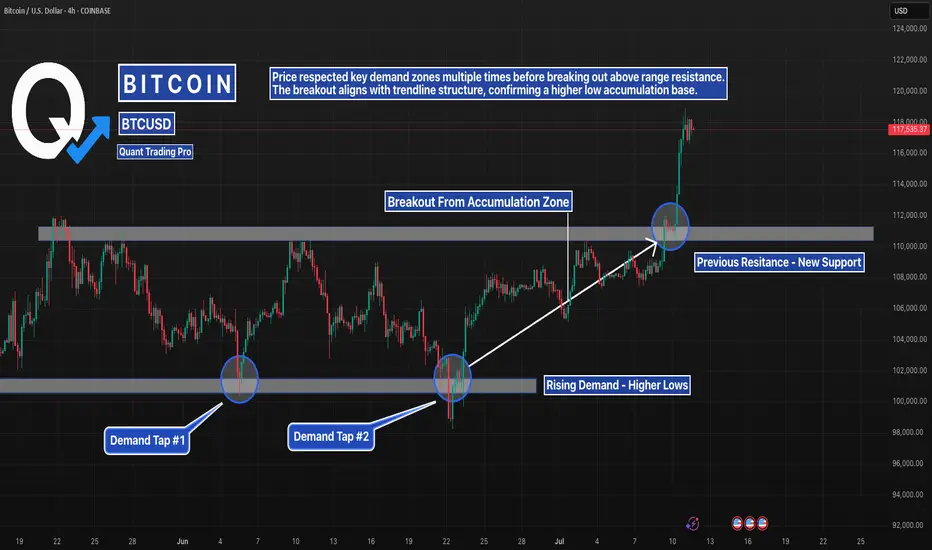
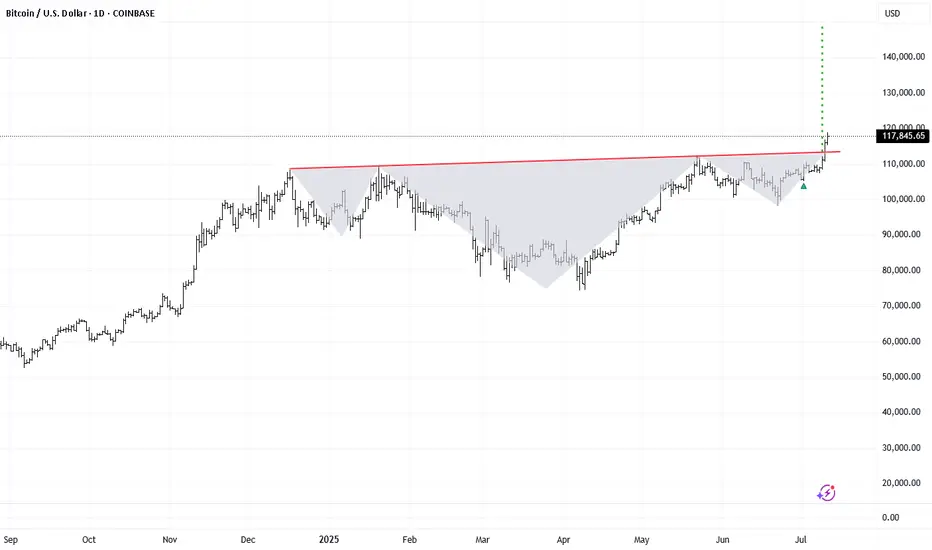
Bitcoin Breakout Fueled by Hidden Demand ZonesBTC just exploded out of consolidation — but the clues were all there. Price tapped the same demand zone three separate times, each time forming a higher low and respecting a clean rising trendline.
The final push broke through prior supply, flipping it into support and kicking off the breakout leg. These demand zones acted as hidden fuel for the move, offering clear entries for traders tracking structure.
📊 Demand respected at ~$104K, ~$107K, and ~$111K
📈 Breakout confirms rising structure and trendline strength
🧠 Key lesson: Strong moves are often born from clean structure, not noise
#BTCUSD #BitcoinBreakout #SmartMoneyMoves #PriceAction #TradingView #QuantTradingPro
BITCOIN ABOUT TO BLOW UP OR TOP NEAR? Read my thoughts below Definitely Bitcoin looks strong compared to the rest of the crypto market.
we have been consolidating on top of the previous all time highs, and that is bullish, now price has broken out from its resistance and strong support remains around 108K area.
If momentum continues, 120K could be strong target, and if broken 135K is next by end of July.
BUT... Predictions is only in our minds, we need to look at Daily, Weekly and Monthly open and closes to determine bullishness or either momentum to the Upside, Distribution or Downside.
The fact that Bitcoin is making new ATH and the media is silent is a good thing.. But right now is trying to break the long top trendline that goes from 2017 top.
To me distribution and consolidation before the last leg makes sense. but nothing really does, markets can remain unpredictable and crazy more than you stay solvent. So if you are trading the move, use stop loss depending on your time horizon and timeframe.. AND DONT TRY TO PREDICT TOPS unless you are going for quick scalps or you might burn your money away.
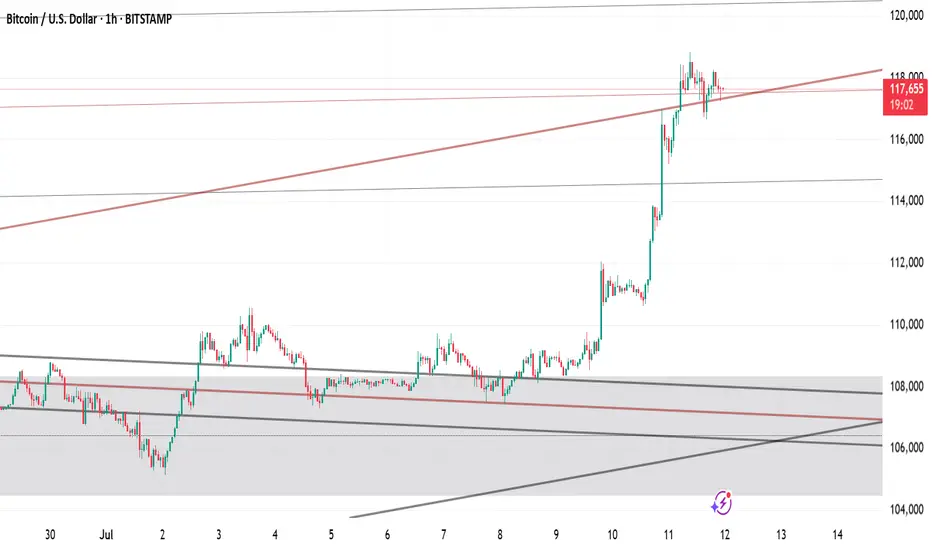
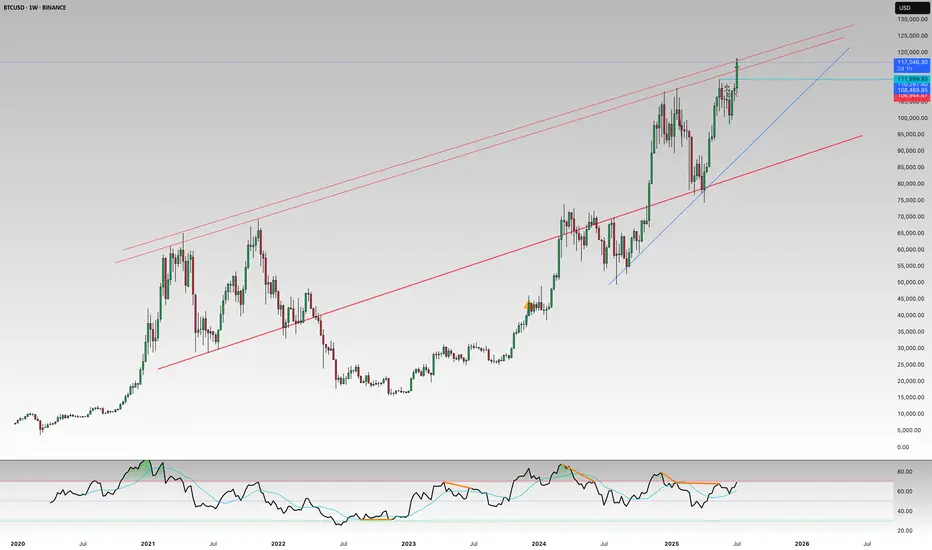
Bitcoin at History high, touching the upper channel lineBTCUSD Weekly Chart – Key Breakout Zone
Bitcoin is now testing the upper boundary of a long-respected weekly trend channel. A clean breakout above this line could trigger a major bullish expansion and lead to price discovery.
This trendline has capped price in the past—keep a close eye on how BTC behaves here. Rejection = pullback risk. Breakout = rocket fuel.
End of Bitcoin cycle this Year nearly 180-200k$ The Great Depression 2.0 ahead and all politicians already know it and prepare to blame all their troubles on the crisis.. I think Bitcoin will reach 180-200k$ till the beginning or the end of september. Need to track the price of gold - Bitcoin ATH near the 55 oz of gold!
After reaching the peak - there will be dump -50%. September and October as the best months for bitcoin in 2025 would be the worst months. November and December maybe green - to close some nice year candle (giving to altcoins last chance for performing) and after that going into the bear market.
BTCUSD supported at 114,000BTCUSD broken a major resistance at 113,000.
I would be buying any dip towards 114,000 for higher levels.
The target is located at 150,000 and 160,000 in coming three months.
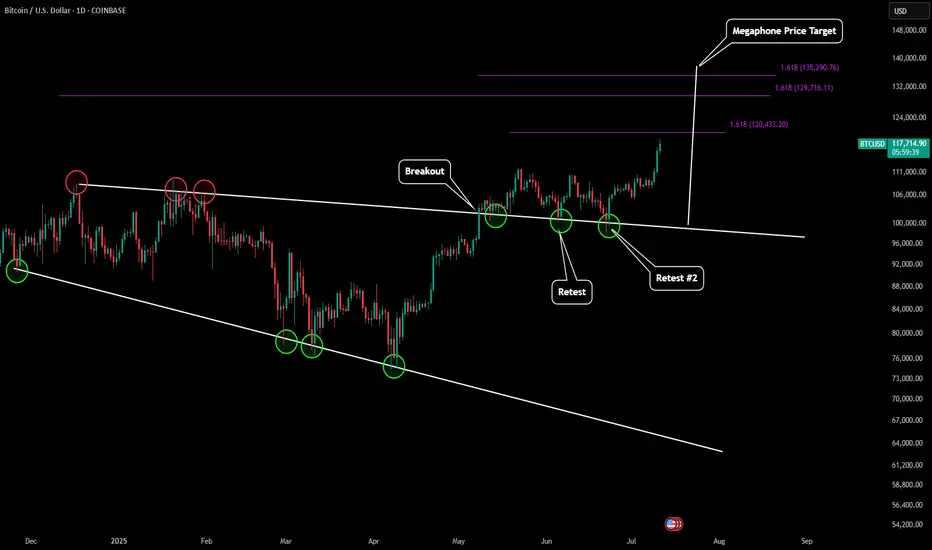
BTC - Next ATH Upside Price Targets After outlining the last low for BTC (which can be found here):
Now BTC is skyrocketing to new all time highs. Based on predictive Fibonacci modeling and also our price target of our macro megaphone pattern we can estimate where BTC's next top might be.
Our first target is just slightly above $120k. This would be our extension target of our most recent LFT trend.
If we take a look back at our last mid-macro trend it would give us an extension target slightly below $130k.
Our final target would be $135-136k which would be from our last high to our last low of our mid-macro trend. This is also in alignment with the full measured move of our megaphone pattern.
As more candle structure form around these levels we will update this prediction with even more precise targets. Happy All Time High everyone!