BITCOIN BULLYING Bitcoin hit take profit previously and now I will be looking at another buy within this trend and price action combined with patterns
BTCUSD trade ideas
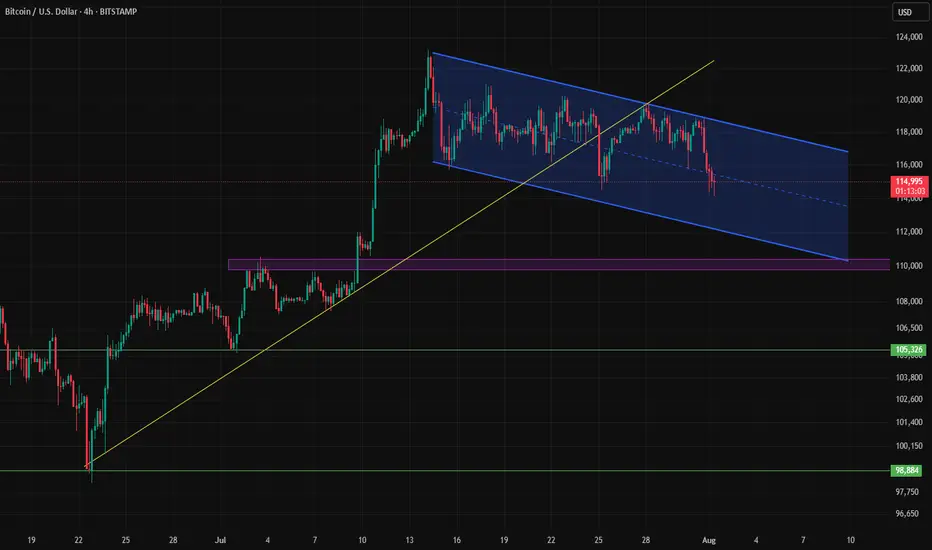
Bitcoin at $110,000?After reaching its last ATH, Bitcoin practically went into a coma. Now, with the strengthening of the dollar, it's undergoing a correction — and if that correction deepens, there's a possibility it could drop to \$110,000. We'll have to see whether it finds support around the \$112,000 level or not.
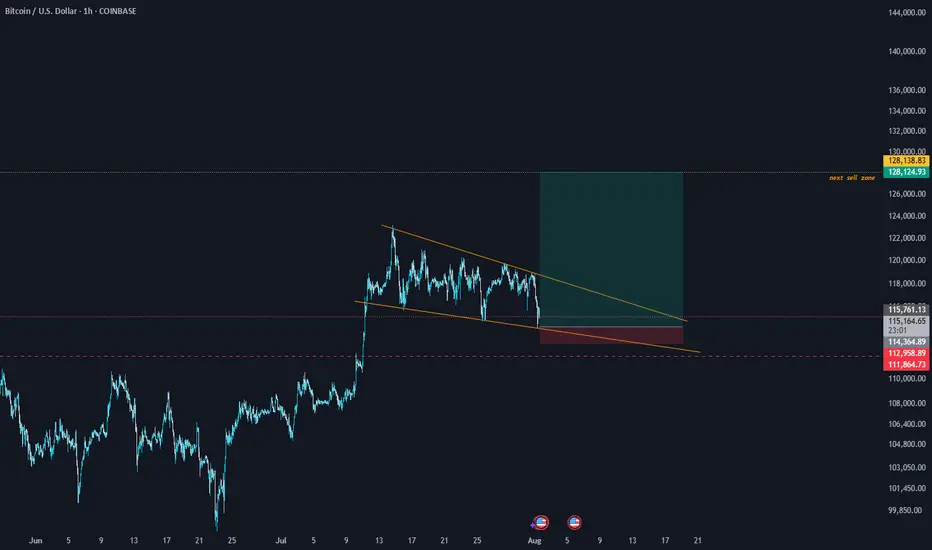
BTCUSD long my predict up to 128100
long possible entry 115150
take profit 128100
stop loss 113000
swing long
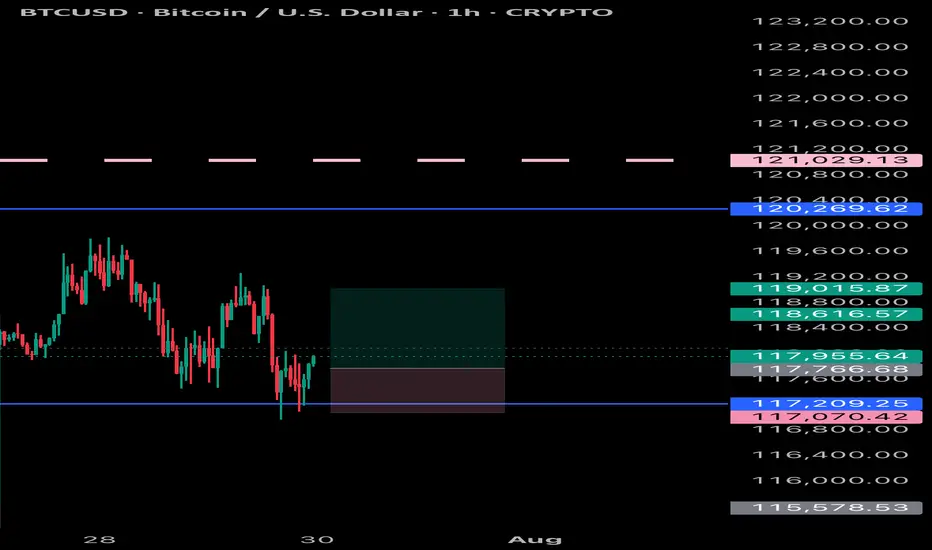
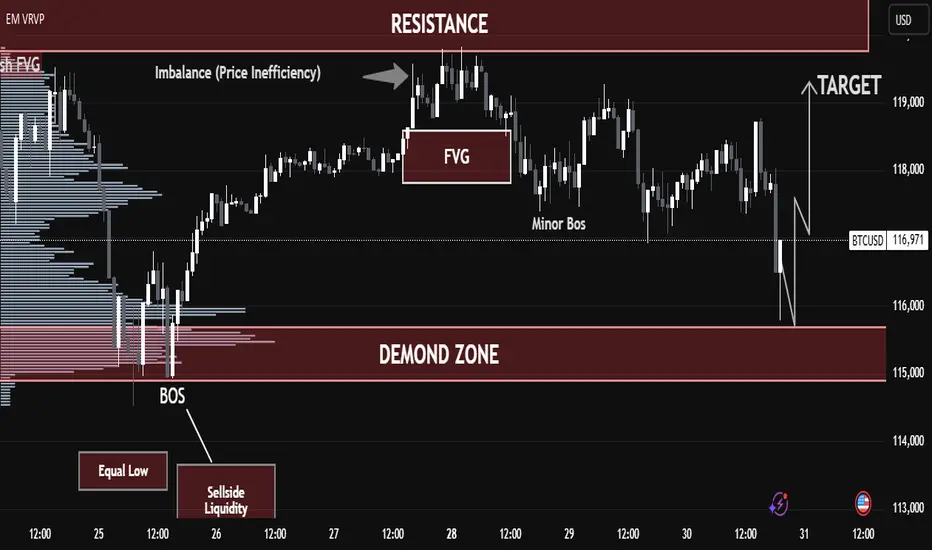
BTC/USD – Strong Buy Opportunity from Demand Zone BTC/USD – Strong Buy Opportunity from Demand Zone
🟢 Technical Outlook:
Bitcoin (BTC/USD) has tapped into a well-defined Demand Zone near 115,000–116,000, showing early signs of a potential bullish reversal. This level aligns with key liquidity zones, smart money concepts, and price inefficiencies — offering high-probability long setups.
🧠 Key Technical Highlights:
🔻 Equal Lows + Sell-Side Liquidity:
Market swept equal lows, grabbing liquidity below support — a common institutional setup before a bullish push.
✅ Break of Structure (BOS):
A prior BOS indicates a shift from bearish to bullish structure after liquidity collection.
📉 Fair Value Gap (FVG):
Price created and respected an FVG after the BOS, validating bullish intent.
📊 Imbalance Filled:
A prior price inefficiency has now been filled, completing a clean move from imbalance back into structure.
📈 Target Zone: 119,000 USD
Marked as the logical next stop — sitting near prior resistance and a liquidity zone.
🎓 Educational Insight:
This is a textbook Smart Money Concept scenario:
Sell-side liquidity sweep
Demand zone tap
Imbalance rebalancing
Shift in market structure
It shows how institutions often engineer liquidity grabs before a large directional move.
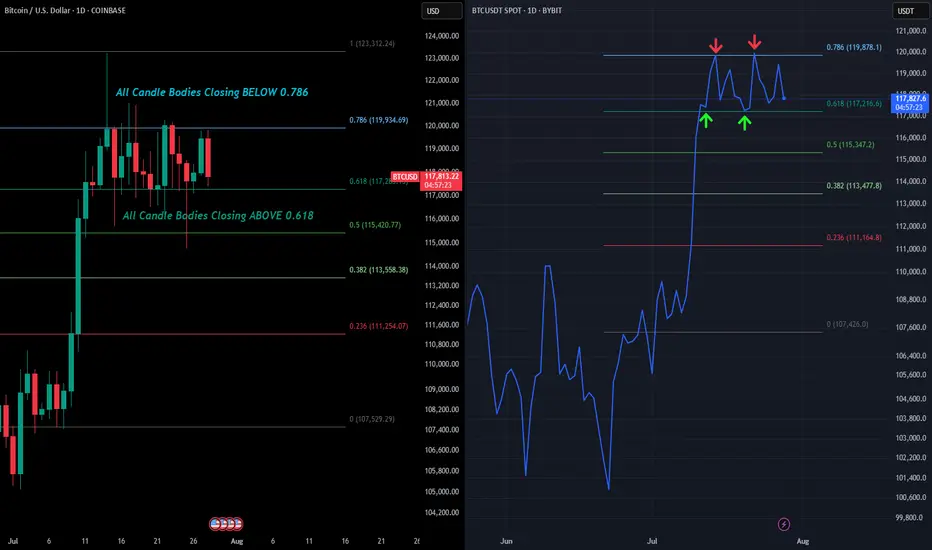
BTC - 1D RangeboundIf you saw our recent post on the warning signs of BTC's weekly chart, we are now going to zoom into the daily and examine how that structure will be decided.
For the last 2 weeks BTC's daily price action has been rangebound between 2 very important levels. The 0.786 (as we have been outline for the past couple weeks) and the 0.618.
So far every rejection (wick high) has happened around the $120.4k level. This is the 1.618 extension target we have had outlined for a while.
And if you look at the actual candle bodies, each has closed below that 0.786 confirming the rejections. The only way to negate this would be to close a daily candle ABOVE the 0.786 which would be over $120k on the Binance chart.
What we have also seen is bulls holding strong support at the 0.618. Everytime we wick below bulls quickly buy it up thus creating our range.
This can clearly be seen by the line chart we have added on the right. The line chart only takes into account candle body closes which shows the perfect bounces between support and resistance.
However if we close a daily candle below the 0.618 $117.2k then that would signal lower price action tests are likely to ensue. Will update this post once we get the confirmation breakout or breakdown from this micro range.
Ethereum is Trending HigherSince April trough, Ethereum has risen by 179%, delivering a higher rate of return than Bitcoin at 66%. But most of our attention is on Bitcoin, breaking above the 120,000 level.
Why is Ethereum quietly gaining ground —and what does the future hold for Ethereum?
Mirco Bitcoin Futures and Options
Ticker: MET
Minimum fluctuation:
$0.50 per ether = $0.05 per contract
Disclaimer:
• What presented here is not a recommendation, please consult your licensed broker.
• Our mission is to create lateral thinking skills for every investor and trader, knowing when to take a calculated risk with market uncertainty and a bolder risk when opportunity arises.
CME Real-time Market Data help identify trading set-ups in real-time and express my market views. If you have futures in your trading portfolio, you can check out on CME Group data plans available that suit your trading needs tradingview.sweetlogin.com

$BTC DO NOT BE REKT!bitcoin can create an accumulation process in the mini timeframe after the major rally, which will serve as fuel before another parabolic run
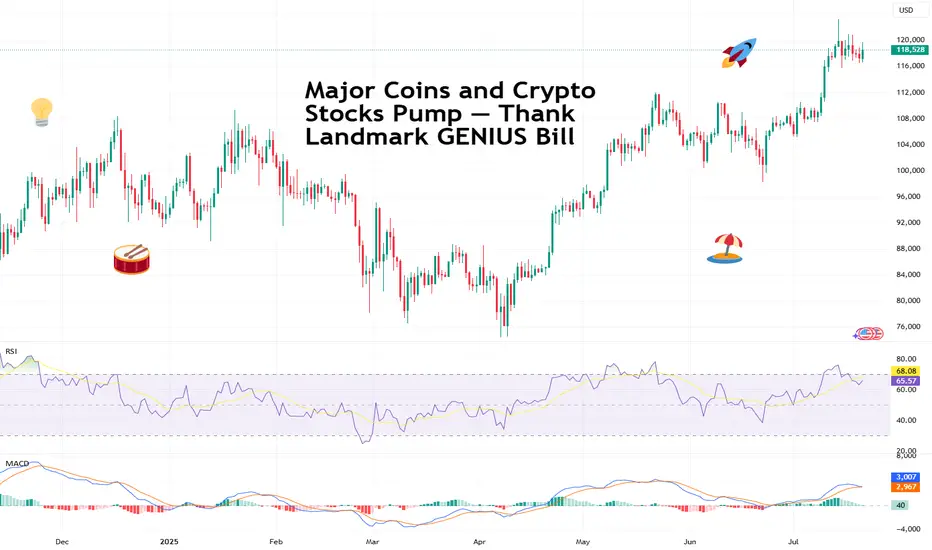
Major Coins and Crypto Stocks Pump — Thank Landmark GENIUS BillBitcoin BITSTAMP:BTCUSD making ATHs? Old news. But Coinbase NASDAQ:COIN and Robinhood NASDAQ:HOOD hitting those record-high notes? And XRP BITSTAMP:XRPUSD dangerously close to eclipsing its own peak, while Ethereum keeps chugging along toward $4,000? Now we’re talking.
In a market-friendly twist, President Trump signed the GENIUS Act into law on Friday — a sweeping legislative win for crypto. Short for Guiding and Establishing National Innovation for US Stablecoins, the GENIUS Act marks the first major federal framework for digital assets and, more importantly for traders, triggered a firestorm of price action across the space.
Flanked by crypto executives, Republican lawmakers, and a few NFT bros in suits, Trump called the stablecoin-focused bill “perhaps the greatest revolution in financial technology since the birth of the internet.” Bold claim. But judging by what the market’s doing — he might actually be onto something.
The bill, passed 308 to 122 in the House, lays the groundwork for US banks to issue their own stablecoins and create a regulatory moat that finally separates innovation from legal whack-a-mole.
But wait, that’s not all. The House also passed the CLARITY Act and the Anti-CBDC Surveillance State Act. The first one will help determine if cryptos will be considered securities and the second one bans the Federal Reserve from issuing its own coin.
🚀 Crypto Market Cap Hits $4 Trillion
As the bill cleared Congress and Trump picked up the pen, the entire crypto market cap exploded past $4 trillion for the first time in history with the orange coin holding more than 60% of the market .
It wasn’t just Bitcoin BITSTAMP:BTCUSD making noise (although it did quietly retest $120,000 boasting a $2.4 trillion valuation, or more than that of Google parent Alphabet NASDAQ:GOOGL ).
The real momentum was coming from the stocks and altcoins — especially those with exposure to the suddenly green-lit US regulatory scene.
📈 Coinbase: To the Moon and Beyond
Let’s talk about Coinbase, ticker symbol NASDAQ:COIN , and now also, apparently, ticker symbol 🚀.
Shares surged over 8% on Friday to hit a new record session high of $445, giving the US-based exchange a market cap of over $100 billion. Not bad for a company that spent most of 2022 playing dodgeball with the SEC.
The GENIUS Act (and its siblings) cleared a path for institutional crypto adoption — and no one stands to gain more than Coinbase. It’s the go-to exchange for institutional custody and compliance. And now, with banks dipping their toes into stablecoin waters, guess who gets to facilitate those flows? Exactly.
Coinbase has now rallied over 63% year-to-date, putting it back into market darling territory — and giving early bulls a solid reason to post their PnLs again.
📊 Robinhood: Meme Stock No More?
Wait, what’s that clamor? It’s the “HOOD to $100” crowd dusting off their 2021 hats.
Robinhood NASDAQ:HOOD also saw a serious lift from the legislative push — hitting an all-time session high of $113 on Friday. The shares are up 180% in 2025 alone.
While most remember Robinhood for its meme stock legacy, the app has quietly built a towering crypto trading platform in the US. And now, with Congress cracking open the stablecoin lane and clearing legal fog, it’s suddenly a real contender in the digital asset arms race.
Add to that Trump’s pledge to dismantle crypto-hostile policies from the previous administration (many of which affected Robinhood’s crypto operations), and it’s no wonder the stock is flying.
💰 Stablecoins: Boring Coins Are Now Big Biz
You’d be forgiven for snoozing through most stablecoin headlines. After all, they don’t moonshot or do anything but sit idle.
But make no mistake — this is where the real money’s watching. JPMorgan CEO Jamie Dimon, not known for casual crypto endorsements, said last week his bank will now be “involved in both JPMorgan deposit coin and stablecoins.”
That’s a seismic shift. For years, traditional banks sat on the sidelines while Circle CRYPTOCAP:USDC and Tether CRYPTOCAP:USDT built billion-dollar stablecoin empires. Now, thanks to the GENIUS Act, the door is open for regulated banks to issue digital dollars backed by FDIC-level trust — and potentially eat into the DeFi-native players’ lunch.
Boring’s about to get very profitable.
💥 XRP: Return of the Ripple?
You know it’s a bull market when XRP BITSTAMP:XRPUSD shows up uninvited and still gets the VIP booth.
The one-time courtroom drama token surged over 60% in the past two weeks, hitting $3.50 and inching dangerously close to its all-time high. Ripple’s comeback arc may finally be getting its payoff.
With legal pressure fading and Congress setting new guardrails for digital assets, XRP’s regulatory risks just got a lot less scary. Plus, institutions looking for faster cross-border rails may find XRP’s network a bit more attractive when Washington’s no longer breathing down its neck.
🐂 Ethereum: Quietly Eyeing $4,000
Ethereum BITSTAMP:ETHUSD might not be making headlines like Bitcoin or XRP, but don't let the quiet confidence fool you.
ETH has been rising steadily, gaining almost 50% in the last two weeks, and Monday morning was trading just shy of $3,800. With regulatory uncertainty waning, and the market treating Ether more like an investment than a utility token, it’s slowly reclaiming its 2025 highs.
Factor in the growing number of ETH-based ETFs , tokenized real-world assets (hello, Treasury bills onchain), and the boom in stablecoins running on Ethereum rails… and you’ve got a slow-burn bull case building brick by brick.
🦅 Washington, WAGMI?
So, what’s the takeaway?
For the first time, Congress passed crypto legislation that didn’t come with a hidden poison pill. The GENIUS Act, along with the CLARITY Act, have made more legislative progress in a week than years of courtroom wrangling and ETF lobbying combined.
Trump, with his pro-crypto stance and deep industry ties (after all, he did launch his own coin not too long ago), just turned crypto into a political weapon — and a market darling. Is 2025 shaping up to be the year Washington went full Web3?
Let’s hear it from you : Drop your thoughts in the comments and let’s spin up the discussion.
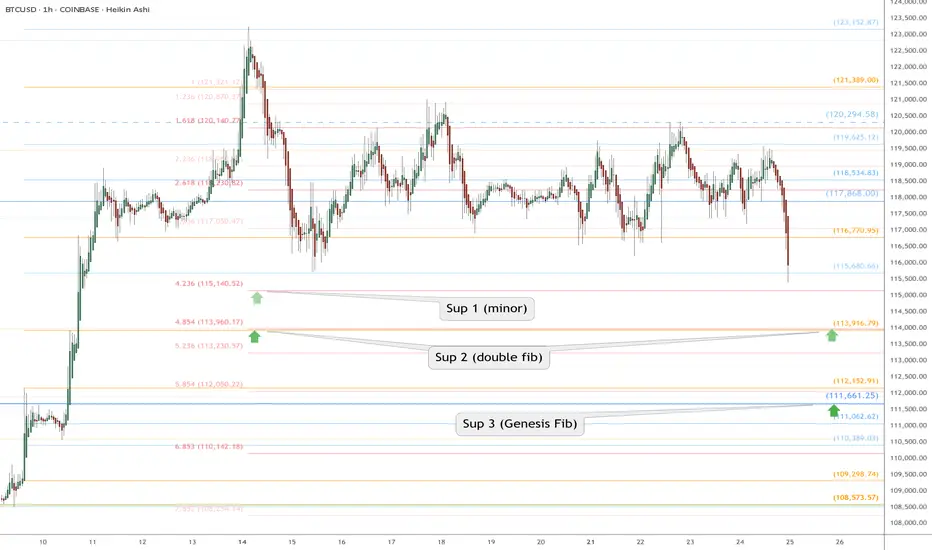
BTC Retrace RoadMap and 3 nearby supports worth watching NOWThis is a near-term followup to my big picture linked below.
Dip is underway after orbiting our Genesis Fib at 117.9k.
Quickly approaching the next three supports worth watching.
Supports get stronger below but each one needs to slow the dip.
$ 115,140 is a minor fib but possible end of dip wave.
$ 113,9xx is a double fib that should be pretty strong
$ 111,661 is the sister Genesis fib, and a MUST HOLD
.
Big Picture chart and why 117.9k was KEY
=======================================================
.
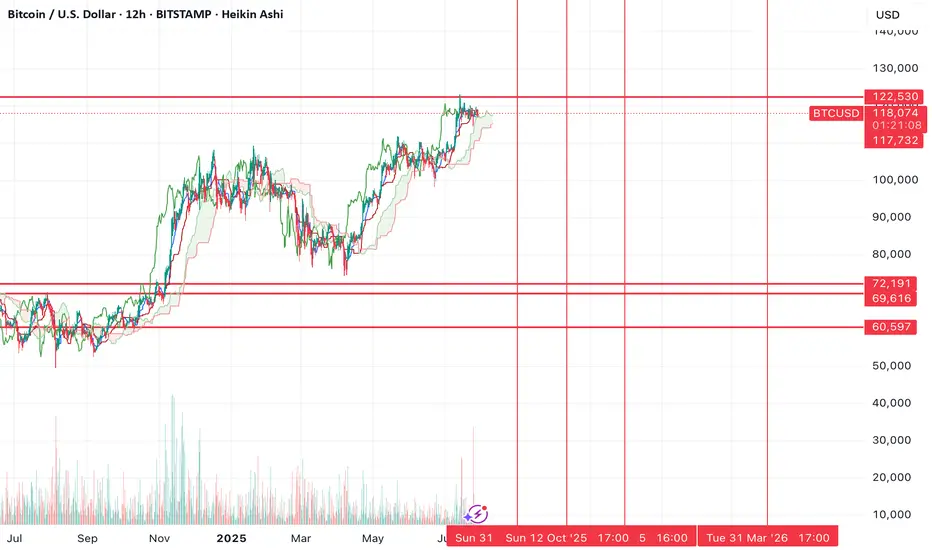
BTC highs in, new lows coming soon?~$122.5k was the top of the range. Now we'll need to go test the lows before we can continue higher.
Alts are clearly not confirming a trend change .
Many still bearish on HTFs (including ETH), I think the reason is because Bitcoin goes lower before we see a continued run and that will drag down alts with it. I think people holding alts here with hopes for new highs (in the near future) are about to have their hopes crushed, that also goes for people long crypto miners.
I don't think the real run starts until end of 2025 or 2026.
Time will tell.
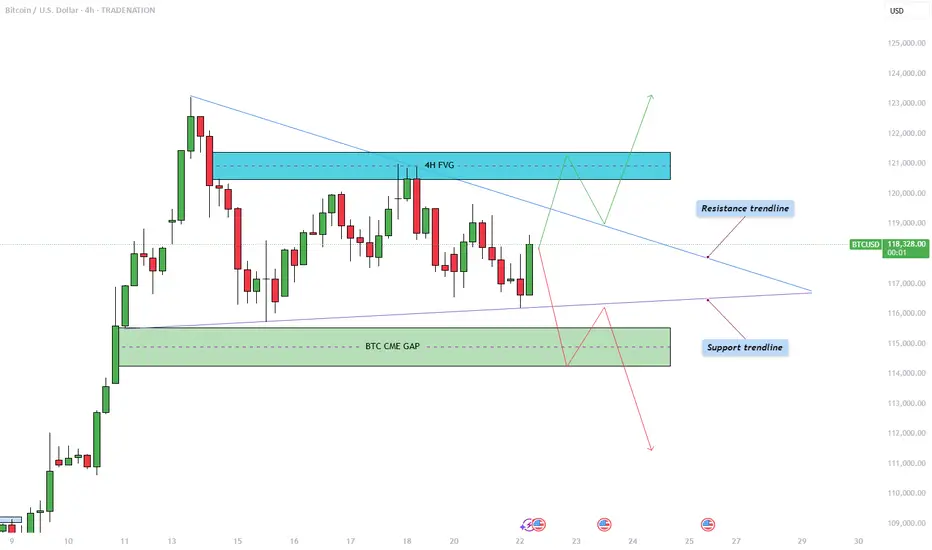
Bitcoin - Triangle pattern consolidation!The Bitcoin price action is currently coiling within a symmetrical triangle pattern on the 4-hour chart, as illustrated in the chart provided. After a significant bullish move earlier this month, BTC has now entered a phase of consolidation, marked by a series of lower highs and higher lows. This has formed a triangle pattern, suggesting an imminent breakout as price nears the apex. The upper boundary of the triangle acts as dynamic resistance, while the rising lower trendline provides firm support. Given the preceding upward momentum leading into this consolidation, the bias slightly favors a breakout to the upside, though the market can always surprise.
Bullish Scenario
In the bullish case, Bitcoin would need to break convincingly above the descending resistance trendline. Should that occur, the next key level to watch lies within the 4-hour bearish Fair Value Gap (FVG) between $120,500 and $121,400. This region represents an area of inefficiency where price moved rapidly in the past, and it is likely to attract selling pressure again. Bulls would ideally aim to reclaim this zone with strong momentum and potentially use it as support in a retest scenario. A successful retest of the triangle’s upper boundary could also trigger a liquidity grab above recent highs, particularly above the all-time high levels.
Bearish Scenario
On the flip side, a bearish breakout would involve BTC breaking below the ascending support trendline. If this happens, the most probable downside target would be the CME gap left behind from two weekends ago, located between $114,300 and $115,500. This price gap occurred due to the discrepancy between Friday’s closing price and Sunday’s opening price on the Chicago Mercantile Exchange, often a magnet for price reversion. After this gap is filled, it is possible that BTC sees a short-term bounce to retest the triangle from below, before potentially continuing lower to address further imbalances in price action.
How to Confirm a Valid Breakout
Trading triangle patterns can be deceptive, as BTC often exhibits false breakouts designed to trap traders on the wrong side. To confirm a valid breakout, it's crucial to observe at least a few 4-hour candles closing decisively above or below the triangle boundaries. Additionally, breakout strength should be accompanied by a noticeable increase in volume. A breakout without volume confirmation is often a sign of a fake move, and entering trades under such conditions can be highly risky.
Final Thoughts
BTC is currently consolidating within this symmetrical triangle formation, signaling a period of indecision and potential volatility ahead. While both bullish and bearish scenarios are plausible, it is essential to wait for clear confirmation before committing to a position. Patience and discipline are key, especially when navigating patterns prone to fake-outs. For now, remaining on the sidelines until a confirmed breakout occurs may be the most prudent strategy.
--------------------------
Disclosure: I am part of Trade Nation's Influencer program and receive a monthly fee for using their TradingView charts in my analysis.
Thanks for your support. If you enjoyed this analysis, make sure to follow me so you don't miss the next one. And if you found it helpful, feel free to drop a like and leave a comment, I’d love to hear your thoughts!
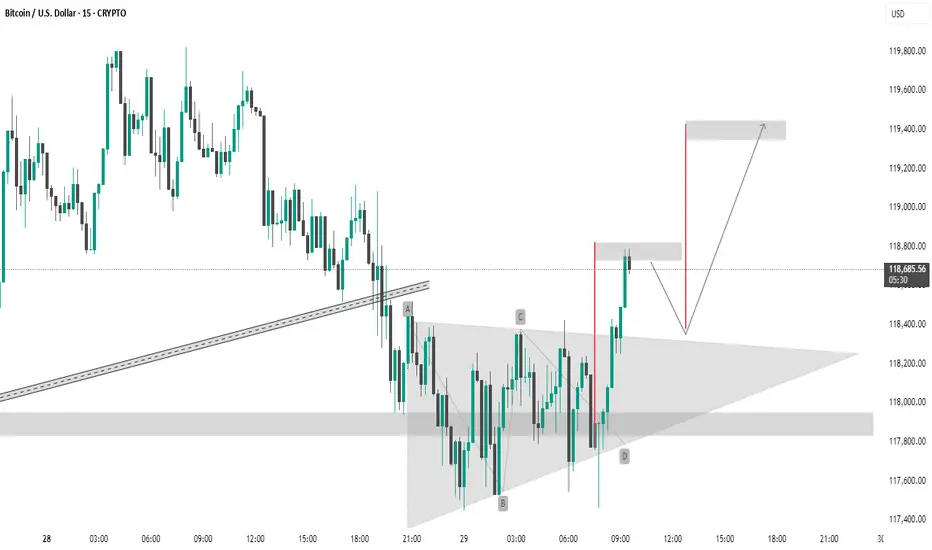
BTC #This Bitcoin (BTC/USD) 15-minute chartThis Bitcoin (BTC/USD) 15-minute chart shows a symmetrical triangle breakout. The pattern labeled A-B-C-D indicates consolidation within the triangle, followed by a bullish breakout. The price has broken above the upper trendline and is approaching the resistance zone around 118,800–119,400 USD. The chart suggests two scenarios:
Immediate breakout to the 119,400 resistance.
Short-term pullback to retest the breakout zone (~118,600), followed by a continuation to 119,400.
The setup implies a bullish bias with a potential upside target around 119,400 USD.
thanking you
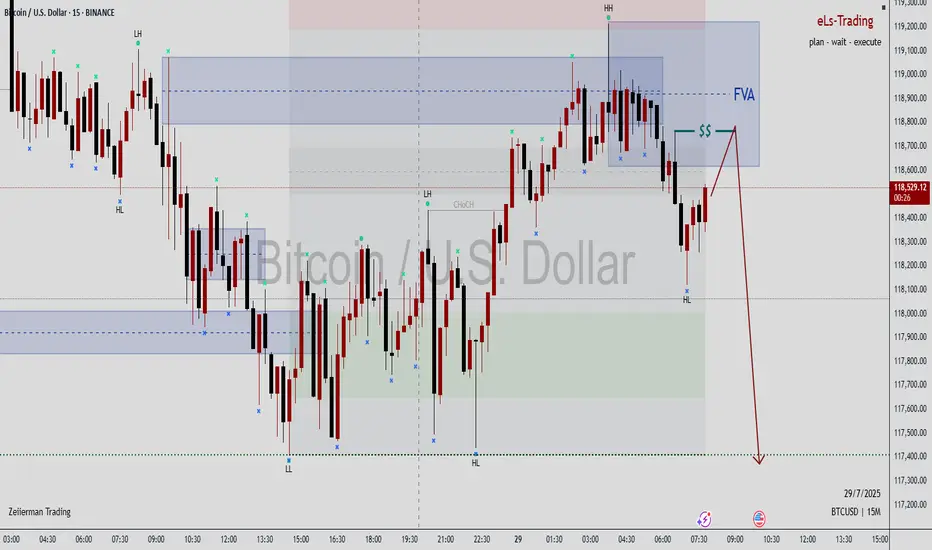
The price re-entered the supply and showed signs of rejectionPrice is reacting from a supply zone marked in grey, suggesting potential short (sell) opportunity.
A clear Change of Character (ChoCH) is visible, indicating a possible shift from bullish to bearish structure.

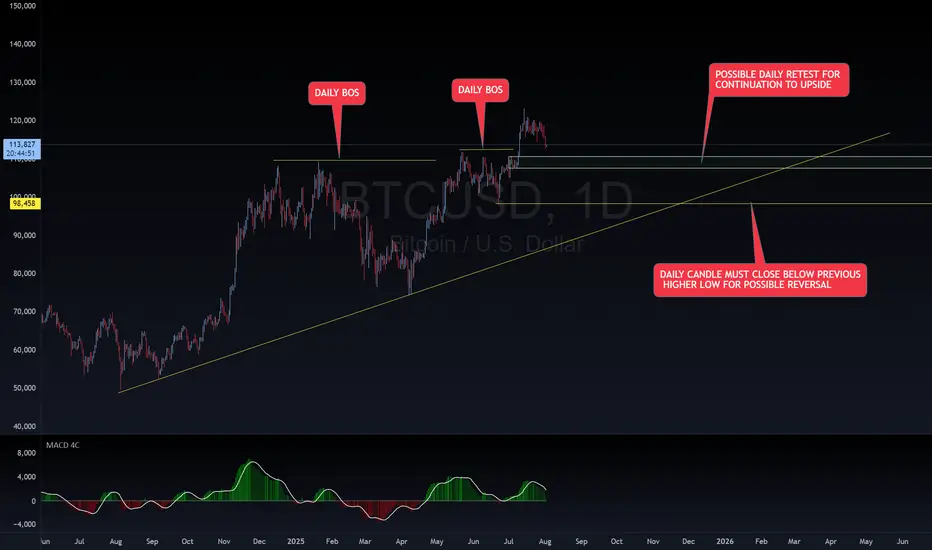
BTC BUY SET UPBTC is on an overall DAILY uptrend with a DAILY BOS. Waiting on a DAILY retest for continuation upward. If DAILY candle breaks and closes below last DAILY HL, it could potentially cause a reversal to downside. Happy trading!
~~~~I want everyone to succeed!
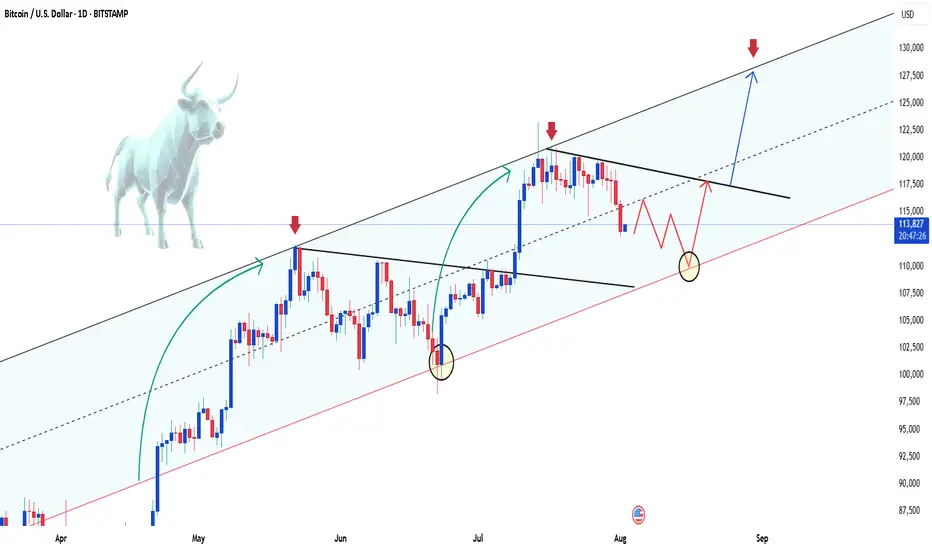
BTCUSD – bullish momentum is backBitcoin is making a strong comeback, breaking above short-term resistance and reestablishing its uptrend after a prolonged consolidation phase. The technical structure now shows clear control from the bulls, with higher highs and higher lows beginning to form.
Positive risk sentiment and growing expectations of capital flowing back into the crypto space—especially after a series of weak U.S. economic data—are fueling the current BTCUSD rally. If momentum holds, the next target could be the upper boundary of the price channel.
Keep an eye on how price reacts at key levels and trendlines — this might be the launchpad for the next bullish leg.
Good luck, and if you enjoyed this analysis, don’t forget to hit like and drop a comment!
BTCUSD IdeaWe are waiting for our asset to reach our action zone, and based on the reaction, we’ll decide on our next moves.ALWAYS WAIT FOR A CONFIRMATION TO SEE IF THE PRICE VALIDATES THE ZONE.and you what is your vision of the EURUSD its interests me! i wait you in the commentary

Btc long term targetsOnce Btc & alt coins bottom, the Btc pump to $130K- $140+ is possible.
I would expect a retrace at that point, which would conveniently
bring Btc down to fill a CME gap at $92K (right within the Fib retracement
ratios I would expect). This is just an idea, but wouldn't it be interesting.
Note: This pattern is a fractal

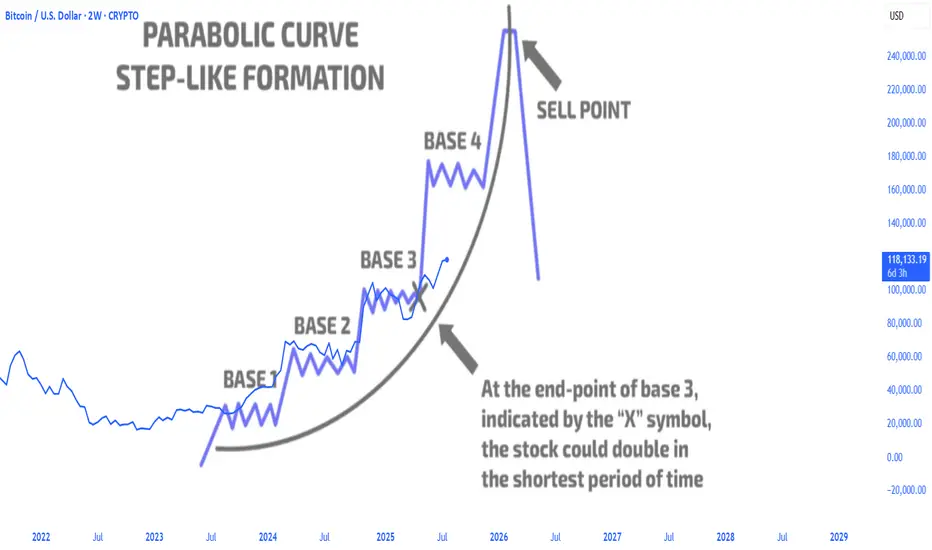
btc parabolic curvebitcoin parabolic curve pattern exits the base3 accumulation area and continues to rise sharply, with more to come
Beyond ICT & SMC: The Mathematical Revolution in Zone TradingIn the world of trading, there's a fundamental divide between traders who rely on subjective interpretation and those who trust mathematical precision. While concepts like ICT (Inner Circle Trader), SMC (Smart Money Concepts), and naked chart analysis have gained popularity, they all share one critical flaw: they're based entirely on personal interpretation.
The Subjectivity Problem
Ask ten ICT traders to mark their Order Blocks, Fair Value Gaps, or Breaker Blocks on the same chart, and you'll get ten different answers. Why? Because these concepts rely on:
Personal bias in identifying "significant" levels
Subjective interpretation of market structure
Discretionary decision-making on what constitutes a valid setup
Emotional influence on analysis
The same issue plagues SMC, CRT (Candle Range Theory), time-based analysis, and naked chart trading. One trader's "liquidity grab" is another trader's "breakout." One person's "strong support" is another's "weak bounce zone."
The Mathematical Solution
This indicator eliminates this guesswork entirely. Instead of relying on subjective interpretation, it:
Calculates exact entry levels using mathematical formulas based on session params
Identifies precise support/resistance zones
Standardises signals across all timeframes, ensuring consistency whether you're on 1m or 15m charts
Removes emotional bias by using algorithmic detection of significant price levels
Numbers Don't Lie
While an ICT trader might debate whether a level is "mitigation" or "inducement," our indicator simply states: "Entry at 1.0847, Stop at 1.0832." No interpretation needed. No second-guessing. Just mathematical precision derived from actual price action.
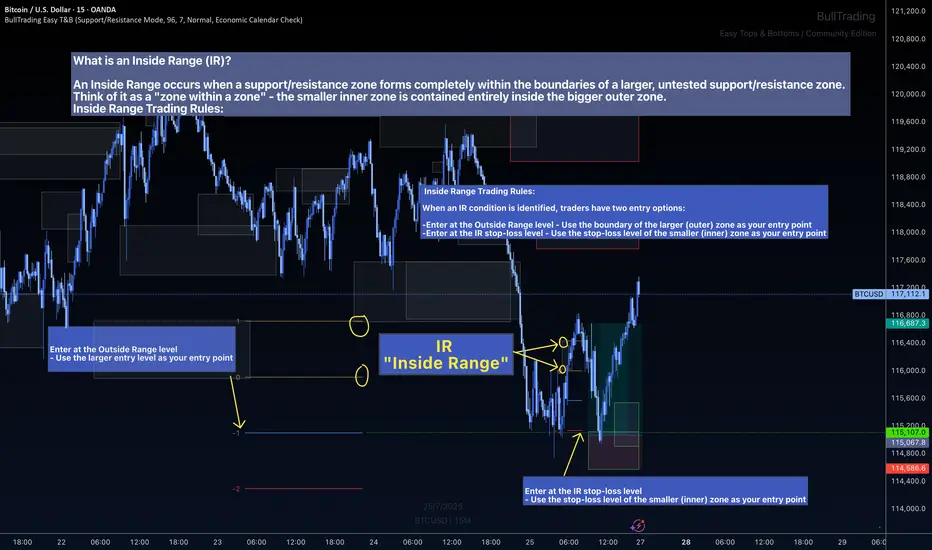
The Inside Range Advantage: When Zones Within Zones Create Superior Trading Opportunities
Most traders miss one of the most powerful setups in technical analysis: the Inside Range (IR). While ICT traders debate "nested order blocks" and SMC followers argue about "refined zones," you can easily identify Inside Ranges with this indicator and mathematically identify these high-probability setups with zero ambiguity.
What Makes Inside Ranges Special?
An Inside Range occurs when a new support/resistance zone forms completely within an untested larger zone. Think of it as the market revealing its hand twice – first showing you the broader area of interest, then pinpointing the precise level within it.
The Mathematical Edge
While discretionary traders struggle to identify these setups consistently, this indicator:
Automatically detects when a smaller zone forms within a larger untested zone
Calculates two precise entry options without any guesswork
Eliminates the confusion of nested levels that plague subjective analysis
Two Entries, Zero Confusion
Documentation and full trading system instructions can be found on the indicator's publication
When an IR forms, the indicator provides exactly two mathematically-derived entry options:
The Outside Range entry – Using the larger zone's entry level
The IR Stop-Loss entry – Converting the inner zone's stop level into an entry point
Compare this to SMC's "refined OB" or ICT's "nested FVG" concepts where traders endlessly debate which level is valid. With Inside Ranges, there's no debate – just two clear, calculated levels.
Inside Ranges represent areas where institutional interest overlaps. The larger zone shows initial interest, while the smaller zone within reveals refined positioning. By mathematically identifying these setups, you're trading where smart money has shown its hand twice.
Real Consistent Precision
Instead of squinting at charts trying to identify subjective "zones within zones," let mathematics do the heavy lifting.
In trading, consistency beats creativity. Stop drawing arbitrary lines and hoping for the best. Start trading with mathematical precision.
Documentation and full trading system instructions can be found on the indicator's publication →
Trade with confidence. Trust in mathematics. Trust in your Edge.
Btcusd techinical analysis.Btcusd techinical analysis next move posibale at h1 time frame not finchinal advice.

Bitcoin Has Bearish DivergenceOverbought bearish divergence.
I pointed this out last week. In my mind, this is the most reliable signal for tops (bullish divergence for bottoms) that exists in technical analysis. We can see that this continues to play out, and know that it usually leads to RSI making the trip to oversold.
It looks like more correction is likely, standard fare in a bull market.

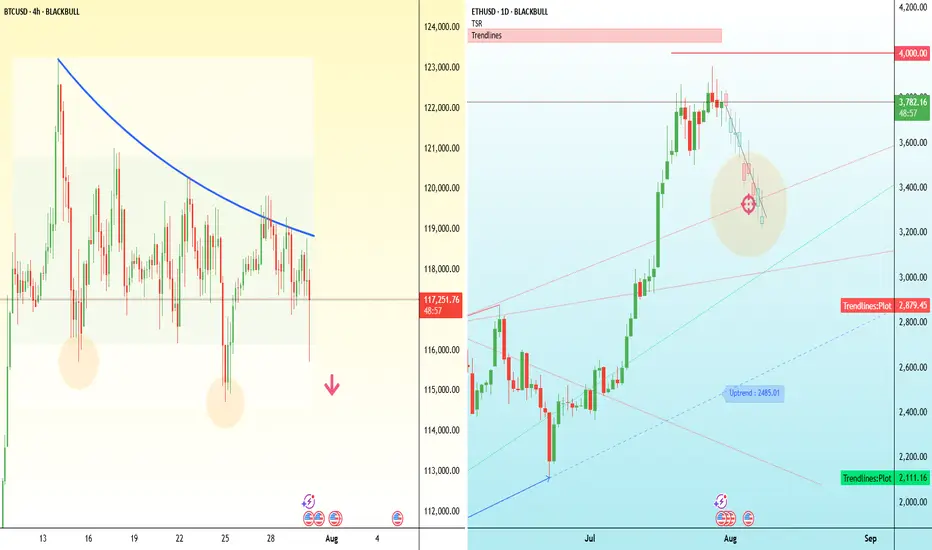
Major test for crypto bulls - BTC and ETH Bitcoin has dipped below $118,000, putting pressure on the bullish structure that’s held for the past two weeks.
The attempted breakout above $121,000 has failed, and price is now breaking down through the middle of the consolidation range, threatening short-term higher lows. On the 4H chart, this move resembles a failed breakout with a potential double-top near $121,000.
If Bitcoin can’t reclaim $116,000 quickly, the next downside levels to watch are $114,000 and $110,000.
Ethereum, meanwhile, has stalled just below $3,800 after a strong rally this month. Price action has flattened out over the past few days, with several failed attempts to push through that level. The key upside trigger remains $4,000.
But if $3,700 gives way, ETH may slide back to the $3,450–$3,300 region, where previous resistance and the rising trendline converge.