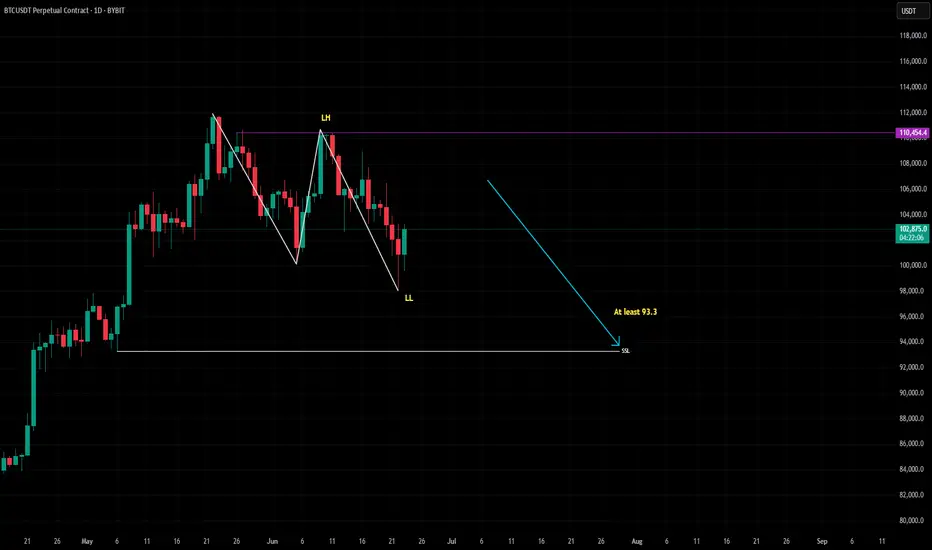
BTC Short to 93.3My target is at least SSL on 93.3
WTF, there is no need to post a huge text description to understand what is depictured on the chart!
BTCUSDT.3L trade ideas
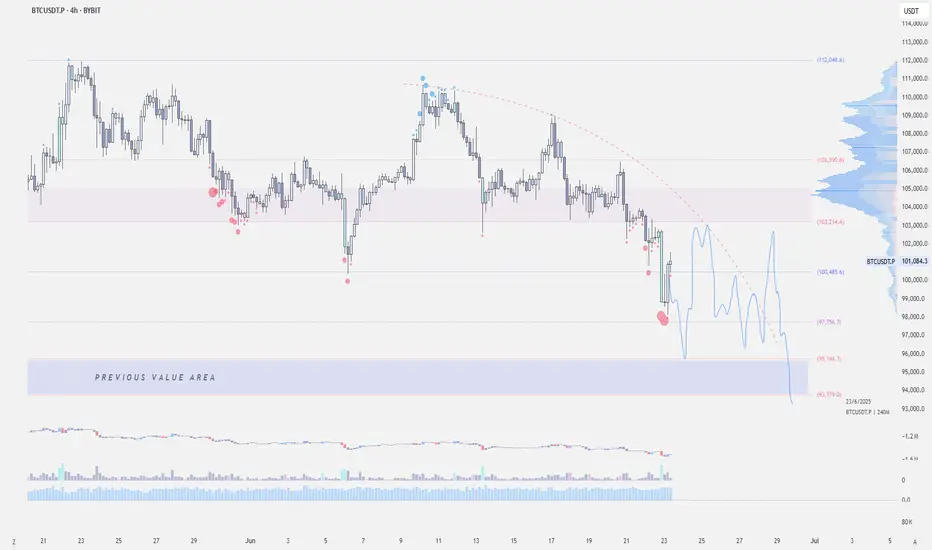
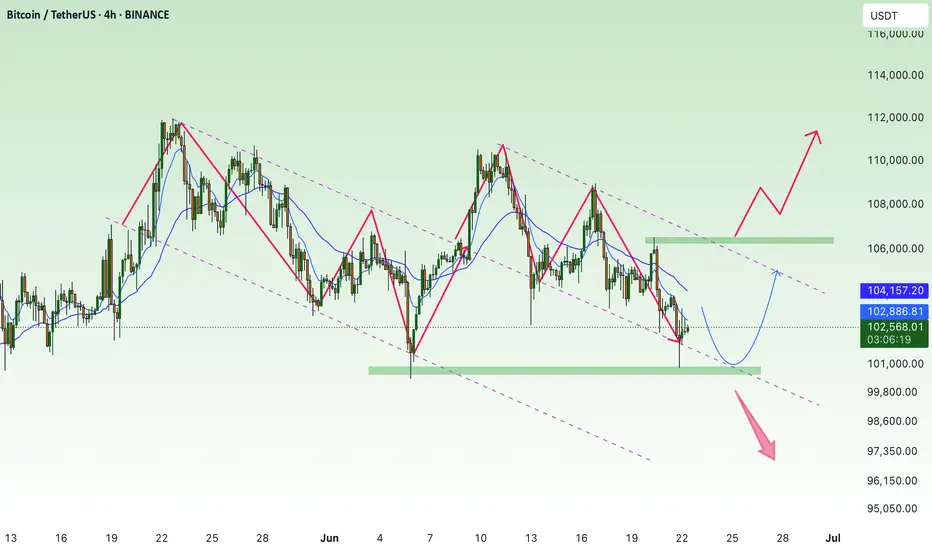
$BTC - Short-term OutlookCRYPTOCAP:BTC | 4h
We got a solid bounce off 98k
Next key level is 103.5k–104k. A clean reclaim flips short-term bias bullish.
If price gets rejected again, this likely confirms a bearish retest, and likely leading back down to the 94k–92k value area
Price could range for awhile at this level as we challenge the 104k — prior value acting as resistance.
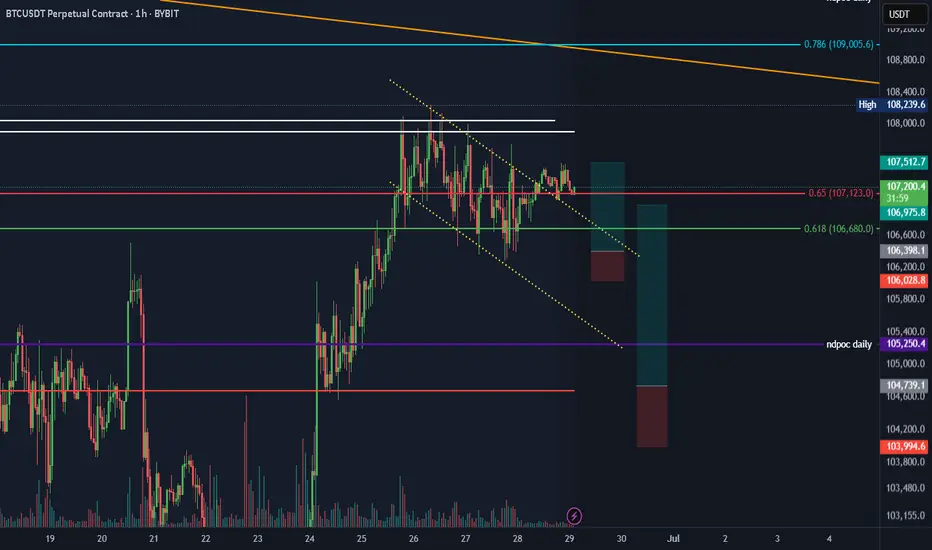
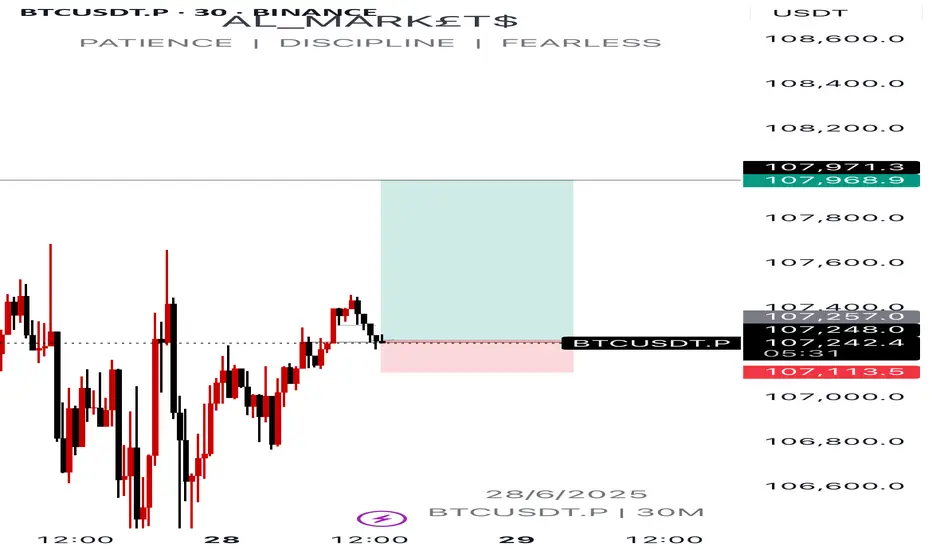
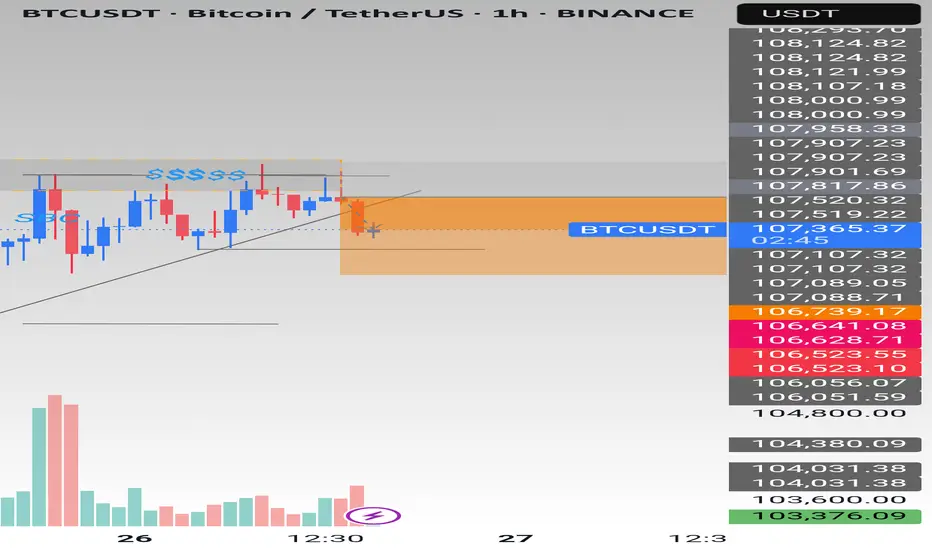
BTC LONG TRADE BTC LONG TRADE
ENTRY : 106398.1
PROFIT : 107512.7
STOP : 106028.8
ALL trading ideas have entry point + stop loss + take profit + Risk level.
hello Traders, here is the full analysis for this pair, let me know in the comment section below if you have any questions, the entry will be taken only if all rules of the strategies will be satisfied. I suggest you keep this pair on your watchlist and see if the rules of your strategy are satisfied. Please also refer to the Important Risk Notice linked below.
Disclaimer
BTCUSDT.P potential short term buysCurrent price action is pointing out to potential short term buys on btc.
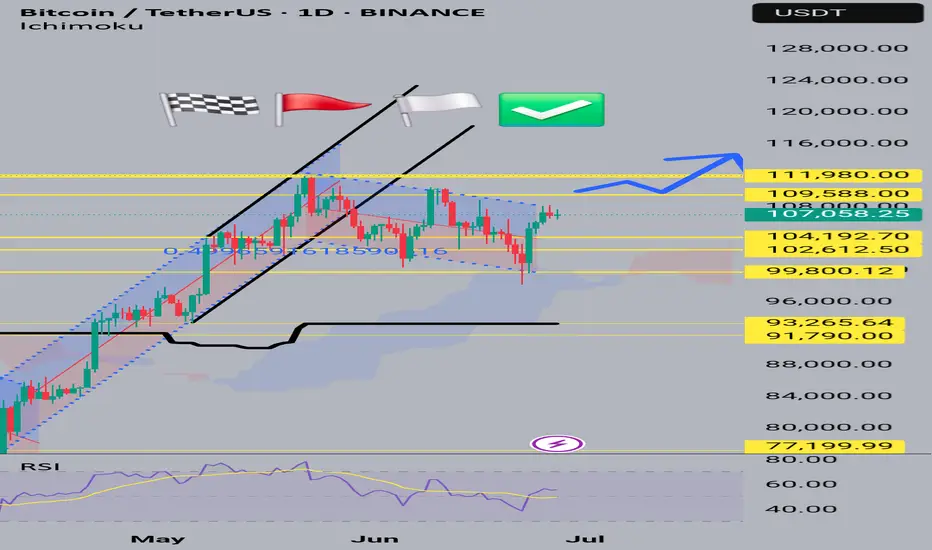
BTCUSDTHi snipers. On the one-day timeframe, we are witnessing the formation of a harmonic pattern called a flag. This pattern usually forms in the middle of a trend and then the previous trend continues. The flag consists of two parts: a bar and a flag. In the flag, the price is moving in a channel between two parallel lines. If the price breaks through and crosses the upper ceiling of the channel, we will probably reach new prices. I am practicing and learning. This is not a buy or sell offer.
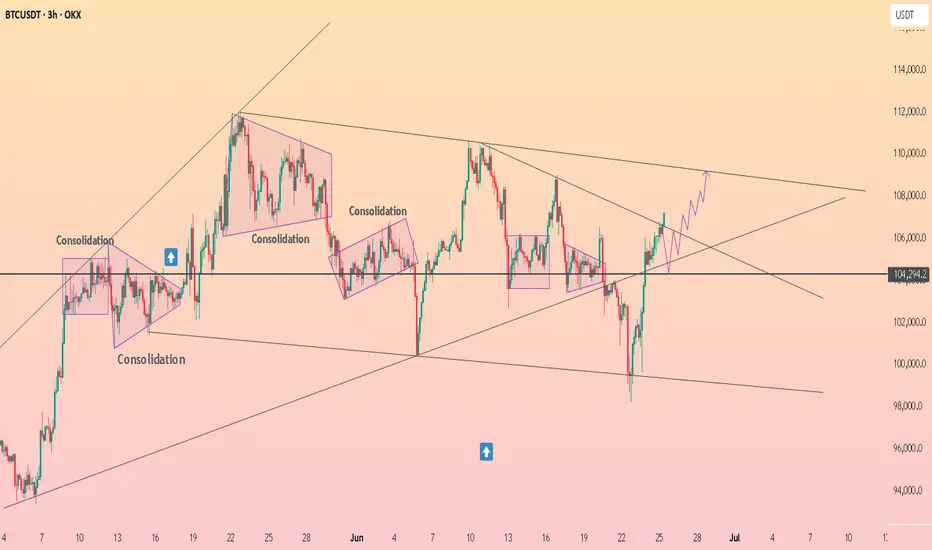
HolderStat┆BTCUSD broke the trend lineOKX:BTCUSDT on the 3h chart is accelerating from a breakout above $104,000 after several consolidation phases. Price is approaching $109,000 resistance. A breakout above this could trigger a run toward $112K+.
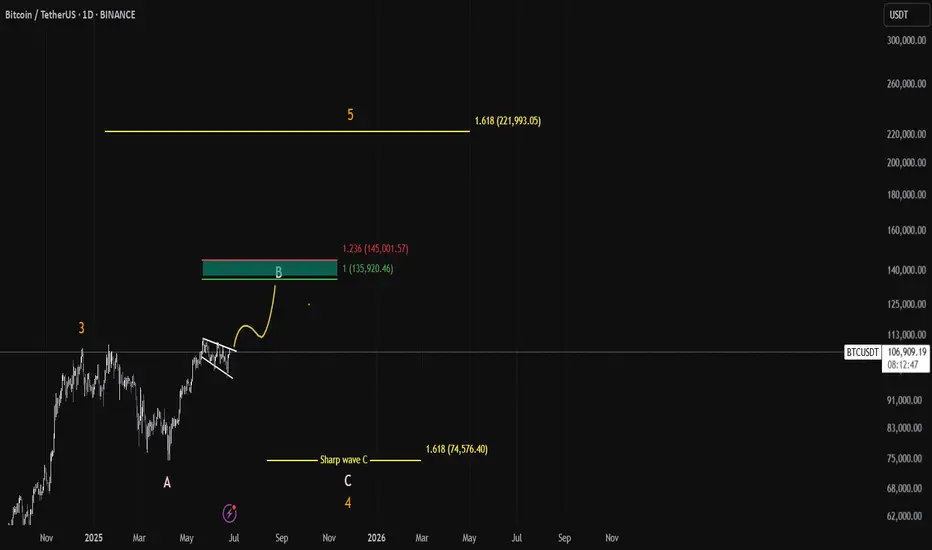
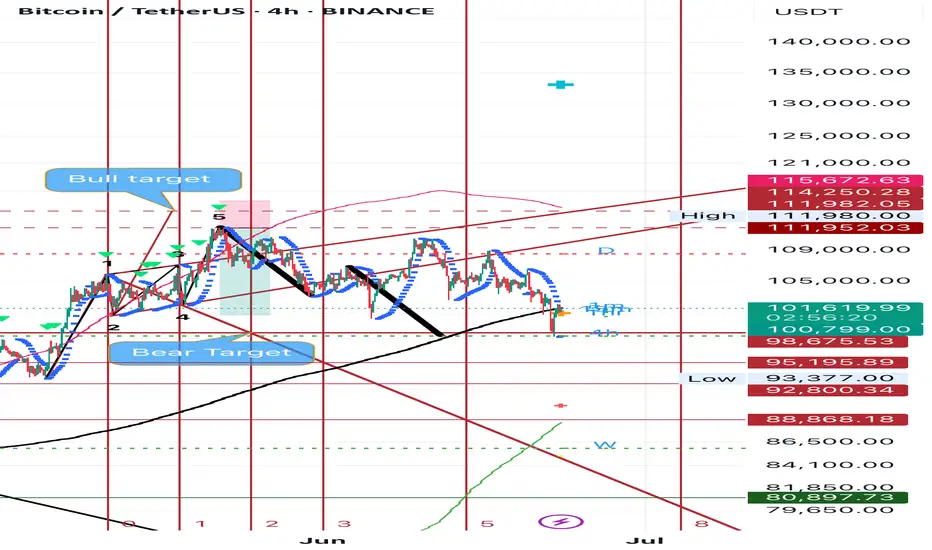
BTC trade plan🚨 BITCOIN – Eyeing $135K Before the Real Drop? 🚨
📆 Timeframe: 1D | Exchange: BINANCE
🧠 Elliott Wave Breakdown:
After completing Wave 3 near the $109K level, BTC entered a classic A-B-C correction.
We're currently breaking out of a bullish flag, hinting at the final leg Wave B rally still to come!
📈 Wave B Target Zone:
🎯 1.0 Extension: $135,920
🔴 1.236 Extension (Max Spike): $145,000
This zone is our “Red Box of Rejection”, where a strong reversal is likely as Wave C kicks in.
A sharp Wave C dump could target the 1.618 Fib extension at $74,576 — a textbook retracement level for deeper Wave 4 corrections.
That area would offer a generational buying opportunity heading into Wave 5, targeting above $220K+!
🚀 Final Wave 5 Target:
💥 1.618 Extension: $221,993+
BTCUSD scenario 1#BTCUSDT is bearish umtil 92k.
because of main trendline is break
the main flow is 535 correction in this scenario.

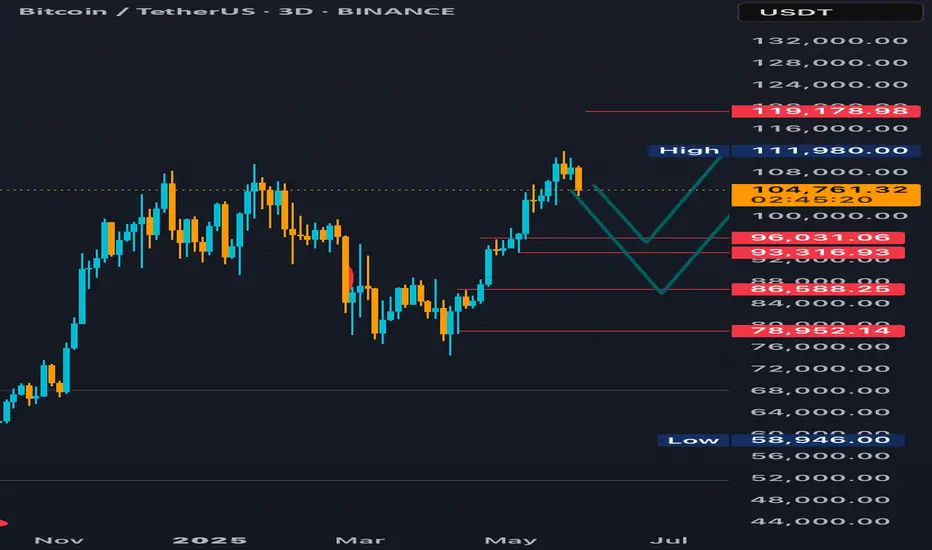
BTC Bitcoin: Where I'm buying this war crash. Buy in strategyBTC Bitcoin: Where I'm buying this war crash. Buy in strategy
We're in a buy zone right now but I'm looking for bullish divergences for entry. I'll add more if we start getting higher highs.
If we lose this zone, then I'm looking again around the 90k area.
I think this is a wonderful opportunity to get BTC under 100k.

BTC pressure, price under a lot of selling pressure💎 Update Plan BTC weekend (June 22)
Notable news about BTC:
Market overview: Bitcoin's consolidation lasts in the context of increasing macro instability
US President Donald Trump expressed his caution on Thursday when he delayed the decision involving a potential direct attack on Iran for a maximum of two weeks. The global market, including cryptocurrencies, has reacted, slightly increased in Asian and European sessions when investors absorb the impact of crude oil prices in the context of interrupted transport routes.
However, traders are very cautious, reflecting the tough stance of Fed President Jerome Powell on the economy, with the reason for the expectation of inflation in the short term due to tariffs.
Bitcoin -large holders continue to accumulate despite the cautious attitudes of traders on the spot and derivative markets.
Technical analysis angle
Bitcoin price fluctuates around $ 104.057 after cutting up the day from the peak of $ 106,457 of Friday. Main technical indicators, such as relative power index (RSI), strengthen the trend of discounts when the price slip down the average line 50.
Money Flow Index (MFI) indicator, monitoring the amount of money poured into BTC, shortening the trend of increasing, stable around the middle line. This reflects the limited interest in Bitcoin on both spot markets and derivative markets.
If the weakness of the Organizing Committee overshadows the demand on the chain and network activity, supporting the exponent dynamic line (EMA) 50 days at $ 103,169 can be helpful, temporarily absorbing the pressure of selling. Overcoming this level, high fluctuations can accelerate the decline, bringing the main levels, such as EMA 100 days at $ 99,085 and EMA 200 days at $ 93,404, in.
==> Comments for trend reference. Wishing investors successfully trading
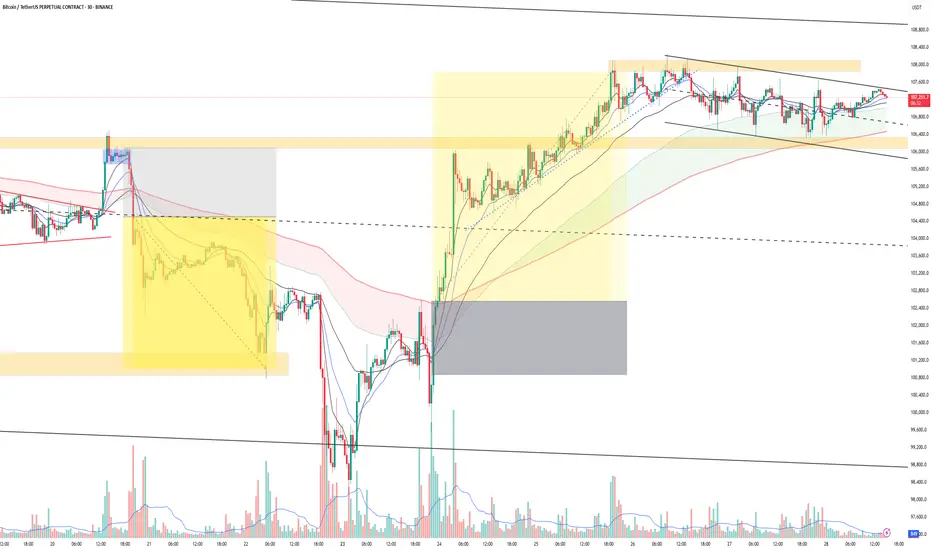
BTCUSDT 30min Breakout Watch | Micro to Macro AlignmentSummary
Bitcoin is showing a classic multi-timeframe confluence setup. On the weekly chart, BTC is holding above key EMAs with bullish continuation patterns. The daily chart shows a breakout from a descending triangle, while 4H and 30-min charts confirm a narrowing price wedge inside a larger compression zone. Momentum is rising, but volume remains subdued. A confirmed breakout above $108K may trigger a measured move toward $114K–$118K, while a breakdown below $105K could lead to deeper retracements.
BTC 30m chart forming a tight triangle with bull flag structure inside.
Price hugging EMAs, RSI ~52, Kalman flipped green, ADX ~23 = prepping for move. Breakout above $107.6K can push fast to $108.3K+. Breakdown below $106.6K weakens structure.
Scaling out
4H: Descending wedge with bullish RSI divergence, ADX rising, support at $104.5K.
1D: Breakout from falling wedge, reclaiming EMAs, but needs volume.
1W: Bullish flag breakout setup; EMAs aligned; RSI > 57, room to run toward $114K if $108K clears.
Watch volume confirmation across timeframes for trend validation.
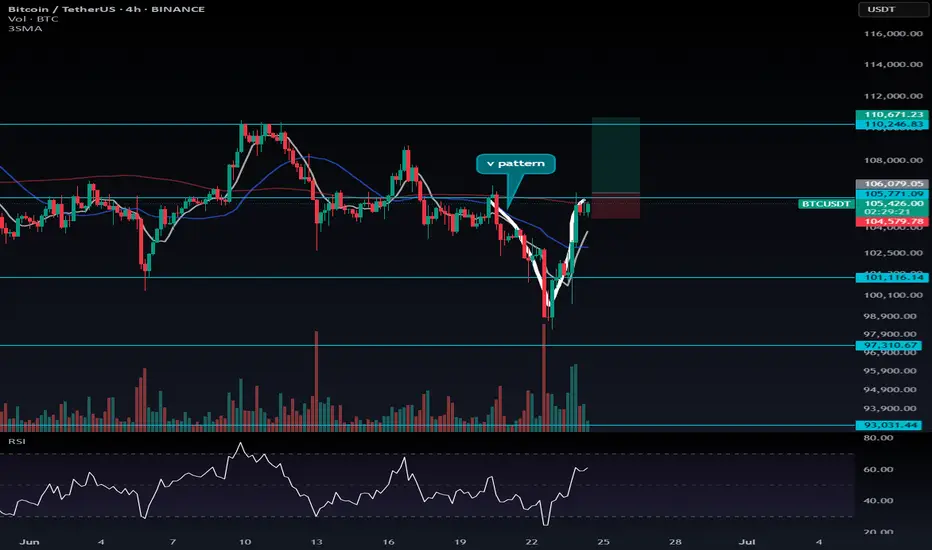
Potential Long Setup on BTC After Fakeout and V-Shaped Recovery🟢 Potential Long Setup on BTC After Fakeout and V-Shaped Recovery
After the fake breakdown around $101,116 and a strong V-shaped recovery, Bitcoin is showing signs of strength. If $105,771 breaks to the upside, a long entry with a stop at $104,579.8 could be a solid setup.
Keep in mind:
This long position should be taken with the bigger picture in mind — if BTC breaks $110,246.8, it might be much harder to catch a position then. So it's wise to already be in the market.
📌 Important note:
Don’t take heavy risk just yet. Skip taking profit (TP) on this one for now, but size your position cautiously. If the market confirms a trend later, you'll have more room to enter altcoins with higher conviction.
---
💬 What’s your take on this V-recovery? Are you entering early or waiting for more confirmation? Let me know in the comments!

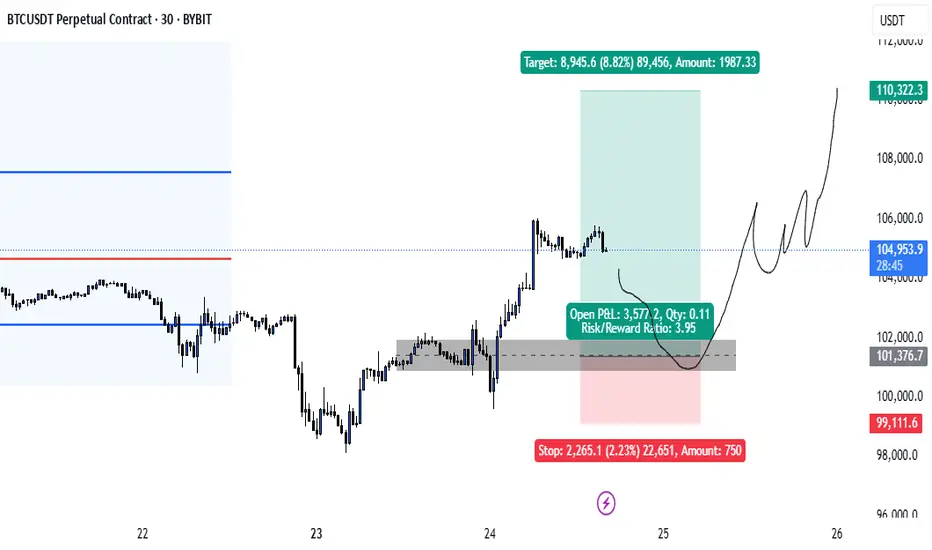
BTC Long to 110kDue to the ceasefire from Iran and Israel a bullish retracement scenario can observed on the market.
Measured move target madePrice bounced near the target and has been confirmed by the 4 hour SAR.
The 4 hour SAR is currently on a bearish retrace relative to the daily SAR.
As long as the Daily SAR is above price, the bearish Wolfewave is still in play.
Price is anticipated to go lower than what the 4 hour SAR has established as support.
To see more details and for faster movement, we look to the shorter intervals.
Shorter interval price action could invalidate longer interval patterns.
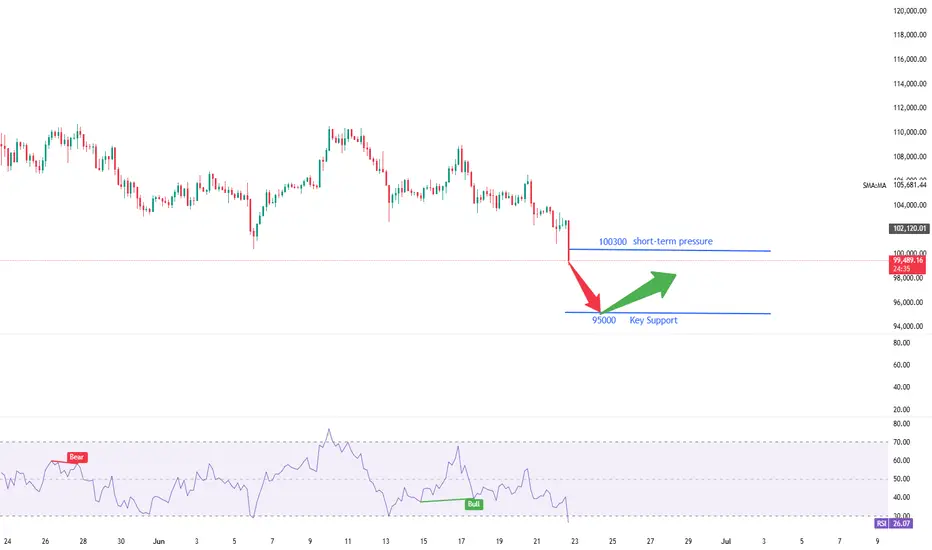
Need to wait for the key turning point.The Bitcoin market has currently broken below the key support level of 100,300, confirming a downward trend reversal. A daily-level recovery rally is now underway, and the 4-hour wave structure has not yet concluded. First, the downside target is seen at 95,000 to 98,000. Next week, the key turning point at 92,000 will likely determine the low of a rebound. Although this rebound low is not the ultimate bottom, it will trigger a relatively strong rebound after formation.
you are currently struggling with losses,or are unsure which of the numerous trading strategies to follow,You have the option to join our VIP program. I will assist you and provide you with accurate trading signals, enabling you to navigate the financial markets with greater confidence and potentially achieve optimal trading results.
Trading Strategy:
buy@95000-95500
TP:97500-98000
btc my weekly analysis for the btc move insha allah btc shows as big opportunity dirrection toward sell or bear position at the price of 99k
Btc usdt 1-3-6-12 mouthAnalysis of Bitcoin's movement for the near future. For 1-3-6 months. Based on candlestick and technical analysis

BTC next bull runBTC is expected to undergo a short-term retracement before reigniting its bullish momentum and advancing toward new highs
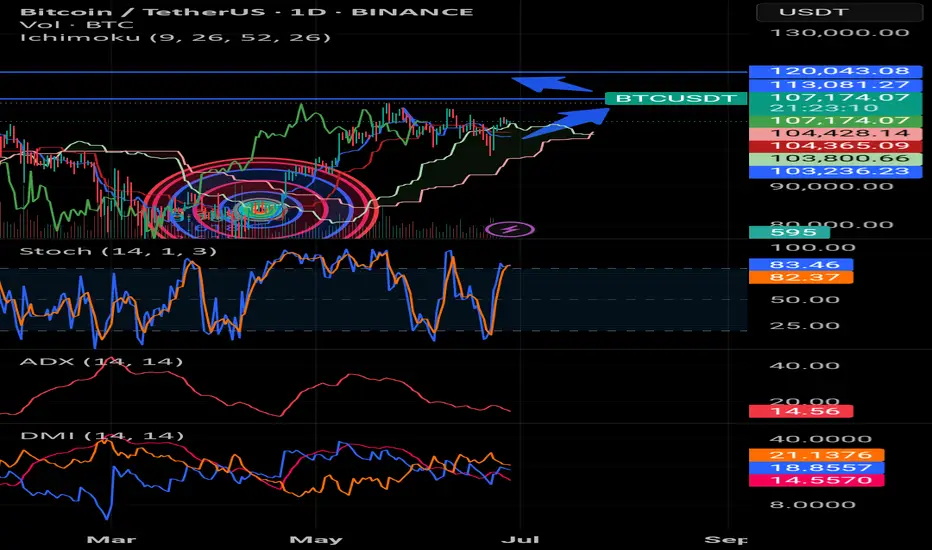
BTC UP OR NO📈 Bitcoin to Reach $113K, With a Breakout Path to $120K – A Professional Outlook
After analyzing the macro trend, technical structure, market sentiment, and on-chain behavior, I strongly believe that Bitcoin is on a clear trajectory toward $113,000, with a potential extension to $120,000 if key resistance is broken.
---
🔍 1. Technical Analysis Perspective
Macro Bullish Structure: Since the 2022 bear market bottom, Bitcoin has maintained a consistent higher highs and higher lows pattern, confirming a long-term uptrend.
Fibonacci Extension: The 1.618 Fibonacci extension from the $15.5K bottom to the $69K peak gives a projected target of around $113K.
Historical Fractal Patterns: In previous cycles, Bitcoin has always broken past previous all-time highs by 1.5x to 1.75x, placing this cycle's peak in the $110K–$120K range.
Ascending Triangle Breakout: On the weekly chart, BTC is forming a bullish ascending triangle with the top resistance at ~$73K. A confirmed breakout targets $113K as the next major supply zone.
---
🧠 2. Market Psychology & Cycle Timing
Halving Effect: Historically, Bitcoin peaks occur 9–12 months post-halving. The most recent halving was in April 2024, aligning a potential peak by Q1 or Q2 of 2025.
Psychological Resistance Zones: The $100K–$113K range is not only a Fibonacci target but also a powerful psychological barrier. Once breached, FOMO and institutional momentum could push BTC rapidly to $120K.
Retail vs Institutional Flows: Data shows increased ETF inflows and long-term holder accumulation — a classic pre-peak indicator.
---
🔗 3. On-Chain and Whale Behavior
Realized Price vs Market Price: BTC market price is well above long-term holder realized price, signaling bull market phase 2 (the steep climb).
Dormant Supply: Over 70% of BTC has not moved in 6+ months, showing strong holder conviction. This reduces sell pressure as price increases.
Whale Accumulation Zones: Whales are heavily positioned around $60K–$65K, and there is minimal sell volume above $100K on major exchanges, opening the path to $113K with low resistance.
---
🚀 Conclusion:
> Based on comprehensive technical patterns, market structure, psychological phases, and on-chain behavior, Bitcoin is highly likely to reach $113,000.
If momentum continues and $113K is breached with volume confirmation, a sharp move toward $120,000 becomes not only possible — but likely.
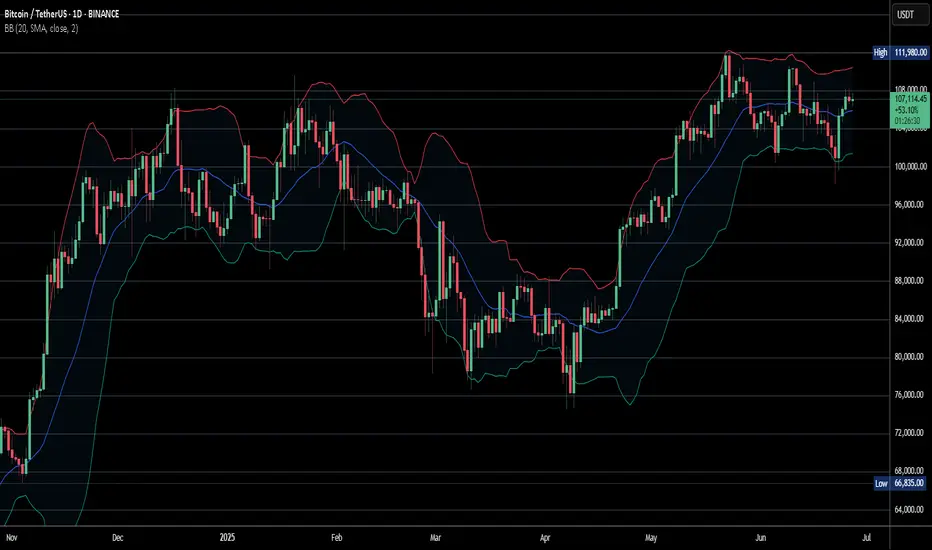
Sharing the advanced Bollinger Bands strategyHere are the Bollinger Band trading tips: *
📌 If you break above the upper band and then drop back down through it, confirm a short signal!
📌 If you drop below the lower band and then move back up through it, confirm a long signal!
📌 If you continue to drop below the middle band, add to your short position; if you break above the middle band, add to your long position!
Pretty straightforward, right? This means you won’t be waiting for the middle band to signal before acting; you’ll be ahead of the game, capturing market turning points!
Let’s break it down with some examples:
1. When Bitcoin breaks above the upper Bollinger Band, it looks strong, but quickly drops back below:
➡️ That’s a “bull trap”—time to go short!
2. If Bitcoin crashes below the lower band and then pops back up:
➡️ Bears are running out of steam—time to go long and grab that rebound!
3. If the price keeps moving above the middle band:
➡️ Add to your long or short positions to ride the trend without being greedy or hesitant.
Why is this method powerful?
It combines “edge recognition + trend confirmation” for double protection:
1. Edge Recognition—spot the turning point and act early.
2. Trend Confirmation—wait for the middle band breakout and then confidently add positions!
You won’t be reacting after the fact; you’ll be ahead of the curve, increasing your positions in the trend’s middle and locking in profits at the end. This is the rhythm of professional traders and the core logic of systematic profits!
Who is this method for?
- You want precise entry and exit points.
- You’re tired of “chasing highs and cutting losses.”
- You want a clear, executable trading system.
- You want to go from “I see the chart but don’t act” to “I see the signal and take action.”
Follow for more. Make sure to like this if you found it useful.
BTC SELLIn higher Time Frame Poi zone Tap and Nd Also Liquidity Swift in that zone I plan to sell here first Target 106000.
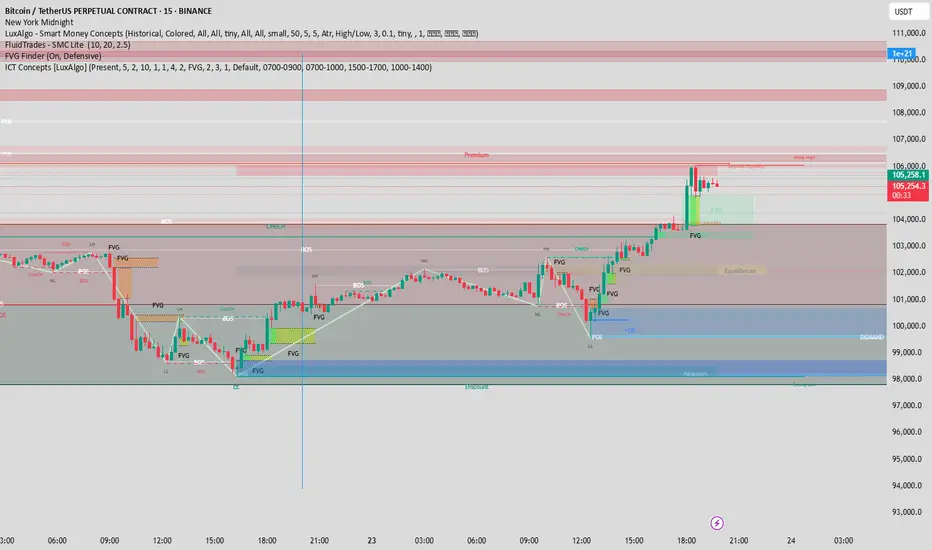
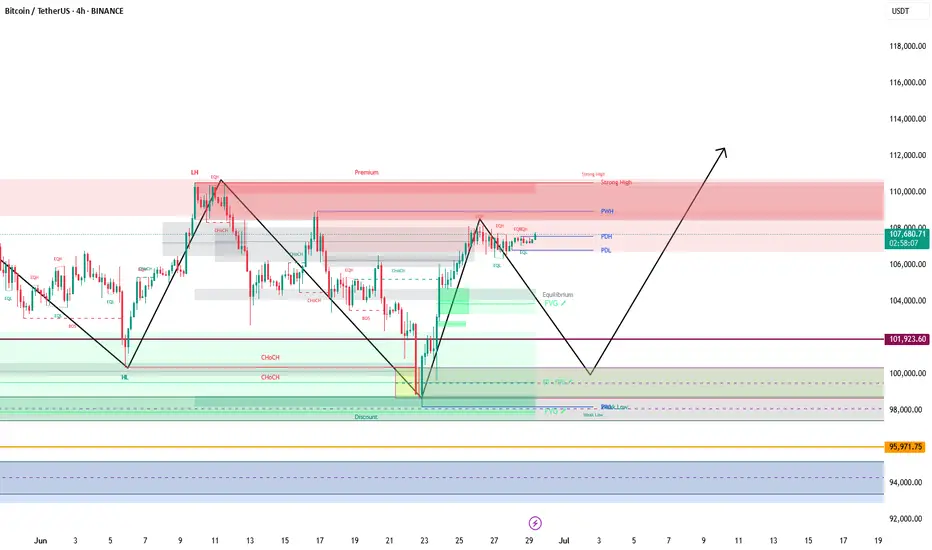
Breakdown: BTC/USDT 15m – Riding the Trend
🔹 Smart Money Confluences:
CHoCH at the bottom with a clear liquidity sweep (LL formed, then reversal)
Multiple FVGs aligned with structure—price keep respecting mitigation blocks
POI + OB near $99,800 gave the final long confirmation
BOS and strong HHs show clean bullish order flow
🟩 Premium/Discount Zones:
You entered at da discount, targeting premium—textbook ICT
Midline equilibrium held nicely before bullish continuation.
💡 Final Push:
Price is consolidating under weak high and buy-side imbalance.
Possible continuation if new FVG near $105k holds
🔔 Watch for:
Higher timeframe liquidity grab above $106k
Rejection near inefficiency = potential partial TP zone