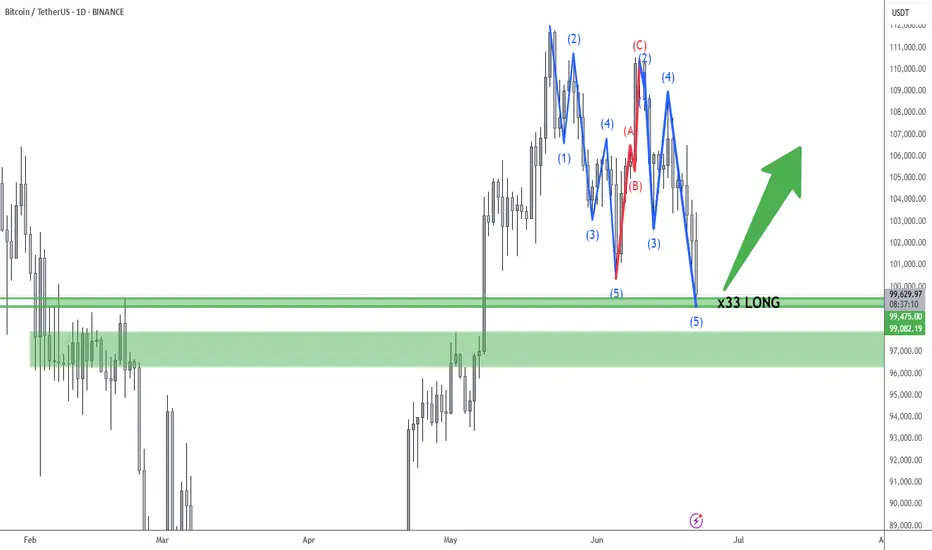
Long on Bitcoin. Bullmarket ahead!🚀 Entering a Degen LONG Position
I'm taking a calculated long here, with the 99.5k level acting as a key support zone.
✅ We’ve just swept the previous wick lows, grabbing a significant amount of liquidity that was resting below.
✅ The market has likely completed a clean ABC correction, with a nicely proportioned A = C structure — textbook move.
🧠 From a macro perspective:
The Iran war narrative appears to be fully priced in. At this point, only an extreme escalation (e.g. nuclear) could trigger a deeper selloff.
However, current geopolitical tensions may actually fuel bullish sentiment, as they give the FED more justification to pause or cut rates — a catalyst that could ignite the next impulsive leg of this bull market.
🤞 Fingers crossed — let’s see this rocket lift off.
BTCUSDT.3L trade ideas
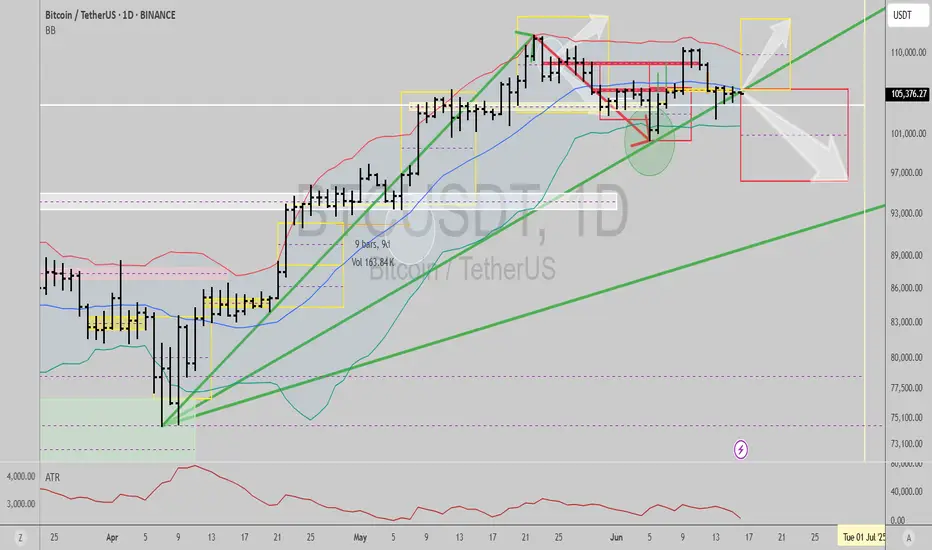
$BTCUSD: Bull or bear?Choose your adventure gents...
If price breaks up today, it can ignite a daily timeframe trend signal pointing to a rally towards 114k within a few days.
If it breaks down, it will hit 96k within the next two weeks.
I've taken steps to reduce risk but I still trade futures actively in crypto pairs. There's good alpha in my long/short trading system and screening criteria, so I am comfortable trading it actively.
Current techo/fundamental juncture is risky, the way I see it, so if you haven't, maybe consider taking some profits, getting rid of leverage, trailing stops higher, etc.
Definitely not a time to be complacent with record exposure to US stocks from the public and foreigners, Gold hitting levels where it can purchase the same $ in real estate as in previous tops (1980, 2011), and companies buying into crypto to pump their failing business' stocks...to name a few red flags. There's some merit in long term bullish variables, but we might face some technical difficulties before that can materialize, and I rather be prepared by reducing risk in my long term exposure and max drawdown tolerance variables in my positioning and general strategy.
Best of luck!
Cheers,
Ivan Labrie.
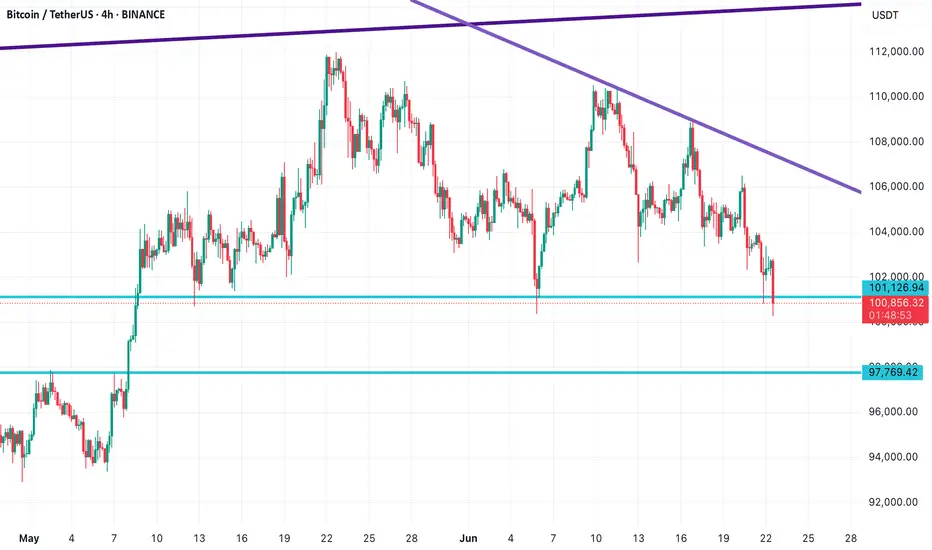
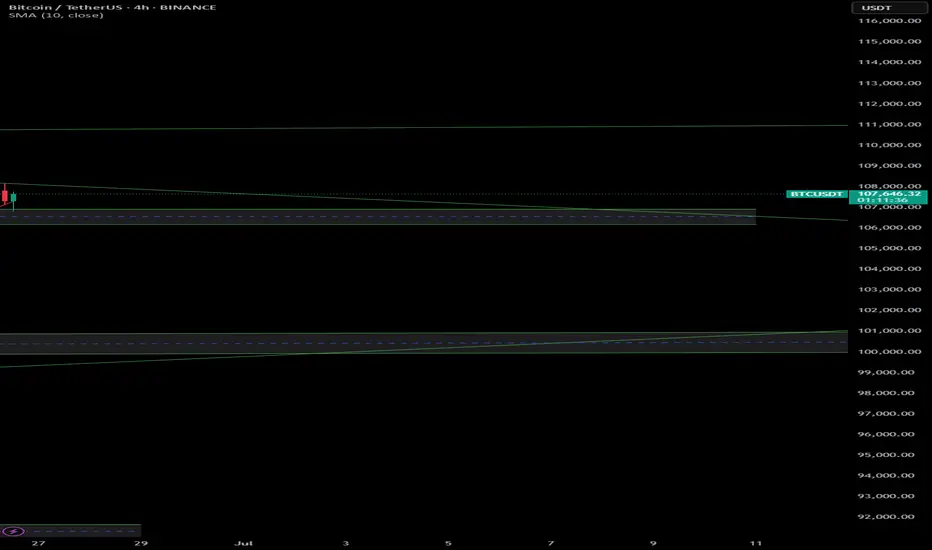
Bitcoin Technical Analysis | Critical Support Zone in 4H Timefra📉 Bitcoin Technical Analysis | Critical Support Zone in 4H Timeframe
Bitcoin is currently testing a major support zone at $101,126, but bearish pressure remains high.
⚠️ If bulls fail to hold this level and no strong candle closes above it, we could see a further drop toward the $97,769 and $96,475 support zones.
However, if Bitcoin manages to bounce from here and begins a recovery, make sure to watch the descending purple trendline – a key resistance level that could slow down the upside.
🧭 The support and resistance levels drawn on this chart are highly reactive zones — use them to plan your trades and set smart entries and exits.
👉 Follow for more clean and actionable setups on BTC, ETH, and major crypto pairs!
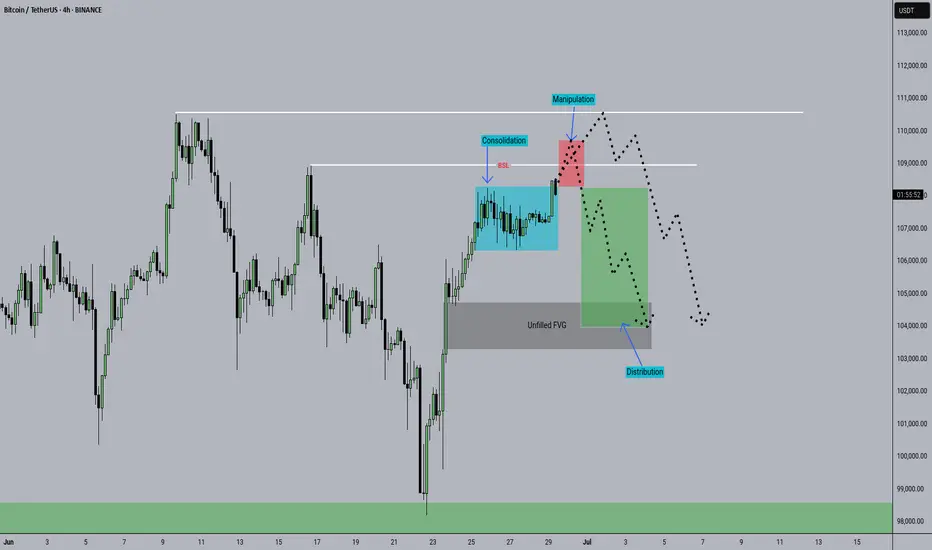
BTC to sweep liquidity?4 Hour Analysis:
- Market moving out consolidation phase (Accumulating late buyers)
- May sweep the 1st buyside liquidity (see chart)
- Or may sweep the ATH above the 1st buyside liquidity (see arrow on the right of the chart)
VSA vs BTC: Into a Bearish Scenario or Not?Predicting the market requires skill.
Most traders fail at one crucial point: they don’t see the market as a living, breathing organism—a structure where one move leads to another, like cause and effect in motion.
That’s what we often call reading the psychology of the market. When you begin to grasp the fundamental principles behind that, you step into the realm of elite traders.
And yes—Volume Spread Analysis (VSA) is a powerful tool, but only if you know how to read it properly.
I’m not a certified trader or financial advisor, and I don’t give signals, entries, or exits. I’m simply a solo observer, sharing a slice of what true technical and fundamental analysis looks like.
And yes—it takes time. It takes skills. Now, if we want to even attempt predicting the future of price action, we must understand something: A chart is not a single truth. It’s a battlefield of conflicting signals.
Patterns, marks, levels—some suggest bullish continuation, others hint at sharp reversals. Confusion is inevitable if you don’t learn to distinguish which signs matter.
In our current BTC chart, we’re witnessing this contradiction unfold clearly:
• A bullish flag formation...
• Yet within it, the emerging completion of a Head & Shoulders pattern!
How arrogant can the market be! 😄
A moment to laugh—but also a moment to observe how cleverly the crowd is misled.
This is classic manipulation, wrapped in a textbook setup.
But what’s most telling isn’t the pattern on the surface—it’s the volume beneath the structure.
It’s always the quiet details that speak the loudest.
Before price shows its true face, volume often leaves footprints. In our case, those footprints were already leading toward a bearish path—long before the structure began to shape itself clearly.
So while retail eyes focused on the bullish flag, the underlying volume had already begun withdrawing support.
Not aggressively—no. Subtly, almost elegantly, in that familiar way institutions mask intention:
• Spikes that don’t hold
• Buying that doesn’t follow through
• And a steady fade in commitment as price climbs into weakness
It’s in those quiet inconsistencies where VSA earns its value.
It tells us: the move isn’t about what’s obvious.
It’s about what never fully materialized.
So yes, the pattern may still remain incomplete. The Head & Shoulders may yet fail to validate.
But for those who were watching volume first—not structure—the script was already being written.
✒️ From now on, professionally speaking, we must still wait:
• For the Head & Shoulders to confirm or dissolve. So eyes targeted at the swing low level near 107k
• And for volume to either legitimize or invalidate the entire setup
Only then does the chart grant us permission to speak in certainties.
🐾 But so far…
• The clues have favored the bears.
• Sell opportunities appeared early and often—for those who know what to look for.
• Bullish spikes in volume? They were met with silence.
• Momentum fizzled under a macro backdrop of fading demand.
If you were in the right mindset, and aligned even the lower timeframes to basic structural zones,
you already saw the path ahead wasn’t being carved by the bulls.
Let them finish the patterns.
Let the candles paint the story.
But for those trained in volume, the ink has already dried.
And if you're still reading, maybe you already sense it—
real insight doesn’t shout, and it never floats in abundance.
Value has never been about noise. It’s about what’s rare, quiet, and overlooked by the crowd.
Just like in the markets—the true signals aren’t loud, and they’re never free in the economic sense.
Just as price rises where supply thins, the same applies here:
what’s scarce... holds weight.
PS For last A little exercise, something to grasp on. Have you noticed how Volume & RSI behaves in lower time frames? 4Hour or 1Hour for example. Can you identify how volume confirms a bearish move. Do you discover the correct correlation and combined use between VSA & RSI. Remember my previous insight
See you next time!

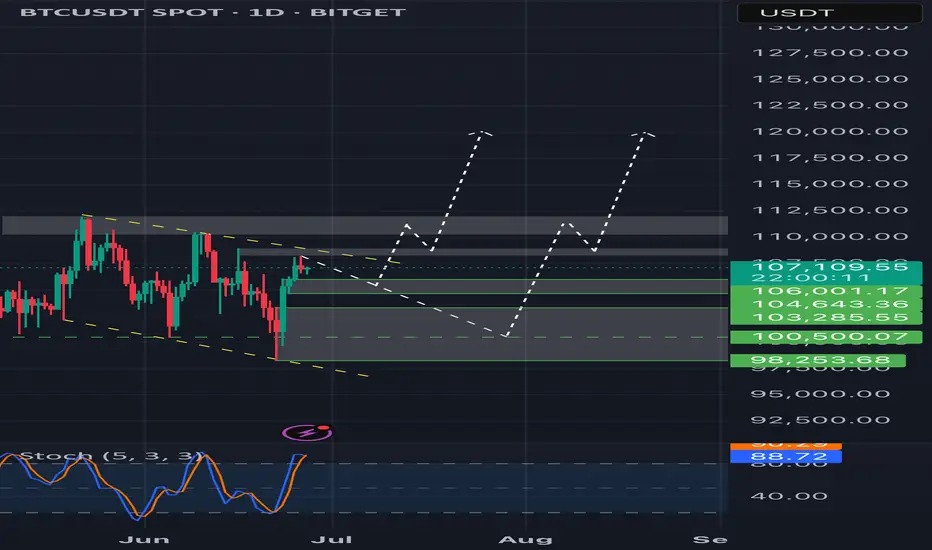
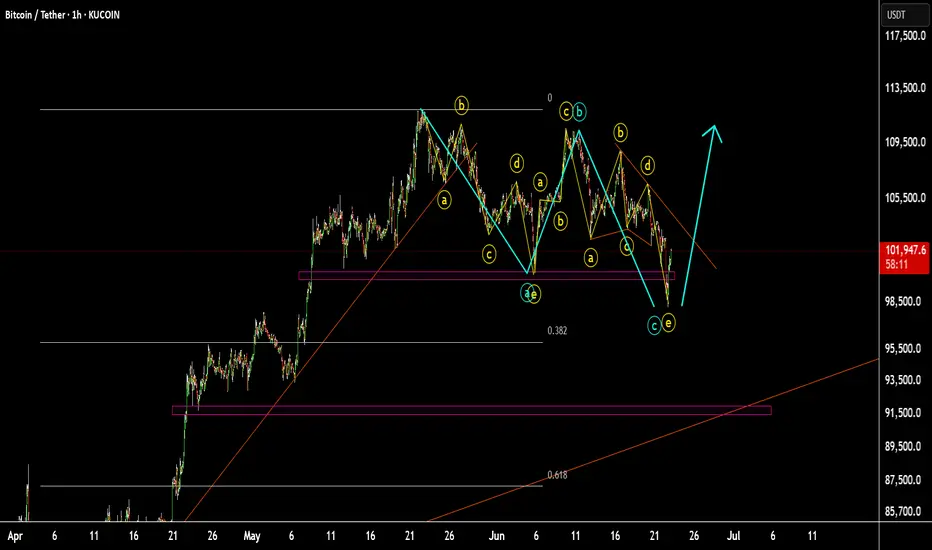
Forecast for BTC. New ATH on July ? In my opinion , BTC have 2 scenario .
1. Price will retest area 104-106k and retest previous ATH and then go up
2. Price will retest area 98-104k and retest previous ATH and then go up
3. In my opinion , BTC will not go down below 100k .
Now BTC can make a bullish flag pattern , but not valid yet
But anything can happen , so DYOR
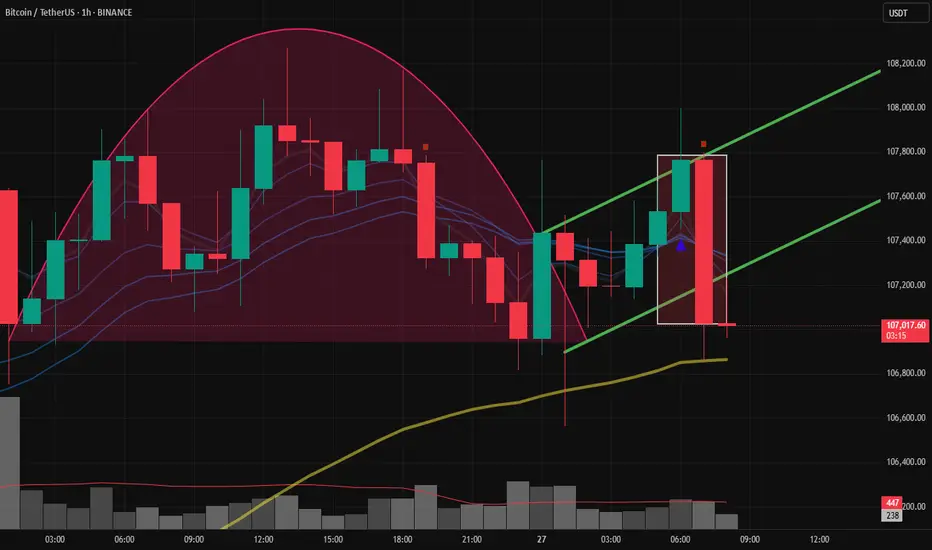
bearish engulfing candleA bearish engulfing candle is a two-candlestick pattern in technical analysis that suggests a potential reversal of an uptrend to a downtrend. It consists of a small bullish (white or green) candlestick followed by a larger bearish (black or red) candlestick that completely engulfs the body of the first candle. This pattern indicates a shift in market sentiment, with selling pressure overpowering buying pressure and potentially leading to lower prices.
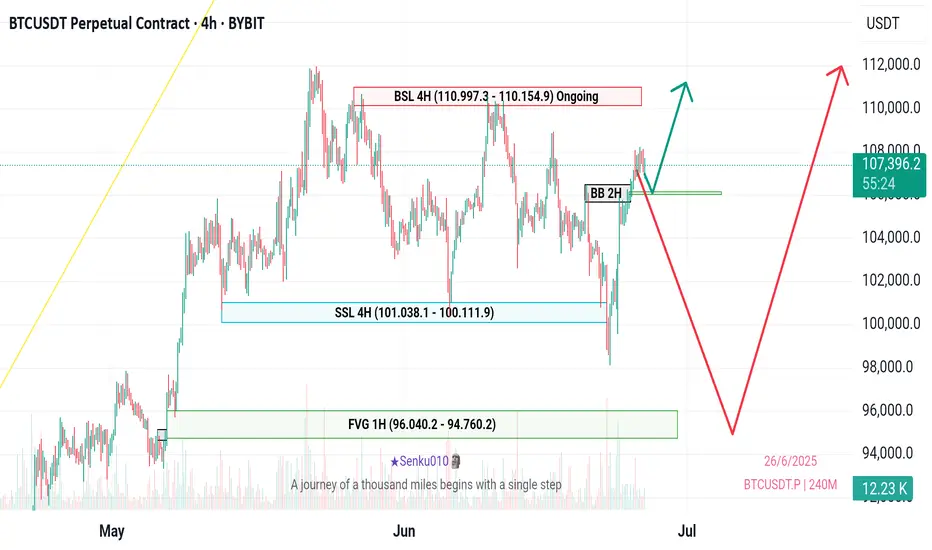
BTCUSDT: Bullish Outlook Following Liquidity Sweepnavigating around pivotal areas defined by Breaker Blocks (BB) and Fair Value Gaps (FVG) on both the 1-hour and 2-hour charts. These zones represent high-probability areas for market reactions, whether as support for continuation or as points for potential short-term retracement before a larger rally.
strongly favors a bullish continuation for BTC. monitor interactions with the identified BB/FVG zones for optimal entry points, anticipating a potential dip to sweep short-term BSL or mitigate imbalances before the next significant leg up.
Title: BTC at the Upper Trendline – Breakout or Breakdown IncomiTechnical Analysis (4‑Hour Timeframe)
🔺 Upper Trendline Resistance: BTC is touching the upper line of a descending channel—firm resistance around 107.5k–108k.
📉 Bearish Pressure: Failing to break out here could trigger a downward move.
🔻 Key Support: A decisive break below 99.5k–100k opens the path to 98k–95k, and potentially down to 92k if trend weakness persists
🔺 Bullish Scenario: If BTC closes above 108k on 4h, it could rally toward 110k–112k
binance.com investopedia.com binance.com
.
Geopolitical volatility (U.S.–Iran/Israel tensions) drove BTC briefly below 99k, low of 98.2k, before bouncing back near 101.2k
Volume & momentum: RSI dropped with the dip; watching volume near critical levels like 107k–108k is key
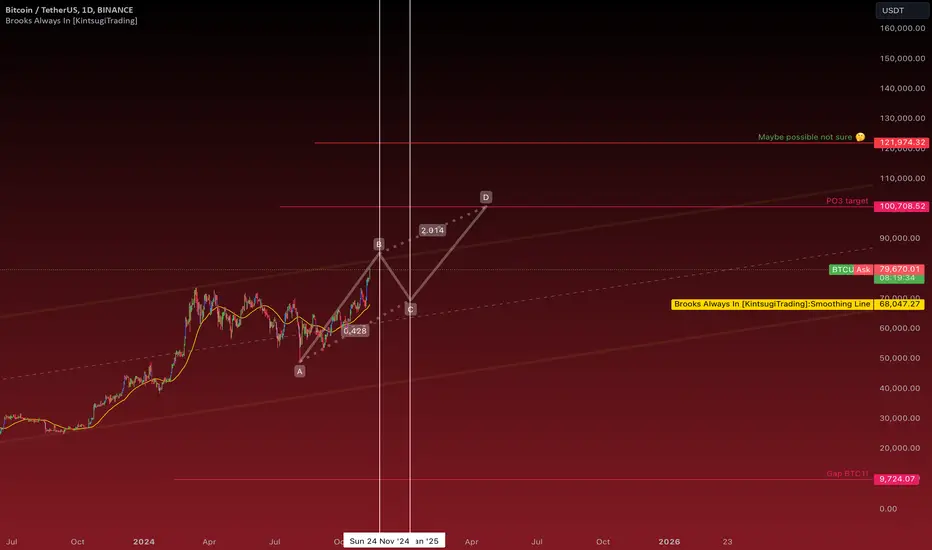
BTC midterm plan possibility
The current Bitcoin chart shows a P.O.3 pattern formation. Looking at the price targets, we can see a clear path to $100,000, which stands as a major psychological price level. The ongoing A-B-C pattern structure supports this price movement. If Bitcoin successfully breaks through the $100k level, we could potentially see an extension to around $120,000. After January, there's a strong possibility of a bullish trend that could help reach these targets, though this remains speculative and uncertain. Market movements depend on various factors, so always do your own research before making any investment decisions.This is one of the scenarios.Other way is going beyond 85k strongly and make pull back or continuation pattern (sideways)after that reach 100k.
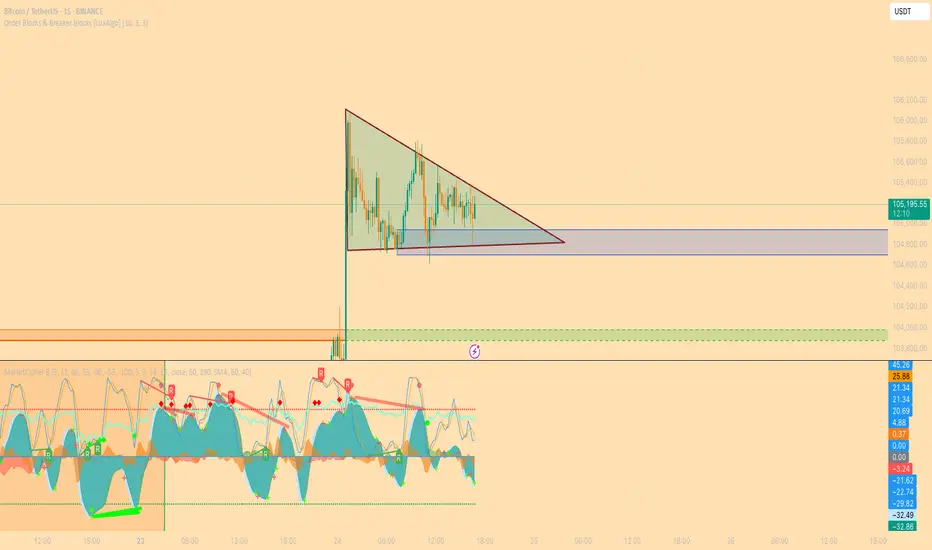
15 Min Bullish BTC pennant 15 minutes before POWELL testimonySelf-Explainatory. let's see if this LTF pennant works!
Bitcoin Holding Above $100K – Bullish Bias IntactIn my previous analysis, I mentioned that a daily close below $100K would trigger a short bias. However, price closed above the $100K level, sweeping liquidity and rejecting the downside.
This move invalidates the bearish setup and confirms a bullish continuation. Market structure remains intact, and we're now looking for potential long setups on retests or pullbacks.
Key Points:
Liquidity sweep below $100K
Daily close above key support
Bullish structure remains valid
Watching for continuation targets and retests
📍 Stay patient and follow price action. Structure never lies.
#BTCUSD #Bitcoin #CryptoAnalysis #LiquiditySweep #BullishContinuation #PriceAction #TechnicalAnalysis #TradingView #CryptoTA
BTCUSDT Update — Big Macro Forces In Play!!Hey Traders!
If you’re finding value in this analysis, smash that 👍 and hit Follow for high-accuracy trade setups that actually deliver!
Bitcoin once again testing key support levels as global tensions continue to fuel uncertainty in the markets.
Chart Overview:
BTC broke down from short-term resistance and is now retesting the major support zone between $102K–$103K. The structure still remains within a broader consolidation range, but this support zone is absolutely critical for bulls to defend.
Immediate Resistance: $106K → $110K
Immediate Support: $102K → $100K
A breakdown below $100K could trigger deeper liquidations towards $95K–$98K, while a successful defense here could push BTC back toward previous highs.
Geopolitical Impact:
Global headlines are heavily influencing risk assets right now:
🇮🇱 Israel-Iran tensions are escalating.
🇺🇸 The US is signaling stronger involvement diplomatically, adding more fear to markets.
📉 Traditional markets have already started to show signs of caution.
Bitcoin, as a risk asset, remains vulnerable to these global macro shocks in the short term.
The Game Plan Right Now:
If we see sustained support at $102K–$103K, there’s still room for a relief bounce towards $106K–$110K in the near term.
However, if global tensions escalate further, expect increased volatility with downside liquidity grabs.
Stay cautious with tight risk management. Macro headlines are still driving sudden sentiment shifts.
📊 My Bias:
Watching for potential sweep of $102K with possible reversal structure forming. Any clear reclaim of $105K may signal a local bottom.
📝 Key Takeaway:
Global narratives are bigger than technicals right now. The next few days could dictate whether BTC holds or faces another sharp liquidation event.
Stay patient. Stay disciplined. And most importantly: manage your risk.
👉 Follow for more real-time updates as we track both price action and macro headlines impacting crypto.
BTCUSD scenario 2#BTCUSD scenario 2 is waiting for 3 (TOP) High and then start to move down again.
scenario 1 is ZIGZAG pattern.
I dont buy at this time.
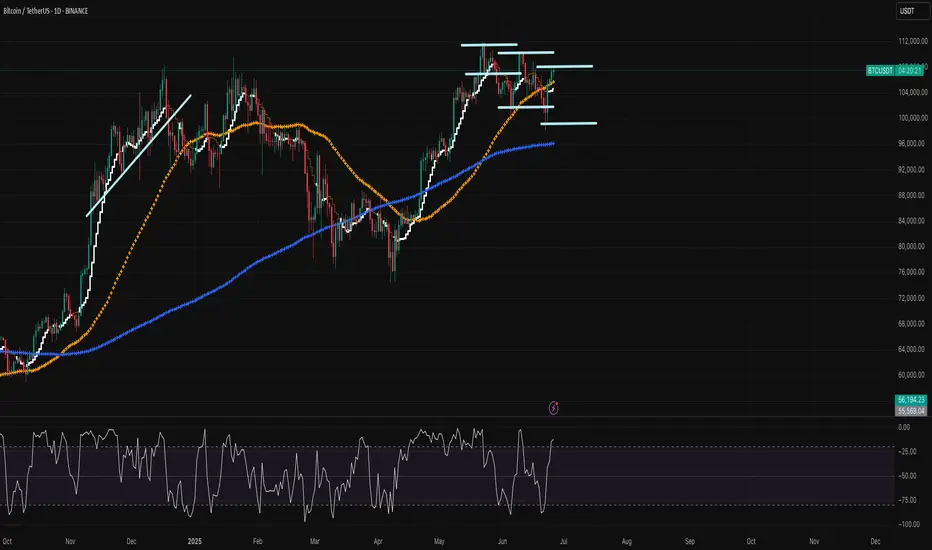
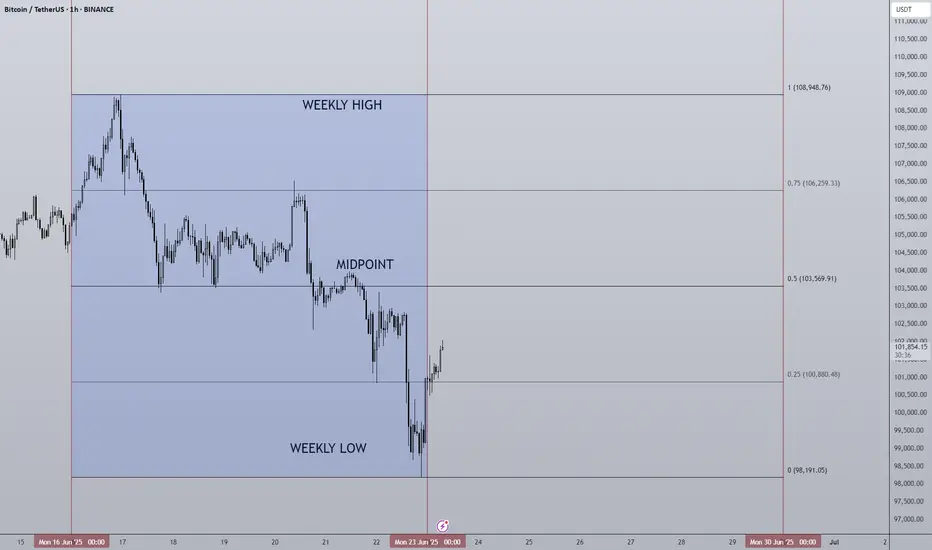
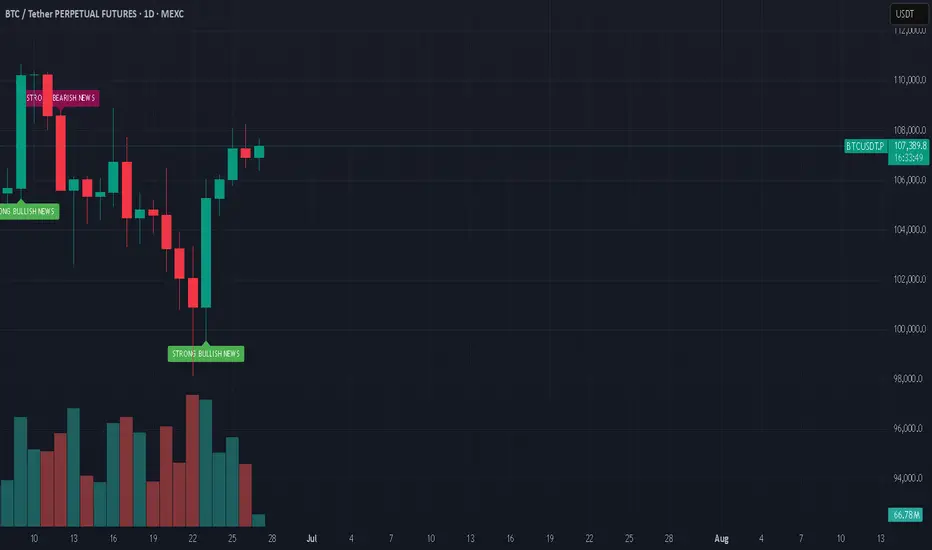
23/06/25 Weekly OutlookLast weeks high: $108,948.76
Last weeks low: $103,569.91
Midpoint: $98,191.05
Last weeks chart is a clear reflection of what happens when there is a constant stream of bad news... Geo-political escalations, America becoming more involved in the Middle-east and the FED refusing to cut interest rates.
It's well known markets do not like uncertainty, and throughout the week more and more questions have been asked with very few answers. Risk-on assets have taken a hit generally and BTC is no different, especially over the weekend. This price action should be taken with a pinch of salt as the volume is never as high as it is during the week and often it paints a false picture of how the market really feels. The market makers ultimately are just, over the weekend they often aren't involved and so I think we will know more accurately how much of this geo-political escalation is priced in by the end of the trading day. How the SPX reacts will be important too.
The FED once again refused to cut interest rates, it's clear president Trump is not happy with this. The market could have done with a cut but that will have to wait.
So for Bitcoin it's been a tough week and I can't see this getting better immediately. Bearish price targets for me would be $97,000, the short term trend is clearly biased short until some solid support comes in or something drastic happens in the political world for good. This week is about survival and caution while looking for opportunities to present themselves without knife catching.
Good luck this week everybody!
Bitcoin StructureBTCUSDT — day
Now we clearly respect the supply zones . The price has already beaten off the zone twice, and there is no desire to go higher yet.
Also by structure:
There was an explicit Break of Structure, then Market Structure Shift (MSS) - impulse change
Below in the region of 93k - the discount zone, where there is a large liquidity (according to calculations - stops by about 17 billion)
→ Continuation of the rollback down
→ Liquidity collection from 93k
→ And only after that a possible turn up
❗️So far, I'm only looking for shorts from the offer zones - on junior TF, with confirmation on 4H.

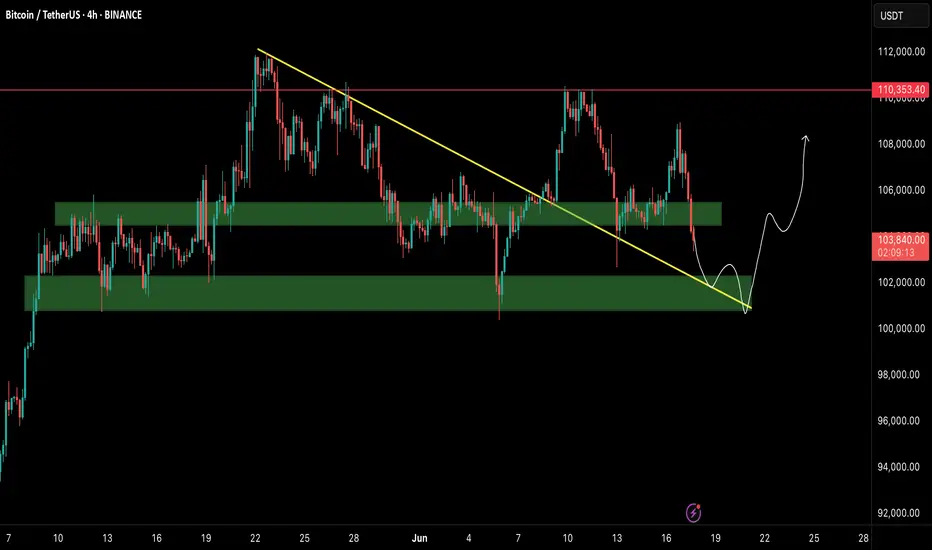
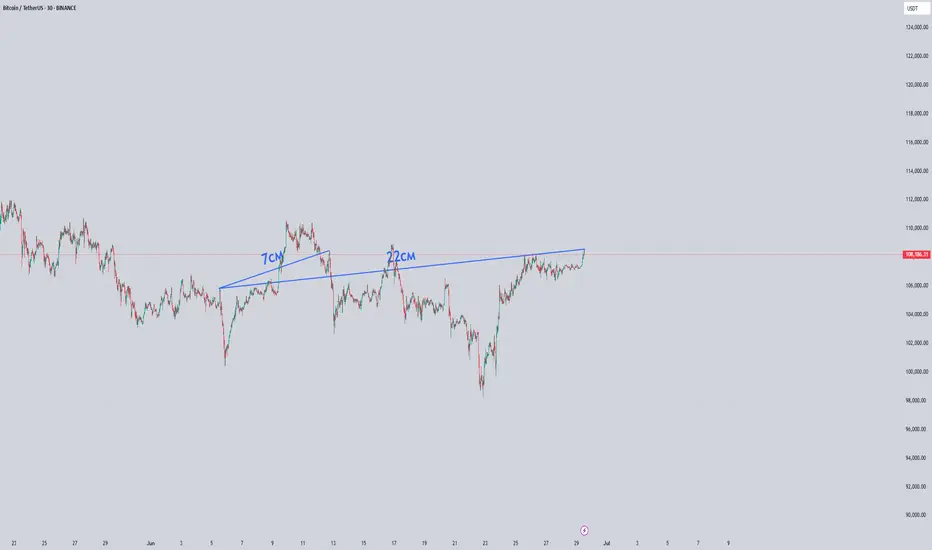
The Pattern That Could Launch BitcoinSpotted a long-term inverted head & shoulders pattern forming over a 7–8 month stretch on Bitcoin — much more reliable than short-term setups. If this bullish structure plays out, we could be looking at a breakout that pushes BTC firmly into price discovery.
I’ve included local Fibonacci levels on the chart, though I couldn’t fit the macro one (going from $4k → $69k → $15k — the 1.618 extension of that larger swing lands at $119,800. That could be a key resistance target if we clear the ATH and continue the uptrend. After that, there's the smaller timeframe, but more recent, fib ext 1.618 sitting at $131k.
I'd be very cautious of a failed pattern if $101k doesn't hold. As a last support, 95k and the red 20EMA might hold.
Let’s see how this plays out 🚀

2/1/15I promised to update the idea of what will happen with the graph in the future. At 22 cm, we should now fall down.
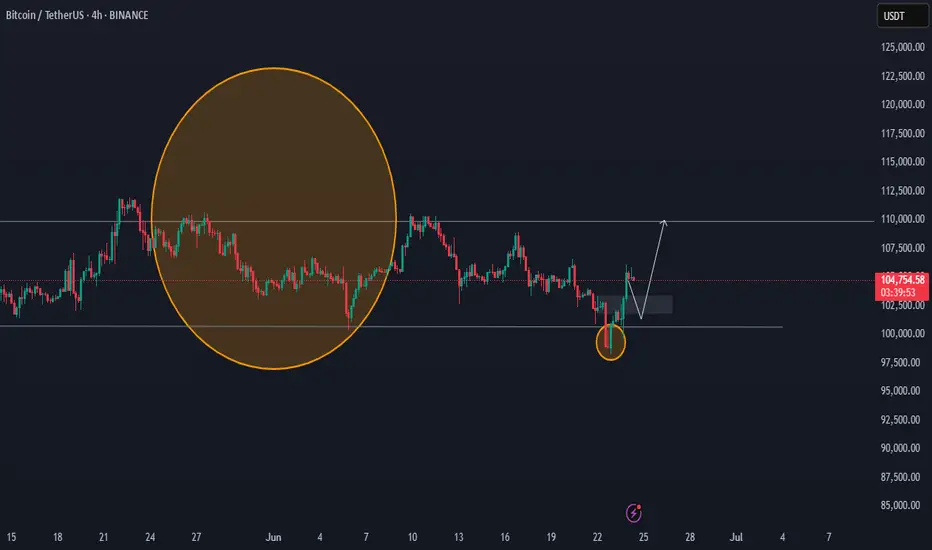
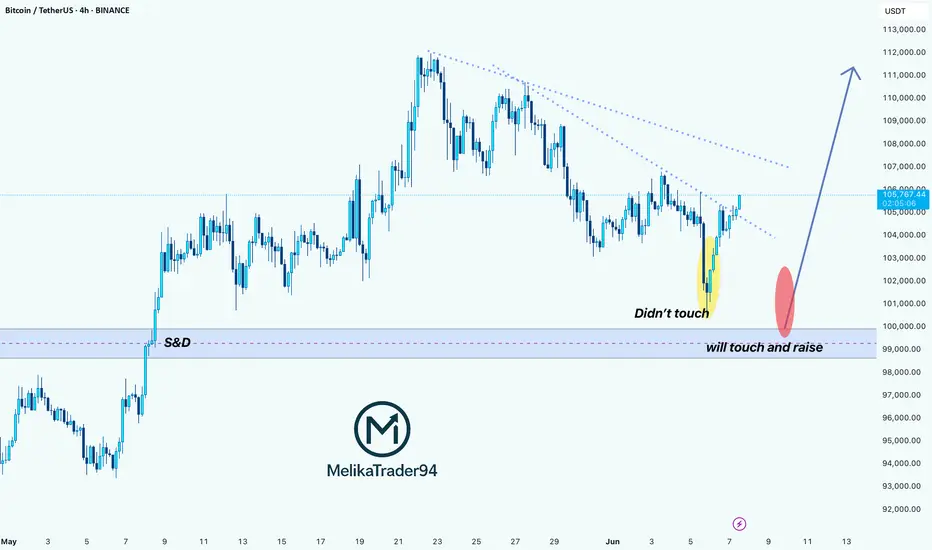
BTC Is Replaying a Bullish Fractal >>> Are You Watching?Hello guys!
I see a deja vu here! Let’s look at the historical daily chart (Jan–May 2025):
What happened?
Initial Drop (Yellow Oval): Bitcoin approached a key S&D zone but didn't touch it, triggering a short-lived bounce before dropping again.
Second Drop (Red Ovals): This time, price precisely touched the demand zone, triggering a clean bullish reversal.
What followed was a strong trend breakout, sustained higher lows, and an eventual surge past prior resistance levels.
Current 4H Chart Setup: A Mirror Image?
Yellow Highlight: Once again, we saw a bounce that didn't quite touch the key demand zone ($98K–$100K).
Red Zone Prediction: If this mirrors the historical move, the price is likely to return and touch this S&D area before launching a bullish leg.
Blue Path Projection: A sharp reversal is expected post-touch, aiming toward $111K–$113K as the next key resistance zone.
The descending trendline adds confluence
___________________
History Doesn’t Repeat, But It Often Rhymes
Based on this fractal analysis, Bitcoin is likely forming the same bullish base seen earlier in 2025. The setup hinges on one key event: a return to the $99K–$100K zone, where demand is likely to step in aggressively.
If the pattern repeats, the current market may offer one last high-reward long opportunity before a parabolic rally.
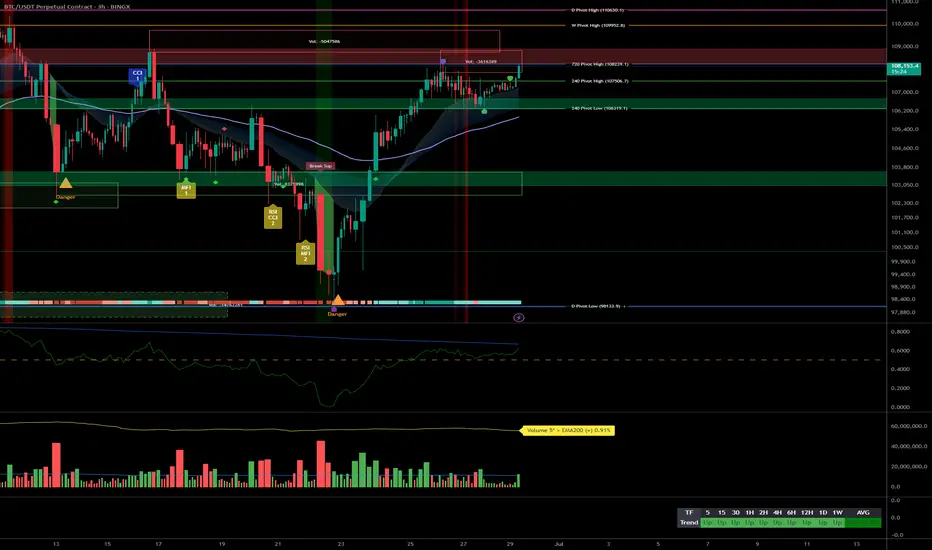
Bitcoin Offensive plan for S/R, risk-on scenario confirmed__________________________________________________________________________________
Technical Overview – Summary Points
__________________________________________________________________________________
Momentum : Strong across all timeframes, driven by the Risk On / Risk Off Indicator (“Strong Buy” bias from 1D to 1H).
Key Supports : 98–100k remains the crucial zone to defend. Interim supports at 103.6k and 106k.
Major Resistances : 107–110k critical cluster, intermediate resistance at 108.2k.
Volume : Normal to moderately increasing volumes on all timeframes, short-term spike at 15min (caution warranted).
Multi-TF behavior : No signs of euphoria or capitulation except for 15min (behavioral overheating & high volume detected).
__________________________________________________________________________________
Strategic Summary
__________________________________________________________________________________
Structural bias : Strong bullish, confirmed by technical and sector data.
Opportunities : Pullback entries at 107–107.5k, trend-following plans on validated breakouts >108.2k/109.9k.
Risk zone : Major break under 106k then 103.6k = invalidation, watch for seller excess (ISPD)/extreme volume on 15min.
Macro catalyst : No major event expected; wait & see climate, caution around Middle East geopolitical headlines.
Action plan : Buy support, monitor breakout/volume, stop-loss below 106k then 99k.
__________________________________________________________________________________
Multi-Timeframe Analysis
__________________________________________________________________________________
1D – 12H – 6H : Durable bullish structure, price capped below 107–110k, momentum confirmed by Risk On / Risk Off Indicator (“Strong Buy”), no volume climax, healthy volume. 98–100k supports remain crucial.
4H – 2H – 1H – 30min : Aligned uptrend, no sell signals. Pullbacks absorbed at 103.6–107.5k pivots. 108.2k–109.9k breakout is pivotal, volumes healthy outside 15min.
15min : Emerging behavioral excess (ISPD = Sell), very high volume → risk of short-term overheat, avoid chasing without validation.
Summary : Bullish multi-timeframe confluence, but caution on ultra-short-term excess and geopolitical news flow.
__________________________________________________________________________________
Synthesis & Strategic Plan
__________________________________________________________________________________
Directional bias : Structurally bullish on all higher TFs, supported by Risk On / Risk Off Indicator, MTFTI, no major alert signals.
Action scenarios :
Buy pullback at 107–107.5k, SL below 106k (Swings) or below 107k (Scalps).
Confirmed breakout (vol./no behavioral excess) above 108.2–109.9k, targets >110k.
Risk/invalidation : Any break under 106k then 103.6k then 99k = bullish bias neutralized.
Risk management : Take partial profits on 109–110k extensions; avoid persistence if ISPD turns red & volumes spike on lower TFs.
Fundamental & on-chain factors : No macro catalyst, healthy consolidation, $99k–$100k on-chain supports decisive, breakout requires new inflows.
Decision summary:
Bias = Bullish, buy supports and validate breakouts with volume, watch for 15min excess and Middle East headlines. Strict SL below 106k/103.6k, risk-off below 99k. Partial profit taking on 109–110k extension. No immediate macro catalyst.
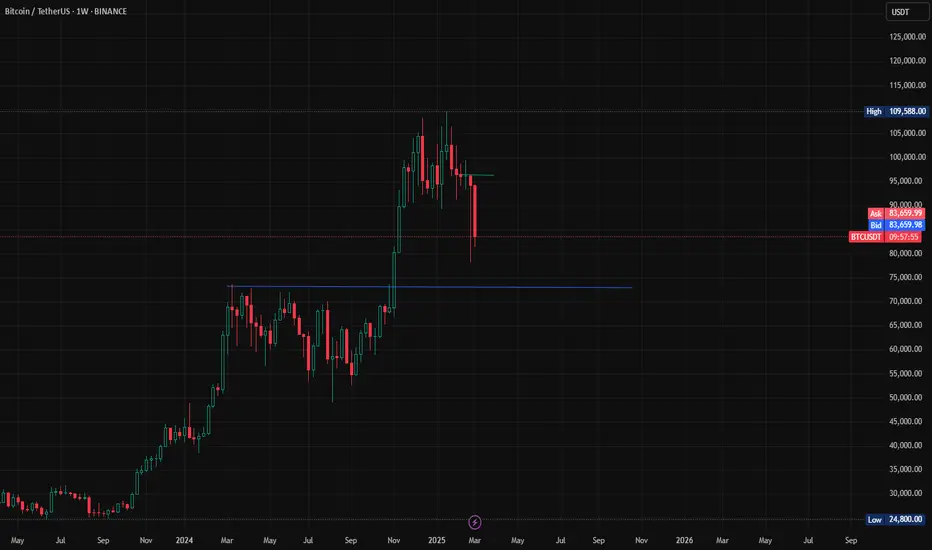
Lower highs / lower lows BTC....what will happen next?History doesn't repeat itself, but it certainly rhymes. Let's look at the BTC chart: lower highs, lower lows from double top. What have we seen in the past -> significant drops. Personally, I'm all for innovation and technology, but make no mistake that institutions are not blindly buying at the top and BTC is veering away from it's core principles after the financial crisis (there's still a middle man!). With this level of volatility and automated trading, there is bound to be a major pull back and it's starting to crack. Economic numbers are not horrible, but they are "lagging." Unemployment is not great with more layoffs being announced every day, interest rates are still high, unsecured debt is ultra high, and affordability is at 30-40 year low. Don't let the champagne effect of S&P fool you, things are NOT rosy!
Always do your own due diligence and all the best!