BTC - Continuation of Bull Trap 21.06.2025Hello Friday! Never, ever, ever trade crypto on weekend, but let's hop in!
🔻 What I expect more? Continuation of Bull Trap! (Probability 70/30)
Few Reasons:
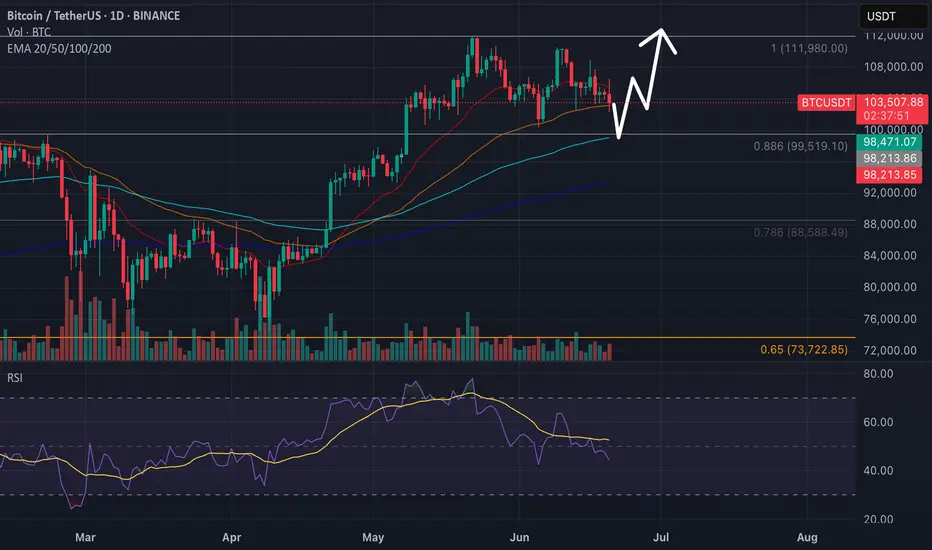
Price broke 20 EMA(daily) and is sliding just above the 50 EMA with "dead-cat" bounce attempts.
RSI is going down below 50 — momeentuum is faaadiing.
No signs of some big demand at this level (low volume on small green candles + Iran uncertainty).
Notable, that we are far from any bounce move (which would support re-accumulation).
Scenario 1: Bearish Continuation (Most likely)
Expecting BTC to test the 99.5k zone — this is the key support level becasue of several arguments:
1) 0.886 Fib
2) Confluence with previous horizontal range support
3) 100 EMA
4) Under psychological level 100k
5) RSI needs to cool off before taking higher targets.
If 99.5k broken, next stop is near 88.5k (0.786 Fib)
I wouldn't like to analyse further possible downslide of BTC, so lets stay so far in already negative scenario within 88.5k, but let's keep in mind, that maximum pain we will see near 75k zone.
🟡 Alternative: Short-term Bounce (Probability 30/70)
BTC could attempt bounce towards 105–106.5k (retest of broken structure + 20 EMA resistance)
If this bounce has low volume and rejection near EMAs or RSI stays below 50 , it's a sell opportunity — not a bullish reversal.
✅ Final thoughts for short term: stay away from the market.
From 103.5k I would expect downward continuation toward 99.5k with possible minor bounce attempts along the way.
Wait for strong reversal signal near 100k and enter LONG with tight SL.
Don't trade during the weekend, unless there's a once in a lifetime opportunity.
Have fun!
BTCUSDT.3L trade ideas
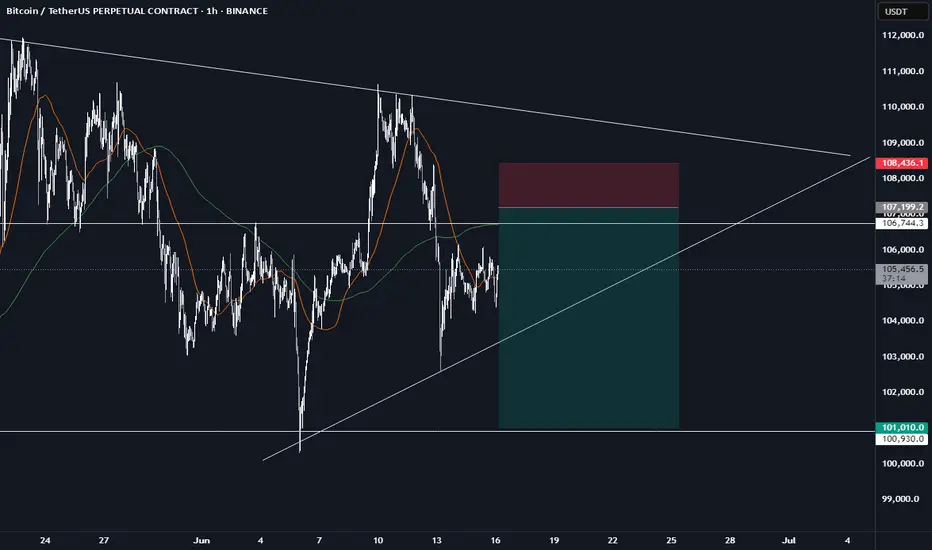
Bitcoin to revisit $100k | Summer price target = $120kGeopolitical tension is causing fear in the markets. Today, Bitcoin fell from $107.7k to current price $105k with no sign of buyer support whatsoever, printing 11 consecutive H1 red candles intraday. Like a hot knife through butter.
At $105k, there is very little support. Sell volume absolutely overshadowed the tiny buy volume. Bulls have yet to close a green candle. I believe in the next few hours Bitcoin will be trading at $104k, followed by the first stop $102k.
$102k can serve as an entry point, depending on how price reacts. $100k is the optimal entry point for maximum profit, after mass liquidations. Retail traders are confident that the liquidity hunt is over after the initial tap, placing stops and liquidation levels at $100k.
Invalidation level will be beyond the 200SMA. The 200SMA have historically proven itself time and time again as a safe zone during rallies after golden crosses.
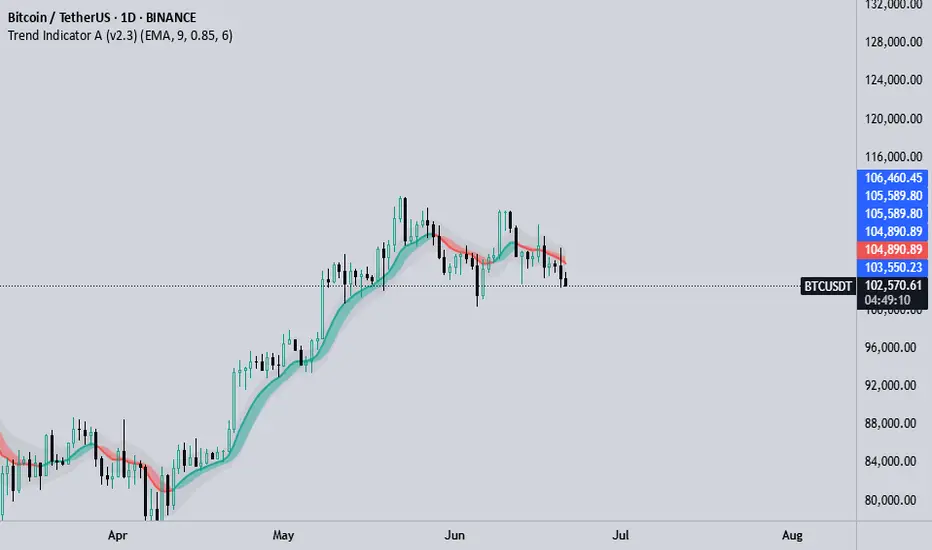
#BTC URGENT UPDATECRYPTOCAP:BTC Update:
Keeping it simple, yesterday’s daily candle printed a nice hammer, but today’s candle looks rough.
That said, things can flip fast in this market.
🔹 Close above previous day’s high: Trend remains intact
🔹 Close above $103,500K: Bullish structure holds
🔹 Break below $102,600: Bearish, could open the door to low $90Ks in the coming weeks
We’re stuck in a tight zone. It's best to stay patient until we get a breakout in either direction.
DYOR, NFA
Let me know what you think, and hit the like button if you like it.
Thank you
#PEACE
Today's BTC trading strategy, I hope it will be helpful to youToday, Bitcoin's price is like a ball caught between two forces, swaying around $103,300. On one side, the Fed just said "let's wait and see" (latest report states the impact of tariffs is uncertain, so no hurry to cut rates), putting a temporary brake on leveraged crypto speculators. On the other side, Middle East tensions are on a rollercoaster—Israel and Iran alternate between clashes and talks, but Iran's move to accept Bitcoin for oil purchases has put a floor under prices. Right now, the market feels like a spring compressed too far: $103,000 acts as a strong support (like a sofa cushion), while $107,000 looms as a ceiling, likely confining short-term moves to this range.
Recent Price Dynamics
The $103,000 level has emerged as a critical support zone, functioning like an "invisible mattress" for prices. During recent volatility, prices repeatedly rebounded when testing this level, indicating many investors view it as a relative low—willing to absorb selling pressure here. For example, on June 13, when Bitcoin fell due to Middle East tensions, it quickly bounced after hitting a low of $102,614, confirming the support at $103,000.
Today's BTC trading strategy, I hope it will be helpful to you
BTCUSDT BUY@102000~103000
SL:101000
TP:105000~106000
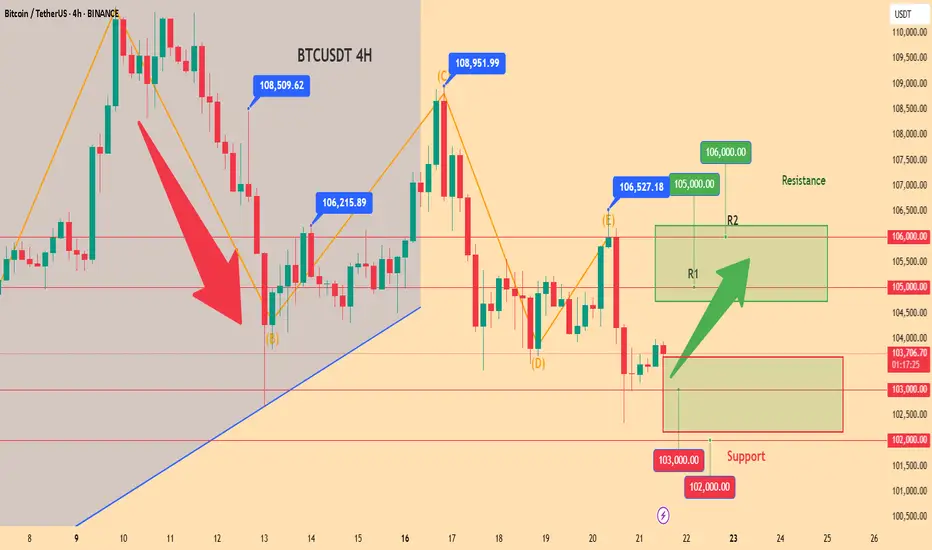
bitcoin btc shortshort entry :107.300 , STOP LOSS: 108.400 , PROFIT TARGET 101.000
RR 1:5 BINANCE:BTCUSDT.P
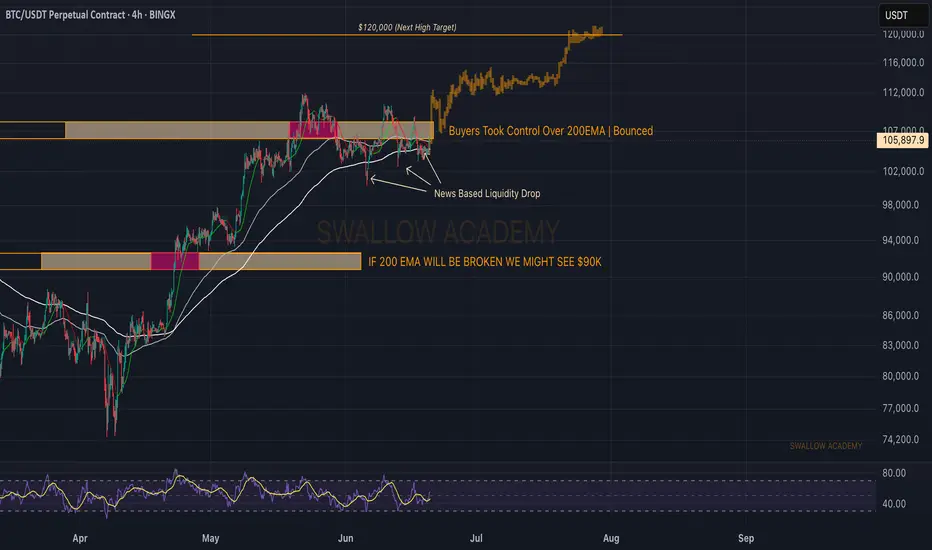
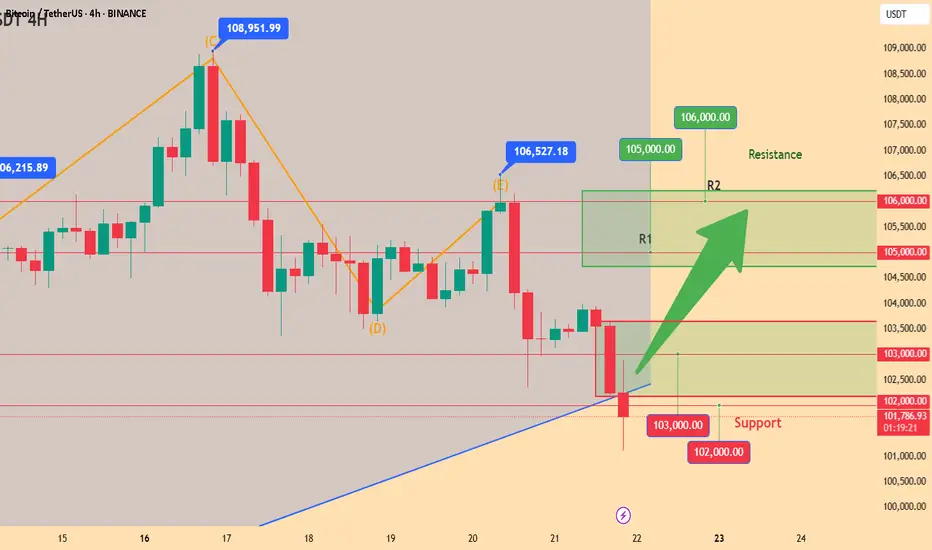
Bitcoin (BTC): Buyers Are Accumulating | Breakout Incoming?Buyers have finally shown dominance near the 200EMA, where now we are heading for for the resistance zone, which will be tested.
As we are entering the friday with that kind of buyside volume we might be seeing strong pump during the weekends so that's what we are looking for now.
Swallow Academy
BTC CORRECTIONBIG REASON WHY
Geopolitical tension. The war between Iran and Israel is inevitable. It's just a matter of time; either the USA, China, and Russia will be involved. The money will flow much more into safe havens like assets.
But based on the Jerome Powell interview after the FOMC statement, the US economy is going on the great path. We can say that if the USA is involved, it will cost the economy growth. But they still need to show the world who's the BOSS (military co.).
The conclusion is,
BTC is too risky for current conditions. As we know, the war might escalate.
BTC Projectory price
Nearest Area 94.5-95K
Mid term Area 85.4 - 86K
Worst Case 76.5-72-53.2K
P.S. Things will change rapidly; always monitor your portfolio and the news
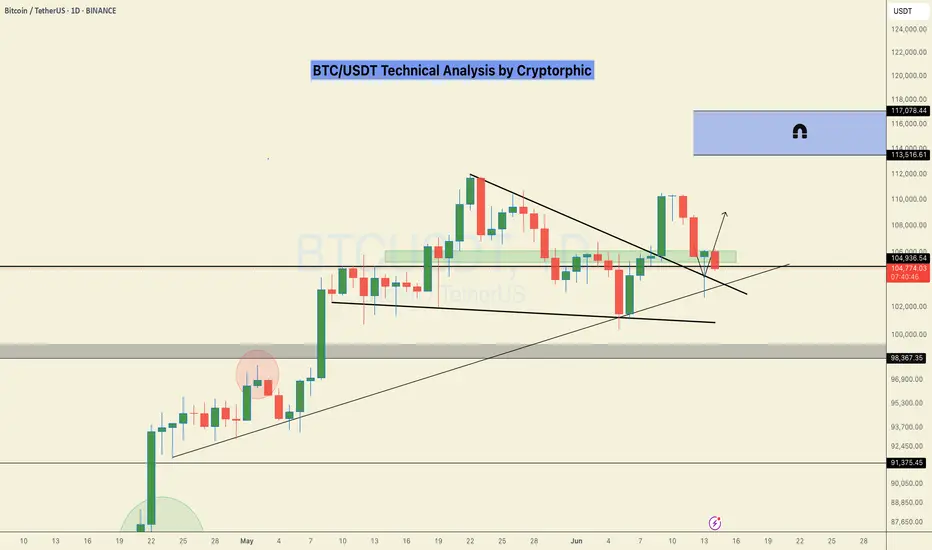
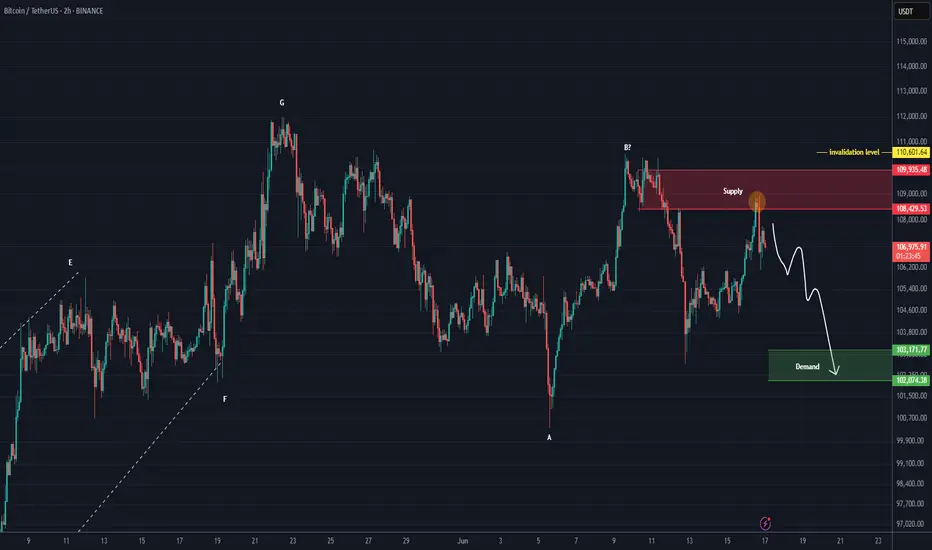
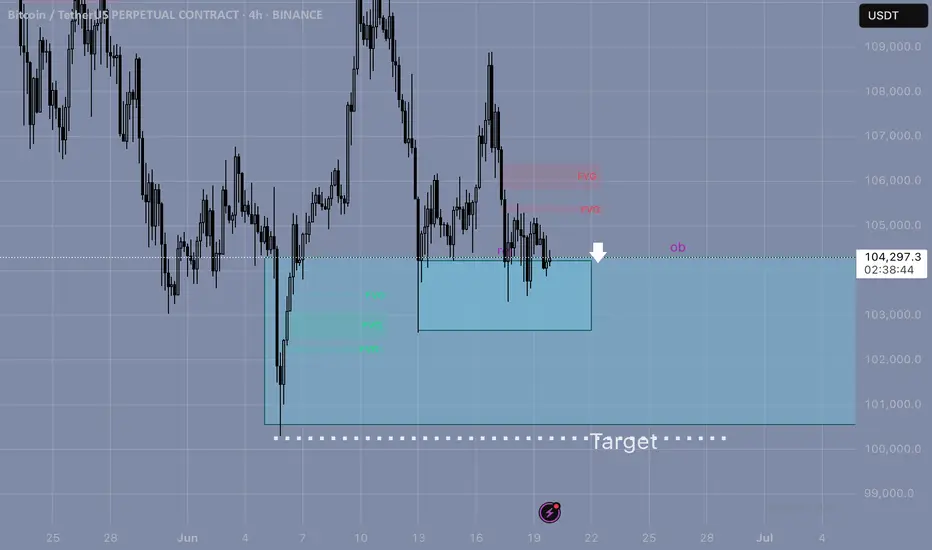
BTC is still bearish (2H)This analysis is an update of the analysis you see in the "Related publications" section
The red zone seems to have had enough orders to reject the price downward. It is expected that the price will drop at least to the green zone below.
There will be some fluctuations along the way.
A daily candle closing above the invalidation level would invalidate this analysis.
For risk management, please don't forget stop loss and capital management
Comment if you have any questions
Thank You
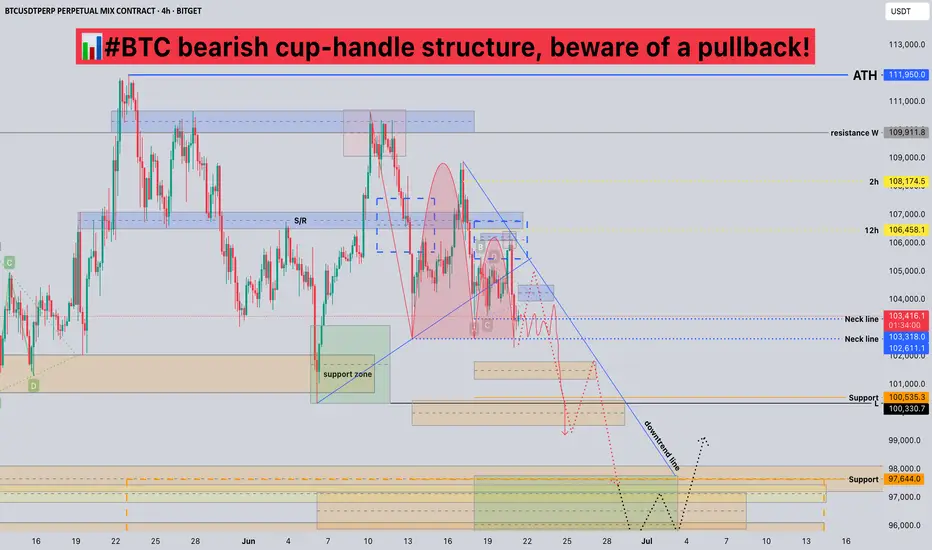
#BTC bearish cup-handle structure, beware of a pullback!📊#BTC bearish cup-handle structure, beware of a pullback!
🧠From a structural perspective, we broke below the neckline, which means a bearish structure is established, so we need to be wary of further declines.
➡️Yesterday's decline was rapid, so we can wait for a rebound to appear and look for shorting opportunities near the blue resistance area or the downward trend line.
➡️Since it is the weekend, the trading volume may be less. If there is no rebound, then we need to wait patiently for a period of sideways consolidation before looking for shorting opportunities.
⚠️Note that the area around 106500 is a support-resistance conversion zone. If it breaks through here and stabilizes, we can remain optimistic.
🤜If you like my analysis, please like 💖 and share 💬 BITGET:BTCUSDT.P
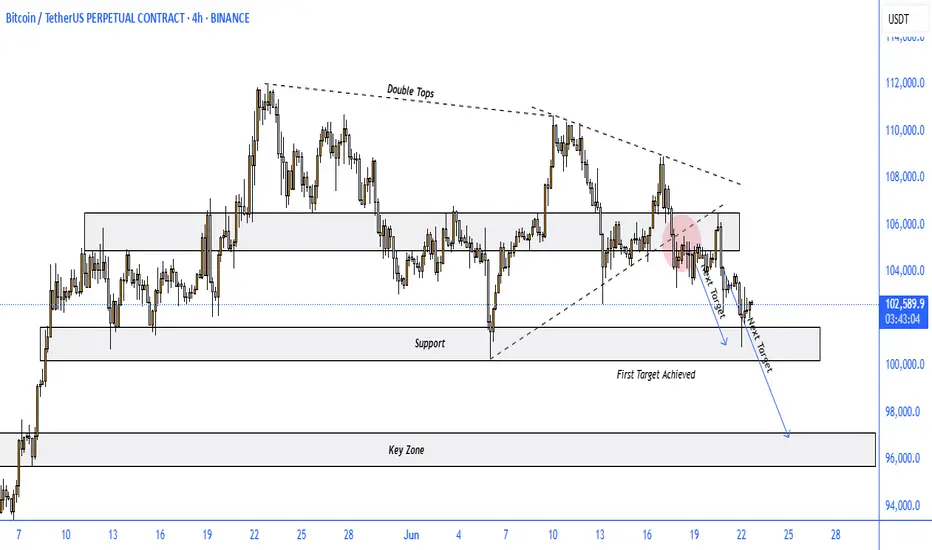
BITCOIN BEARISH SETUPBitcoin (BTC/USDT) – Breakdown from Double Top Confirms Bearish Trend Continuation
The 4-hour chart of BTC/USDT (Binance Perpetual Contracts) presents a textbook double top formation followed by a confirmed breakdown below structural support levels. The bearish trend has already met its first target, and technicals suggest the move could extend lower toward the key demand zone around $96,000.
🔍 Key Technical Highlights:
Double Top Pattern: Clear double top structure formed between $109,000–$110,000, followed by a strong rejection.
Support Break: Price broke down below key support at ~$105,000, triggering a sell-off and validating the bearish reversal.
Bearish Retest: After the breakdown, price retested the broken trendline (highlighted with a red zone) and failed to reclaim the range.
First Target Hit: Price achieved the first projected support zone at around $101,000.
Next Target: Based on measured move projection and previous structure, the next downside target lies near the $96,000 mark.
📉 Outlook:
The structure remains bearish as long as BTC trades below the broken support-turned-resistance zone (~$105,000). Momentum favors continued downside toward the next key zone unless a significant bullish reversal signal emerges.
BTCUSDT Daily 22th JunI have drawn Fibonacci Retracement and specified TP 135k$. I think BTC would may bullish.

Today's BTC trading strategy, I hope it will be helpful to youWhen Bitcoin prices dip to $101,900—despite the prevailing bearish sentiment—a rational long-position strategy can still be formulated by weighing long-term investment value against potential short-term rebound opportunities. The analysis below covers entry timing, position management, and risk control.
I. Entry Timing Judgment
(1) Technical Signals
Monitor price performance around $101,900. Potential long entry signals include:
1. **Confirmation of bottom patterns**: When prices consolidate near this level to form double bottoms, triple bottoms, or other base structures, and the trading volume during the second/third retest is notably lower than previous attempts—indicating weakening selling pressure. For example, if a double bottom forms near $101,900 with 30% less volume in the second retest than the first, this signals a preliminary entry point.
2. **Technical indicator crossovers**: Track metrics like the Relative Strength Index (RSI) and Moving Averages (MA). A long signal strengthens when:
- RSI breaks above 50 from oversold territory (below 30).
- The 5-day MA crosses above the 10-day MA (golden cross).
- Price breaks through short-term resistance (e.g., $102,500) alongside moderate volume expansion.
(2) News Catalysts
Macro events and industry trends are critical for timing:
1. **Fed dovish signals**: Clues of earlier rate cuts or reduced hiking expectations—boosting market liquidity and benefiting Bitcoin. Align such news with technical signals to enhance long-position reliability.
2. **Cryptocurrency sector tailwinds**: Developments like progress on U.S. stablecoin legislation, relaxed global regulatory policies, or breakthroughs in real-world adoption (e.g., more enterprises accepting Bitcoin payments, higher settlement ratios) can reignite value reassessment. If prices stabilize near $101,900 amid such news, consider entering long positions.
Today's BTC trading strategy, I hope it will be helpful to you
BTCUSDT BUY@102000~103000
SL:101000
TP:105000~106000
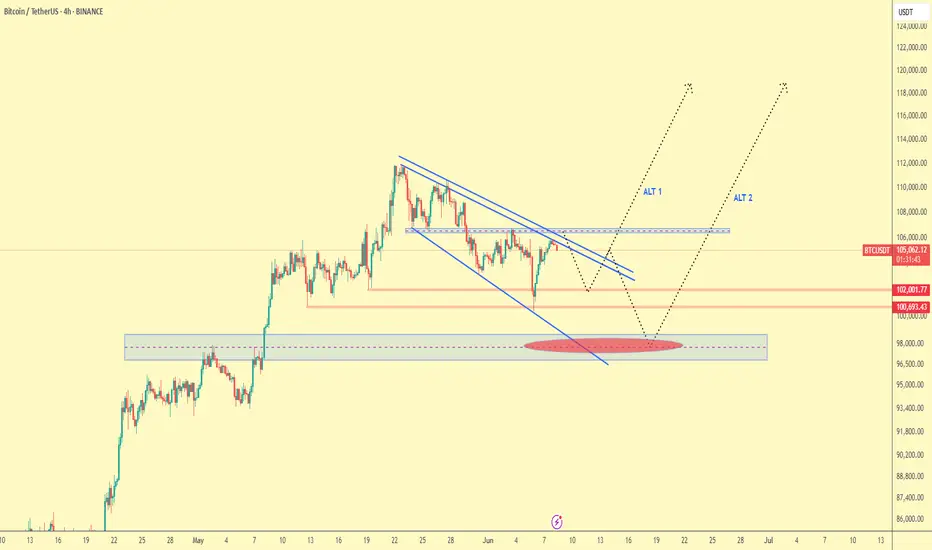
BTC TRrade Plan 08/06/2025Dear Traders,
📊 BTC/USDT 4H Analysis – June 8, 2025
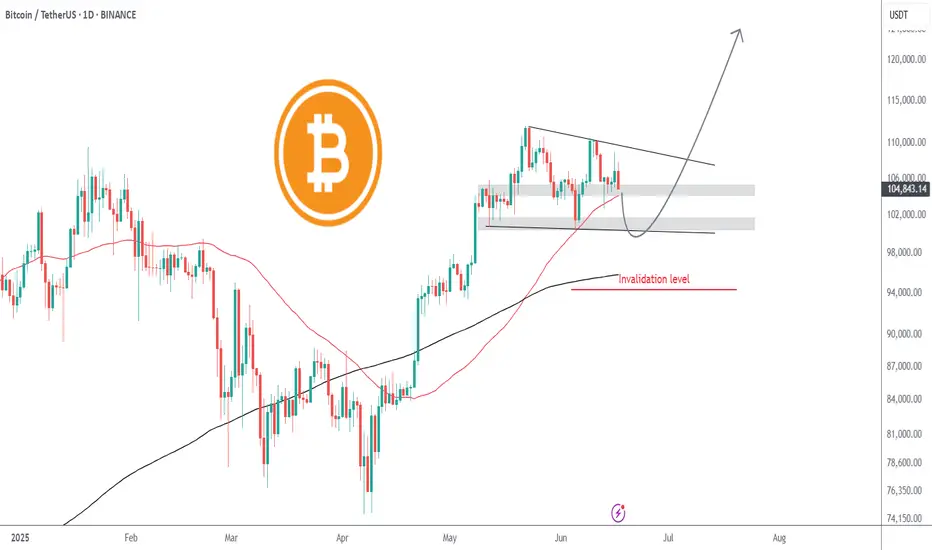
Bitcoin is currently testing the upper boundary of a descending wedge pattern. We are monitoring two main bullish scenarios:
🔹 ALT 1: If the price breaks above the wedge resistance and holds, a continuation towards the $115,000–$120,000 zone is likely. This would confirm the breakout and a potential new bullish leg.
🔹 ALT 2: In case of a rejection from the current resistance, we expect a retracement toward the demand zone around $100,000–$101,600. If price action remains bullish in this zone, this could be a strong re-entry point for long positions.
🟥 Invalidation: A confirmed breakdown and consolidation below $100,000 would invalidate the bullish outlook and open the door to deeper corrections.
⚠️ Wait for confirmation and observe price action in key zones before entering any trades.
if you enjoyed this forecast, please show your support with a like and comment. Your feedback is what drives me to keep creating valuable content."
Regards,
Alireza!
BTC Accumulation modelI would love to see some more ranging, followed by another deviation into this 4h demand to then turn this range into a model 1 accumulation. I would expect the overall range low to hold a little bit longer, since it's a confirmed daily cycle low. I will update this idea if it looks like it could play out.

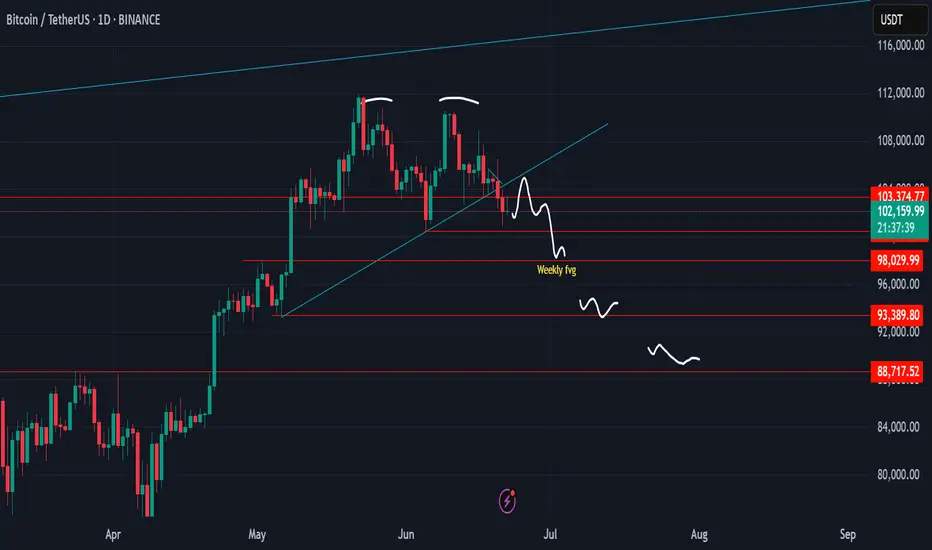
Bitcoin, everyday dump dayNow, we can see everyday is dump day till several days
After success breakout trendling and support, then can't back above the lines
Reasonable target is mini pump to retest then dump to 98k, 98k level is support and weekly open fvg
But if 98k break we will see 93k, and if 93k break we will see final of double top target around 88k and altcoin will rug hard again
But if Bitcoin can go back above 108k, maybe this scenario will be invalid
Squeeze Building in BTC – Targeting 100,500 ShortPrice is coiling between interest zones above and a heap of liquidity below. Expecting an impulsive break—looking to short down to ~100,500.
BTC slowly getting bearmarket vibes.Given the current macroeconomic and geopolitical landscape, there is a growing risk of a renewed downward move in the market. Should we not see a rate cut materialize as early as June, Bitcoin could begin a gradual decline, potentially retracing toward the $50,000–$40,000 range.
This slow grind lower may persist unless there is a sharp and meaningful shift in the key macro or geopolitical variables. While a reversal of this trend remains possible under improved conditions, current indicators suggest a steady move toward lower levels in the absence of a clear catalyst.

BTC - Cup & Handle?BTC forming a cup and handle on the 1D chart which seems to be the main timeframe/narrative of play..
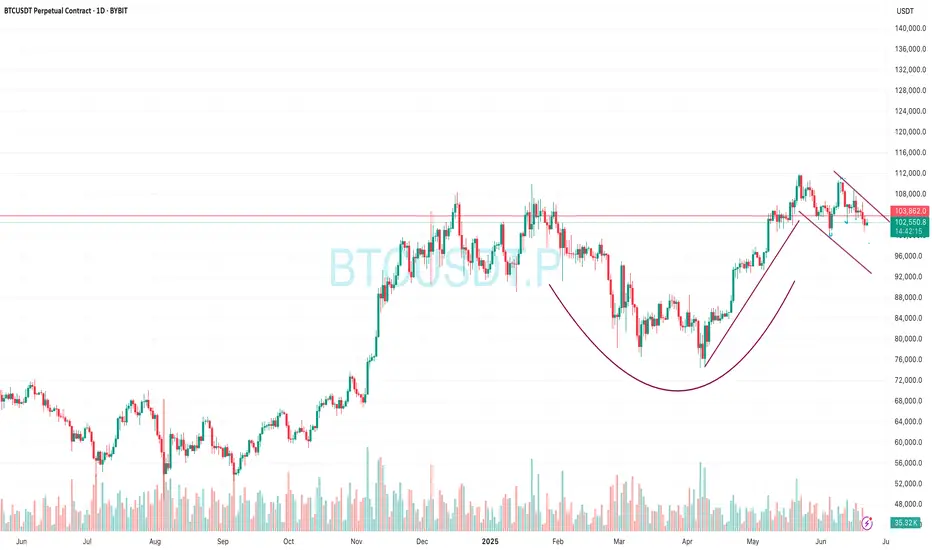
Where is the local bottom? BTC has decided to dip further, retraced to daily support and is probably going for liquidity at 100.3k.

Bitcoin and the descending channel it consistently followsAccording to the UTC+3 time zone, there is a Bitcoin channel between the 23:00 and 03:00 candles on May 21, which uses the width of the channel (the yellow channel). If we copy the same channel and place it at the upper wick of the 15:00 candle on May 27, we get the green channel. Similarly, by copying the yellow channel and aligning it with the lower wick of the 03:00 candle on May 22, which is one of the first two white candles at the start of the channel, we get the orange channel. The blue channel, on the other hand, is my prediction. In addition, not only the 0 and 1 points (solid line) of the channels but also the 0.5 (short line), 0.25, and 0.75 (dotted lines) levels act as support and resistance.

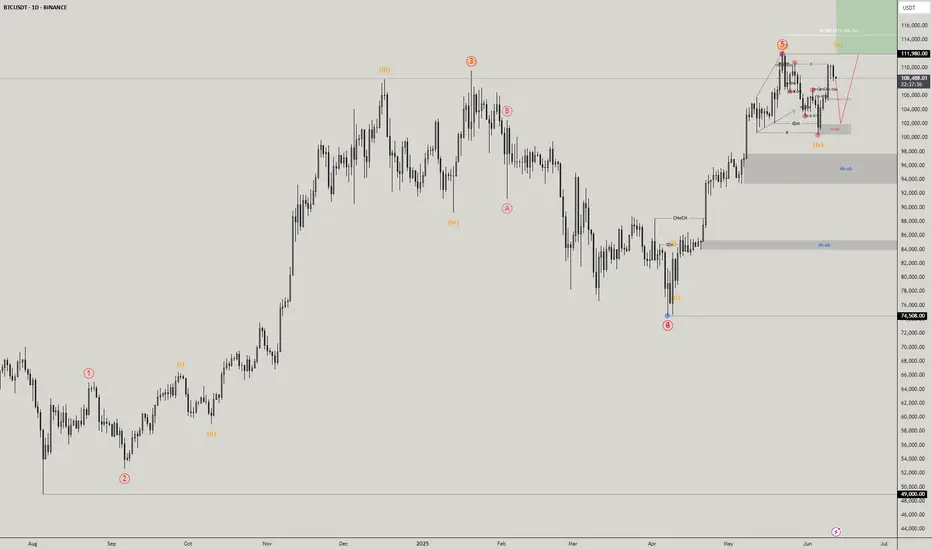
BTCUSDT Possible Sell BTCUSDT completed wave 4 of 5 and currently in wave 5 of 5 . wave 5 targets are on green and a possible sell is in place to finish wave 2 of 5 .
Good LUck
Next Volatility Period: Around June 22
Hello, traders.
If you "Follow", you can always get new information quickly.
Have a nice day today.
-------------------------------------
(BTCUSDT 1M chart)
The morning star candle that we often heard about when studying candles appeared.
However, since the candle has not closed yet, the shape of the candle may change.
In stock charts, there were cases where the movement could be predicted with the shape of these candles, but in the coin market, it is impossible to predict.
The reason is that trading is possible 24 hours a day.
Most candle shapes occur with gaps, allowing for a comprehensive interpretation, but in the coin market, gaps are not likely to occur, so I think there is nothing that can be known from the shape of the candles.
Therefore, it is recommended not to try to analyze the chart with the actual shape or pattern of the candles.
However, you need to study to be able to read the arrangement of the candles in order to set support and resistance points.
Even this is not difficult to indicate support and resistance points because there are indicators that indicate support and resistance points.
-
(1W chart)
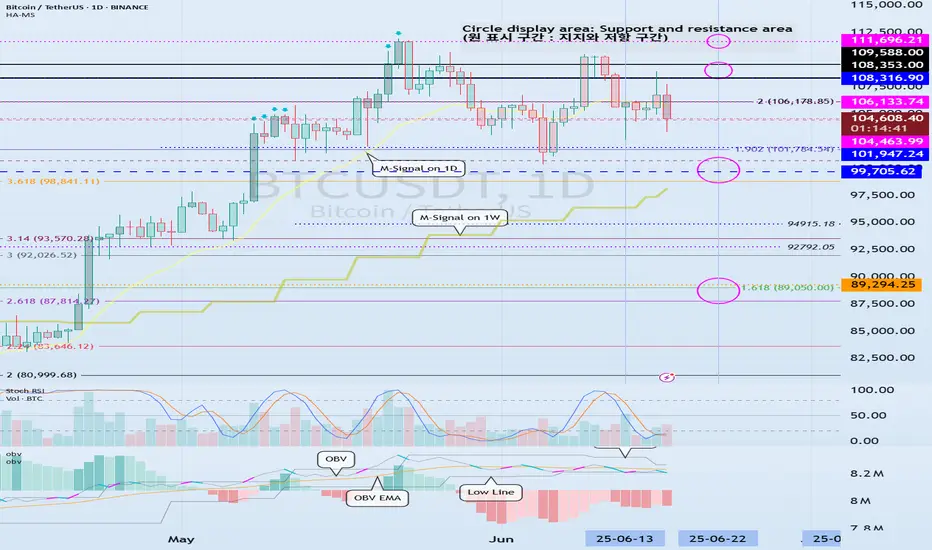
The 104463.99 point is the DOM (60) indicator point, which corresponds to the end of the high point.
Also, the 99705.62 point is the HA-High indicator point, which corresponds to the middle of the high points.
Therefore, the 99705.62-104463.99 section can be interpreted as the high point boundary section.
The actual trend is likely to occur while falling from 99705.62.
The importance of the 99705.62 point is increasing because the M-Signal indicator on the 1W chart is rising near the HA-High indicator point.
If it falls below the M-Signal indicator on the 1W chart, it is possible that the trend will be determined again when it meets the M-Signal indicator on the 1M chart.
Also, if it falls from the HA-High indicator, it can meet the HA-Low indicator.
Therefore, if the price starts to fall, you should check whether the HA-Low indicator is generated.
The fact that the HA-Low indicator was created means that it rose from the low range.
That is, just as the HA-High indicator corresponds to the midpoint of the highs, the HA-Low indicator corresponds to the midpoint of the lows.
The end point of the lows corresponds to the DOM(-60) indicator point.
-
(1D chart)
For this reason, it is important to see support around 104463.99-106133.74.
The trend is likely to appear after the next volatility period, around June 22nd (June 21st-23rd).
Therefore, we should consider the 104463.99-106133.74 range as the middle range,
- and see if it falls below 99705.62,
- or rises above 108316.90.
Accordingly, we should create a response strategy and be prepared not to panic when a trend appears.
-
The OBV is currently below the Low Line.
Therefore, if it does not receive support at the 104463.99 point, it is likely to fall again.
Since the OBV oscillator is still below the 0 point, we can see that the selling pressure is strong.
However, looking at the overall movement of the oscillator, we can see that the selling pressure is decreasing.
Therefore, if there is another decline, the key issue is whether there is support near 99705.62.
-
In summary, the area around 104463.99 is playing an important role as support and resistance.
Therefore, after the next volatility period, around June 22, we need to check and respond to the direction in which it deviates from the 99705.62-108316.90 range.
-
Thank you for reading to the end.
I hope you have a successful trade.
--------------------------------------------------
- This is an explanation of the big picture.
(3-year bull market, 1-year bear market pattern)
I will explain more details when the bear market starts.
------------------------------------------------------
BTC is Bearish again?BTC 1W Overview
BTC is still trading above 100k despite the macro situation and ww3 situation in the Middle East , which is fine for the BTC maxis and institutions.
Weekly structure starting to shift in a bearish direction considering the weekly close below the structure and daily range is just a chop fest around the 104k area and so does the other assets getting chopped.
BTC.D is now over 1000 days uptrending and this is wild and not at all what many were expecting this point in the cycle.
Big concern on my mind is that what if BTC pulls back to the 90k area as I think may happen which I marked in the chart then altcoins will leg down another 20-30%.
Obviously everything is not about technical and the fundamental side is simply that there is an ongoing conflict in the middle East and the whole crypto market is waiting for a resolution one way or the other and crypto market lacks patience and even we do get the uncertainty then it still doesn't address the deeper market issues of altcoin weakness and continued dominance of BTC (BTC outperformed every single alt except MKR).
My best bet for LONG maxis will be around the 92k area Weekly FVG and Yearly Open, if we get more bad news from the middle East or Russia-ukraine or Sir powell comes with a bad news then this zone will be fast forwarded
And for short maxis or Beras my best bet will be S\R of 104k or monthly open is area to look for
All this planning will go down the drain if TRUMP comes with a good news regarding Tarrifs with china or other countries or any other news from the TRUMP because he's unpredictable
On the short time frame Scalps are possible on both sides and 100k is a psychological level to long but in bearish scenerio or war news will just wreck it
Final bias shifting Bearish
For alts instead of trying to long every dead cat bounce or predict the bottom we have to wait for it to happen and then react accordingly because reaction and execution is better than drawing predictions and getting chopped
