BITCOIN TO 193000!!!!EVERYONE IS WRONG!it has been 5 years that i have been studying the btc and linkusdt cycles, and what i know is that a bull market is coming this summer, starting in july—maybe on the 4th or 7th.
BTCUSDT.3L trade ideas

Trade Plan Update #12: Navigating BTC’s Critical Levels
*Conflicting timeframes (bullish 1H/Daily vs. bearish 4H/Weekly) are causing choppy price action. Here’s my 2-step game plan: *
📈 Scenario 1: Bullish 1H Play
Key Support Zone: $100,314 - $102,000 (last line of defense for 1H bullish structure).
Trigger: A strong rejection + bullish reversal signal in this zone.
Action: INSTANT LONG ENTRY. No waiting—aggressively capitalize on momentum.
📉 Scenario 2: Daily Structure Fallback
If $100,314 fails:
1- First Demand Zone: $93,300 - $98,000
Watch for a strong bounce → Go long if momentum confirms.
Weak reaction? Hold and monitor lower.
Second Demand Zone: $84,000 - $88,000
Ideal reversal zone for resuming the bull run.
LONG on confirmed strength.
Bull Run Lifeline: $74,600
Non-negotiable: A daily close below this invalidates the bull trend.
✅ Key Reminders:
Patience is strategy: Only act when price confirms your thesis (no guessing!).
Risk first: Define stops for every entry.
Watch price action—NOT hopes.
👇 What’s your take?
Which scenario seems more likely?
Are you adding any key levels?
Let’s discuss below! 👀

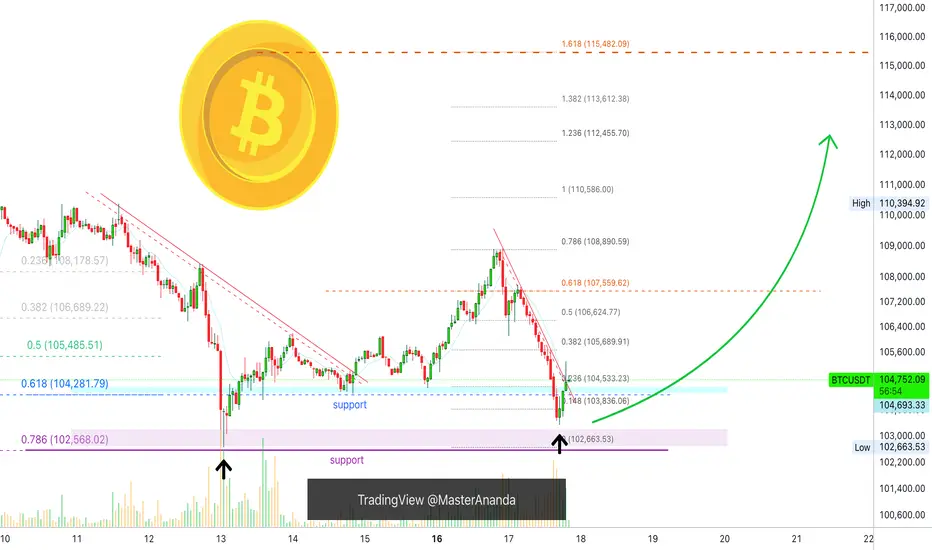
Bitcoin Short-Term 1H Timeframe, Next Target ConfirmedWe have two drops on this chart. The one of the left is more extended and long lasting compared to the one on the right. When a move is sudden with major force, it tends to end suddenly as well.
The recent drop was very steep and the force needed to keep pushing prices lower cannot be maintained, it requires too much energy; for this reason, a higher low is in place and the bulls win the game.
The action is happening above the blue line and space on the chart, this is the 0.618 Fib. retracement support. This is the most important level and so far it holds. Prices went below just to recover. Can be called a failed signal or a bear-trap, whichever you choose, the action is bullish above this level and bearish below.
Bitcoin's main support stands around $102,663, this level was not challenged. Since bears failed to push prices lower, the next logical move is a challenge of higher resistance. And the same pattern repeats, up and down, up and down... This is the short-term noise. When all is set and done, Bitcoin will resolve going up.
Patience is key.
Thank you for reading.
Thanks a lot for your continued support.
Namaste.
btc chipping down de road This is de rasshole fractal—the fractal from the future, the one whispered through the blockchain by quantum echoes of bull runs past, the one that knows, that sees, that is. It bends time, folds sentiment, loops liquidity through dimensions you haven’t even leveraged yet. It doesn’t care about your indicators, your trendlines, your cousin’s TA on Reddit—it just exists, pulsing with the inevitable. You can squint at it, laugh at it, ignore it—but it’s already printed, already fulfilled, already written in the candlesticks of destiny. Don’t try to understand it. Just feel it. Because the fractal knows: the price is going up. Did you buy the dip, or are you still refreshing?

Bitcoin: Strong Support Holds Amid Market UncertaintyBitcoin: Strong Support Holds Amid Market Uncertainty
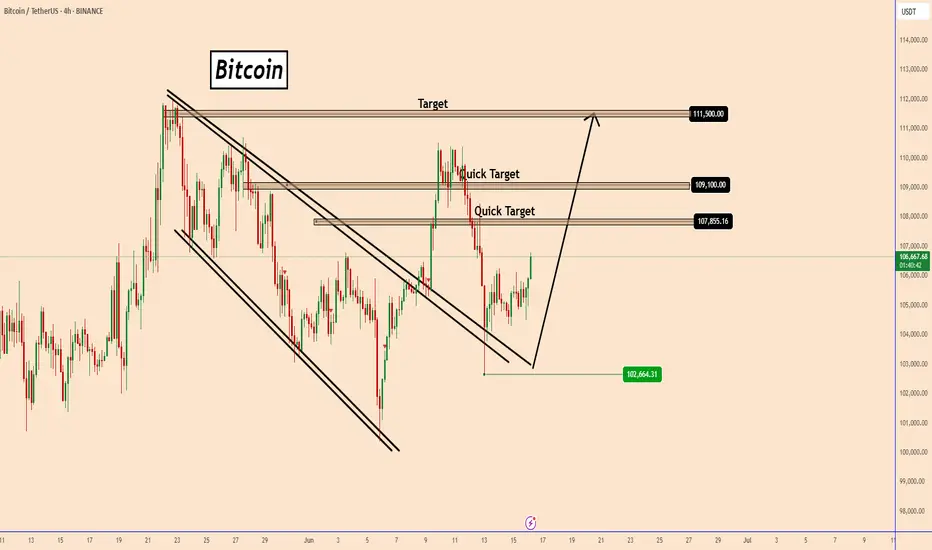
Bitcoin recently tested a key support zone near 102,670, bouncing back in alignment with the broader bullish trend.
The ongoing Middle East conflict continues to reinforce BTC’s strength, establishing another solid support level at 102,650, which signals that the price remains well-supported by buyers around this zone.
For Bitcoin to dip below this area, it would likely require significant market manipulation or unexpected developments.
At present, BTC suggests an upward trajectory, potentially reaching 107,850, 109,100, and even a retest of the previous highs near 111,500.
You may find more details in the chart!
Thank you and Good Luck!
❤️PS: Please support with a like or comment if you find this analysis useful for your trading day❤️
$btc/usdt short swing sh set upth:
sh htf liq + htf sh fib (1.136/1.272) + anti cypher harmonic pattern

bitcoin update as reacted market is now at a key support level of 101k.
market will now might give a dead cat bounce till 104-105k max, a scalp long can be taken with cautious, one bad news and that ded cat bounce will die with the market.
stay safe everyone.

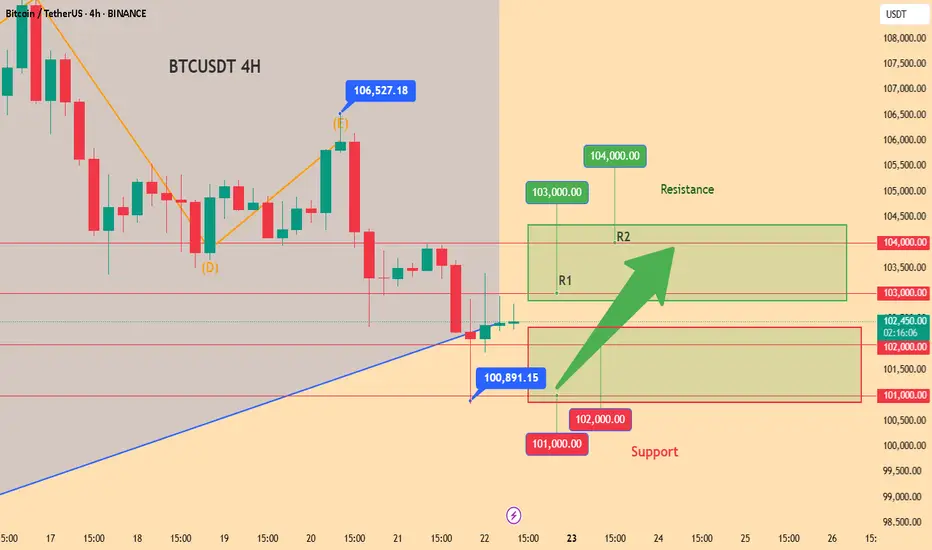
Today's BTC trading strategy, I hope it will be helpful to you Analysis of Market Dynamics Under Geopolitical Conflicts
The current conflict between Iran and Israel has entered a critical phase of "reciprocal retaliation". In the early morning of June 22, Iran launched missile strikes on Israel, targeting military command centers and nuclear R&D facilities in Tel Aviv, while Israel carried out multiple rounds of airstrikes on missile bases in western Iran. This high-intensity mutual bombardment has broken the "limited retaliation" pattern of previous regional conflicts. Iranian Supreme Leader Ayatollah Ali Khamenei explicitly stated the intention to "completely destroy the Israeli regime", indicating a real risk of further escalation.
The U.S. stance in this conflict has become a key variable. While President Trump said it "may take two weeks to decide whether to join the war", he also emphasized that "it's hard to ask Israel to stop attacks", an ambiguous stance that has intensified market uncertainty. Notably, Iran has ruled out the possibility of nuclear talks during the conflict, and the breakdown of diplomatic channels has made military confrontation the only option—this could lead to geopolitical risk premiums persisting in asset pricing.
Historical experience shows that Bitcoin's performance in geopolitical conflicts features "short-term volatility, medium-term divergence". During the Iran-Israel conflict in April 2024, Bitcoin plunged 7% within an hour, but it rose 5% against the trend after the U.S. airstrike on Iran in 2020. The current market's uniqueness lies in that Trump signaled "possible military action" before the conflict, giving the market a digestion period—thus, Bitcoin only fell 4.5% after the conflict broke out on June 13, showing stronger resilience than in 2024. However, if the U.S. officially enters the war, it may trigger panic selling similar to the early stage of the 2022 Russia-Ukraine conflict, which requires high vigilance.
Bitcoin's current price of $102,500 is facing a dual test of geopolitical conflict and technical resistance. The reciprocal retaliation between Iran and Israel has not ended, and whether the U.S.参战 (enters the war) will determine the direction of market sentiment. Technically, whether the $103,000 resistance level is broken will guide short-term trends. Investors need to distinguish between short-term emotional shocks and long-term trend forces—geopolitical conflicts may cause short-term volatility, but the de-dollarization trend and the stability of institutional holdings provide long-term support for Bitcoin.
In terms of operations, it is recommended to adopt a strategy of "light-position trial + flexible hedging": do not blindly chase breakouts, nor ignore pullback buying opportunities. Remember: in the fog of geopolitics, real opportunities often lie at the intersection of market panic and rationality, and risk control is always the first principle of investment.
Today's BTC trading strategy, I hope it will be helpful to you
BTCUSDT BUY@101000~102000
SL:99500
TP:103000~104000
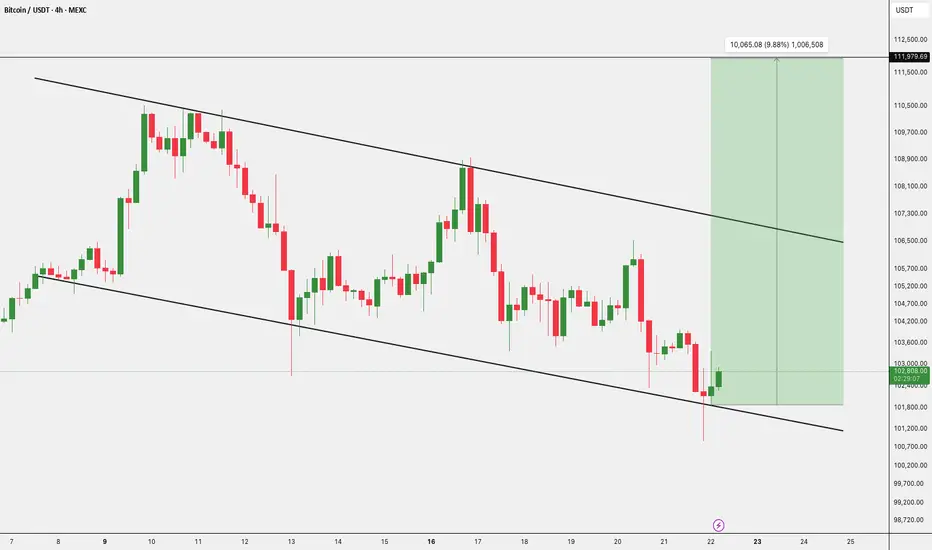
$BTC Bounce Targeting $112K?CRYPTOCAP:BTC is trading within a descending channel and has just bounced off the lower support level near $101,400.
If this rebound holds, we could see a push toward $107,000–$ 112,000.
However, it remains in a downtrend, so any upside may face resistance unless the channel breaks with strong volume.
The Importance of the 104463.99 Point
Hello, traders.
Please "Follow" to get the latest information quickly.
Have a nice day today.
-------------------------------------
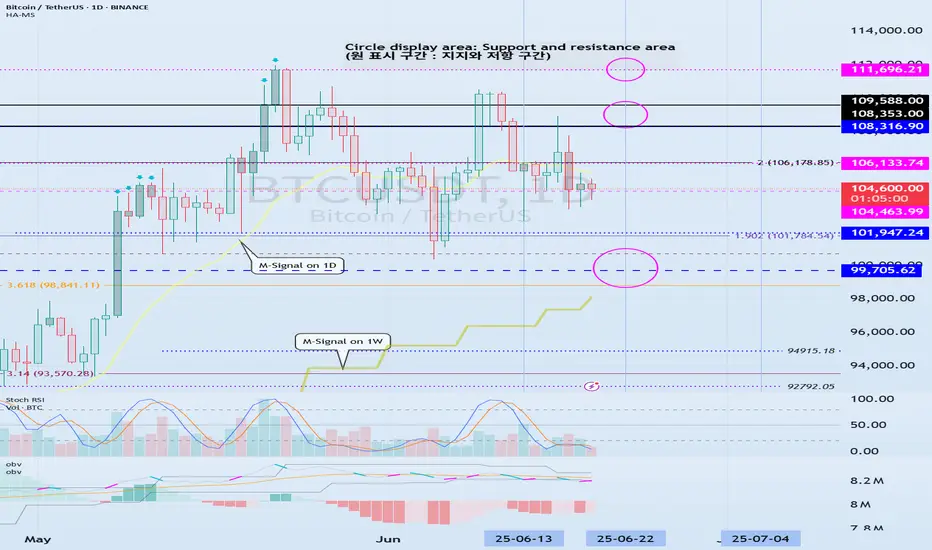
(BTCUSDT 1D chart)
This volatility period is around June 22nd (June 21-23rd).
Therefore, waves can be generated at any time during the volatility period.
The 104463.99 point is the DOM (60) indicator point of the 1W chart, which corresponds to the end of the high point of the 1W chart.
Therefore, it seems that the price defense is being done well.
I think that defending the price at the high point is significant because it raises expectations for further increase.
-
If it falls after a period of volatility, there is a possibility that it will meet the M-Signal indicator of the 1W chart, and I think the important point at that time is the 99705.62 point.
Therefore, when it falls, you need to check whether the M-Signal indicator of the 1W chart rises to around 99705.62 and whether it is supported.
-
Even if it rises after receiving support near 104463.99, the key is whether it can maintain the price by rising above 108316.90.
The 108316.90 point is the HA-High indicator point of the 1D chart, which corresponds to the middle value of the high point range.
Therefore, in order to continue the uptrend, it must be supported and rise in the 108316.90-111696.21 range.
Currently, both the Low Line and High Line of the auxiliary indicator OBV are showing a downward trend.
Therefore, in order for the uptrend to begin, OBV must rise above the High Line and be maintained.
If not, it is highly likely that it will fall due to selling pressure.
One hopeful(?) thing is that the PVT oscillator is showing an overall upward trend.
(Changed from OBV oscillator to PVT oscillator.)
Therefore, we can see how important the area around 104463.99 is playing a role of support and resistance.
-
In my chart, the basic trading strategy is to buy near the HA-Low indicator and sell near the HA-High indicator.
Therefore, it is virtually impossible to create a trading strategy at the current price level.
In such cases, you should conduct trading through day trading or quick response.
If not, you may experience a lot of psychological fear and anxiety.
The basic time frame chart of all indicators is the 1D chart.
Therefore, if you cannot read the flow of the 1D chart, you are likely to end up getting faked and suffer losses.
Therefore, you should read the flow of the 1D chart and create a big picture of how to create a trading strategy, and respond in detail on the time frame chart below the 1D chart.
-
Thank you for reading to the end.
I hope you have a successful trade.
--------------------------------------------------
- This is an explanation of the big picture.
(3-year bull market, 1-year bear market pattern)
I will explain more details when the bear market starts.
------------------------------------------------------
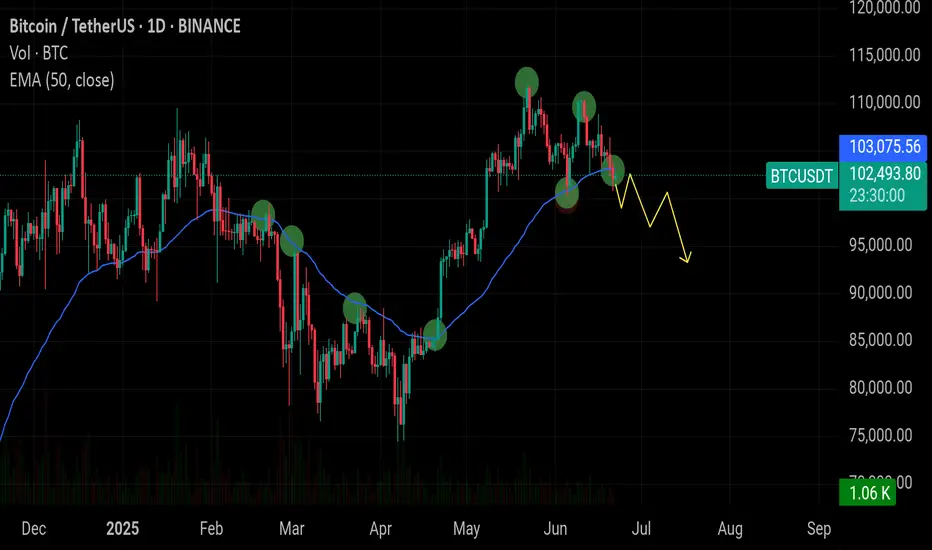
$BTC Breaks Key Support – Bearish Signal Bitcoin has lost the CRYPTOCAP:BTC Breaks Key Support – Bearish Signal
Bitcoin has lost the critical 50 EMA on the daily chart, which has historically acted as a strong support level. This breakdown mirrors the 2021 double top structure and is now hinting at a deeper correction.
🔸 Key Support Zone at $100,000:
Losing this zone increases downside risk. If $100K fails to hold, next visible supports are at $96K and $91K, aligning with past consolidation zones.
🔸 Risk Level at $104,500:
A daily close back above $104.5K would invalidate this bearish view and indicate strength recovery.
🔸 Outlook:
Wait for further confirmation below $100K for potential short setups. Avoid long entries until clear reversal signs appear.
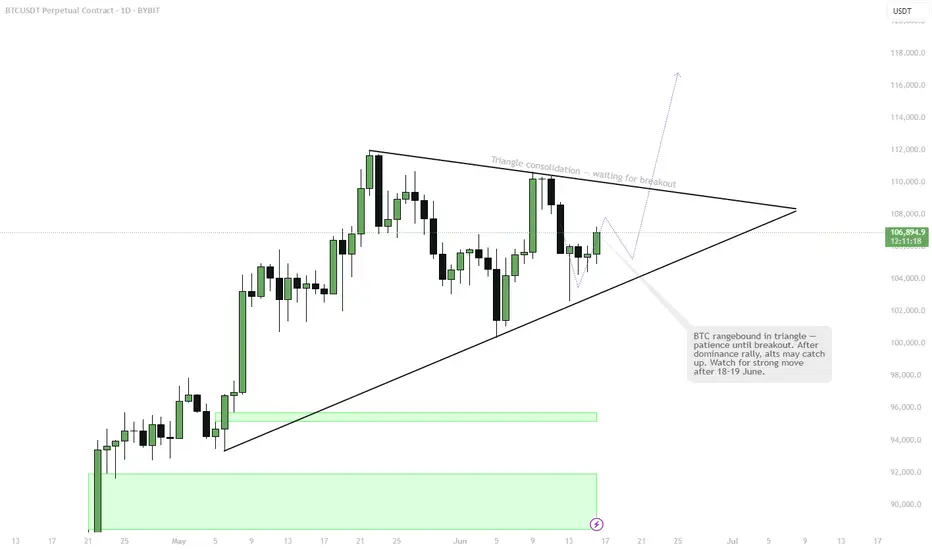
BTC is stuck in a tightening triangle — compression phaseVolatility building up into June 18–19.
Expect a big breakout.
Main scenario: breakout to the upside with a “God Candle” and new momentum for altcoins after prolonged BTC dominance.
Alts have been suppressed, but that’s part of the setup — don’t get tricked by the fake moves.
Stay patient, don’t lose focus, and be ready for a sharp move!
BTC get out while you still can!I've been warning people about this for weeks. History doesn't repeat itself, but it certainly rhymes. BTC had a double tope and the 50 / 200SMA show cooling and both showing clearly that it's moving one direction and it's not up. Gravity with this one is strong (historically) and so is the volatility. Crypto bros will go back to eating beans and rice!
MSTZ and BTCZ could be good plays here....best of luck and always do your own due diligence!

BTC to 102.5k game plan. here you can see that bitcoin is trading within a zone that will likely lead to a breakout to the downside, unless geopolitical tensions somehow get freed up. I believe that we will see 102.5k by the end of the month, if not sooner.
BTC - SHORTBitcoin will do this in the next days, in a long term vision and i see it touchin the zones below 90,000. The start of a new downtrend!!! DYOR
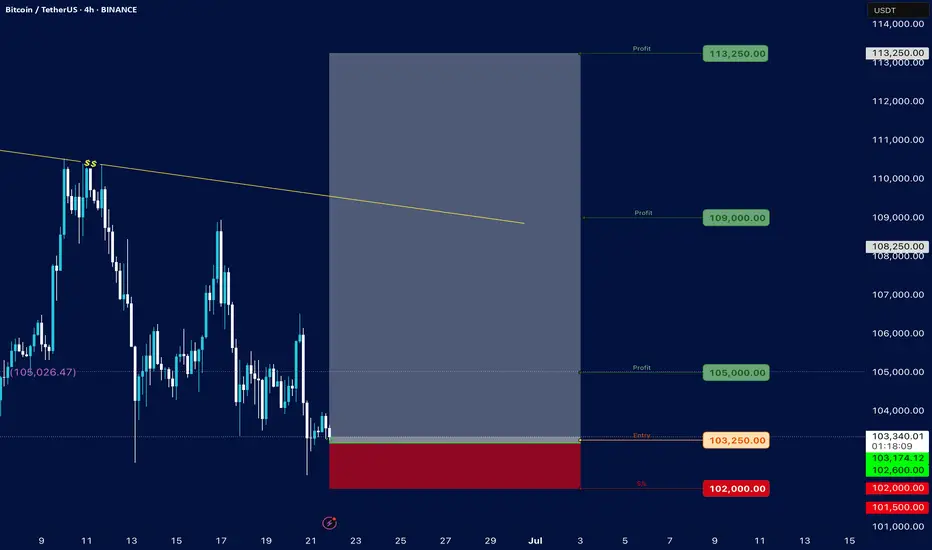
Bitcoin### Bitcoin Price Analysis (June 21, 2025)
#### **Current Price**: $103,236.15 (as of the snapshot)
- The price is hovering near the lower end of the recent range, with key support at **$102,000** (marked as "S/s" on the chart).
- Resistance levels are visible at **$105,000**, **$107,000**, and **$110,000–$114,000**.
#### **Key Observations**:
1. **Support and Resistance**:
- **Strong Support**: $102,000 (critical level; break below could signal further downside).
- **Immediate Resistance**: $105,000 (previous entry point and psychological level).
- **Higher Targets**: $110,000–$114,000 (if bullish momentum returns).
2. **Price Action Context**:
- The price recently rejected the $105,250 level ("Entry") and is now testing lower support.
- The "Profit" markers at $105,000 and $105,026 suggest these were take-profit zones for traders.
3. **Trend and Sentiment**:
- The chart shows consolidation between $102,000–$110,000, with no clear breakout yet.
- A hold above $102,000 could lead to a retest of $105,000, while a break below may target $100,000 or lower.
4. **Volume and Timeframe**:
- The snapshot lacks volume data, but the date range (June–July) suggests a medium-term view.
- Key dates to watch: June 25–28 and early July for potential volatility.
#### **Conclusion**:
- **Bullish Case**: Hold above $102,000 and reclaim $105,000 to aim for $110,000+.
- **Bearish Risk**: Break below $102,000 could accelerate selling toward $100,000 or $99,000.
**Actionable Insight**: Watch the $102,000–$105,000 range for a breakout or breakdown. A rebound from support with volume could signal a buying opportunity, while a drop below $102,000 may indicate further downside.
*(Note: The analysis is based on limited data from the snapshot. For a full assessment, additional indicators like RSI, MACD, and volume would be needed.)*
BTCUSDTBULLISH TREND
Major Zone = Yellow area
Can take entry on break of HH/
instant buy/
or any fib level 0.5 or 0.618
Sl is mentioned on the chart, you can adjust your tp's according to ur sl and entry.
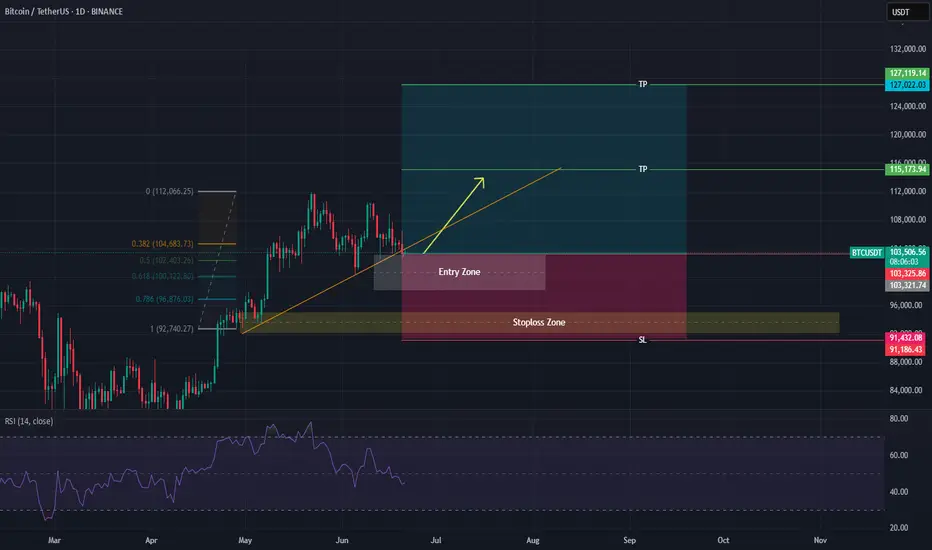
Bitcoin Key $103K Supports Tested, Swing-Bullish Opportunity?__________________________________________________________________________________
Technical Overview – Summary Points
__________________________________________________________________________________
Strong bullish momentum on daily, fueled by the Risk On / Risk Off Indicator and MTFTI structure.
Major supports identified at $102,600 – $103,300, high confluence (4H, 12H, 1D).
Resistances clustered between $106,000 and $110,000 (240 & D Pivot High, W Pivot High).
Volumes generally neutral; no buyer/seller climax.
Directional trends diverge: overall swing remains bullish, short-term intraday still corrective.
__________________________________________________________________________________
Strategic Summary
__________________________________________________________________________________
Global Bias: Structured bullish as long as supports >$102,600 are preserved.
Opportunities: Longs on retest of major supports, favoring daily/4H trend-following. Reactive shorts only on rejection at $104,500–$106,000.
Risk zones: Below $102,600 = structure break. Prioritize cash/hedging.
Macro catalysts: Waiting for September FOMC. Monitor geopolitical risks (MENA).
Action plan: Gradual entries on pullbacks, disciplined stops below pivots, prudent sizing outside confirmed breakouts.
__________________________________________________________________________________
Multi-Timeframe Analysis
__________________________________________________________________________________
1D & 12H : Bullish trend confirmed by the Risk On / Risk Off Indicator and MTFTI. Major supports intact ($102,600–$103,300). Volumes neutral, market in wait mode. Swing long favored.
6H & 4H : Upward momentum, no significant bearish signals. “Buy the dip” valid above support; healthy structure as long as key levels hold.
2H, 1H : Early micro-divergence signals (MTFTI Down short term), increased caution. Favor entries on confirmed correction or breakout only.
30min, 15min : Intraday correction, neutral/bearish volumes, aggressive long setups discouraged. Scalping only on exhaustion spikes, strict stops.
ISPD DIV summary : No excess/panic, mature consolidation/range context.
Risk On / Risk Off Indicator summary : Bullish across all TF except very short-term (>15min neutral).
__________________________________________________________________________________
Fundamental & On-chain Synthesis
__________________________________________________________________________________
Fed: status quo, US macro softening, market waiting.
Geopolitical tensions: potential for increased volatility.
On-chain: institutional predominance, low network pressure, no panic selling or retail euphoria.
Off-chain: high derivatives volume, OI > $96B. Squeeze risk if catalyst emerges.
__________________________________________________________________________________
Decision Matrix – Execution Plan
__________________________________________________________________________________
Swing Long: Entry $103,200 – $103,800, stop <$102,400, target $107,000+ (RR>2:1)
Scalping Short: On confirmed rejection $104,500 – $106,000, stop >$106,400, target $103,400 (RR>1.5:1)
Strict risk management below major supports, position proactively on volatility/news.
Cash/out below $102,400 or with major geopolitical headlines.
Stay flexible; alternate range-buy/take profit until breakout volume or FOMC news.
__________________________________________________________________________________

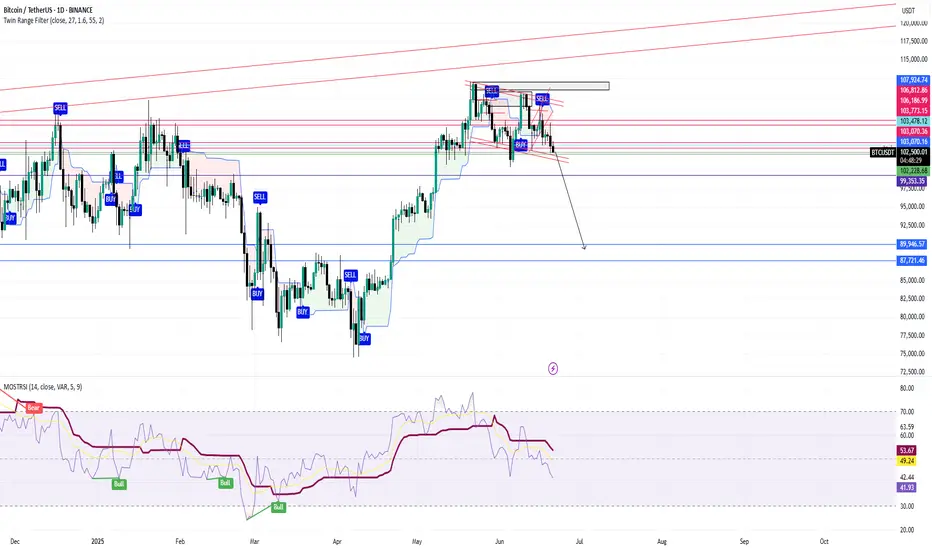
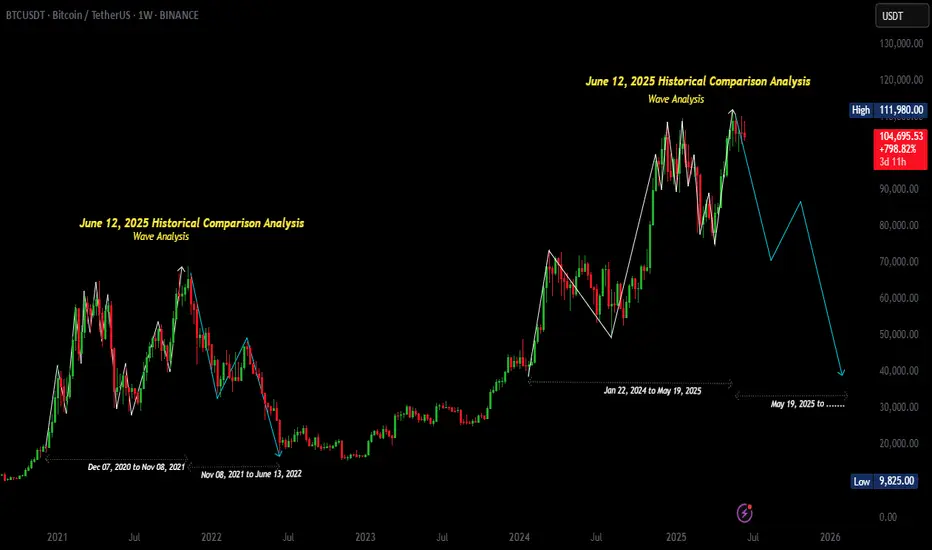
June 12, 2025 Historical Comparison Analysis [Wave Analysis]No one knows tomorrow but what if???
Here, we have a historical comparison between December 07, 2020 to June 13, 2022, and January 22, 2024 to present day.
December 07, 2020 to November 08, 2021:
• Uptrend
• Flag (retracement)
• Uptrend continuation
• Range
• Downtrend
• Range (W or Double bottom pattern)
• Uptrend
• Flag (retracement)
• Uptrend continuation
November 08, 2021 to June 13, 2022:
• Downtrend
• Flag (retracement)
• Downtrend continuation
January 22, 2024 to May 19, 2025:
• Uptrend
• Flag (retracement)
• Uptrend continuation
• Range
• Downtrend
• Range (W or Double bottom pattern)
• Uptrend
May 19, 2025 to present day:
• .......
JUST WHAT IF HISTORY REPEATS ITSELF

Bitcoin and the geopolitical news BINANCE:BTCUSDT.P
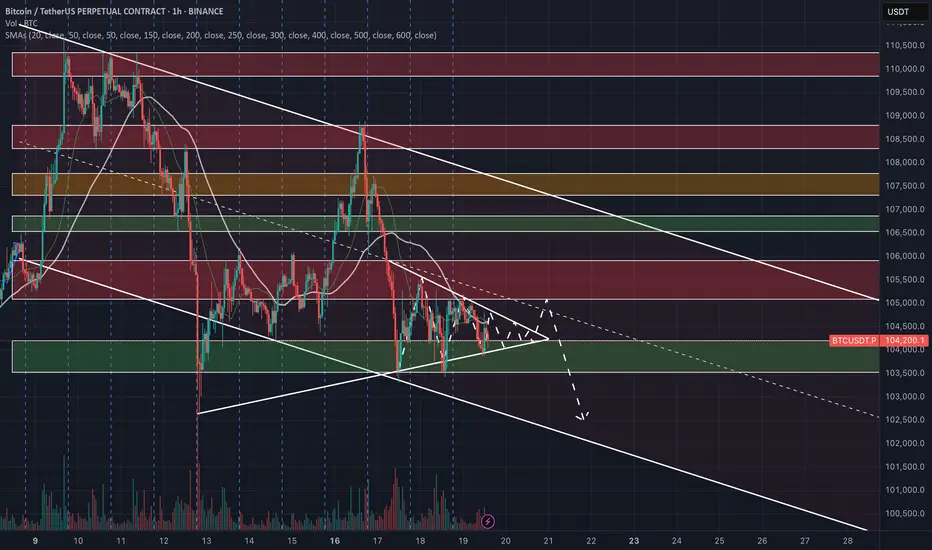
Advanced Technical Analysis of Bitcoin's Structure – Current Situation on Smaller Timeframes
We notice a symmetrical triangle forming on the small timeframes (1-hour and 4-hour), centered in a critical area. Historically, when this price pattern forms, Bitcoin takes no more than three days to confirm its trend. Therefore, the close of the third-day candlestick will serve as a pivotal turning point.
🔹 Immediate Support: 103,400
🔹 Strong Support: 102,500 — a daily low + institutional liquidity zone
🔹 First Resistance: 105,600 — associated with a convergence of moving averages (EMAs)
🔹 Main Resistance: 106,700 — a crossover with the 200-period moving average, which can be described as the largest psychological barrier
---
Possible Scenarios:
☑️ Positive Scenario:
If 105,600 is breached, we are expected to witness an upward movement targeting:
108,000
110,000
118,000 (potentially later)
✅ Catalysts:
Positive US economic data
Regulatory news supporting the markets (such as institutional entry and cryptocurrency regulations)
---
⚠️ Negative Scenario:
If the 102,500 support level is broken, the path will be open to:
100,000
99,000 (strong psychological support area)
❗️ Potential Triggers:
Negative inflation data
Major geopolitical escalation (especially if it directly involves the United States)
🔴 Important Note: I'm not a proponent of trading based on news, but I'm including the US factor because it's the only one I consider truly influential in geopolitical analysis.
The US entering a full-scale war would prompt American investors (who represent about 5% of active traders) to withdraw immediately for fear of long-term repercussions.
🔻 America is making history now, and Trump is managing the situation expertly. He is likely to avoid getting involved in long-term conflicts, focusing on concluding deals and wars strategically.
---
Current Sideways Trading:
Trading continues between the 103,400 and 105,600 levels within the symmetrical triangle.
The future direction will be determined by the following developments:
If the conflict ends and a deal is reached (especially if Iran surrenders), we will witness a strong upward breakout.
If the United States enters the war directly, we expect a downward breakout to levels that may reach 92,000.
---
Technical Conclusion: 💎
Bitcoin is in a critical consolidation phase with a delicate balance between institutional selling pressure at 106,700 and strong buying demand at 102,500.
The next breakout will depend on:
1. A clear breakout of the triangle pattern
2. The strength of the liquidity accompanying the movement
3. Official US developments—regulatory or political
---
Important Clarification:
❌ The recent decline is not directly related to the Iran-Israel war. Rather, it came as a result of:
1. Options expiry
2. Trump's statements about the possibility of direct US intervention, with the arrival of an aircraft carrier in the Middle East
🔍 A war between only two parties doesn't worry the market much, but US intervention is the decisive factor.
✅ America alone is the one that moves the markets.
BTC is expected to give move by mid or end of July 2025BTC is expected to make a move by mid or end of July 2025
BTC is forming a Bullish Flag Pattern, and it is expected to give a breakout from this flag, by mid or end of July.

Skeptic | Bitcoin Deep Dive: Rate Hikes, War Tensions & TriggersInterest Rates: The Big Picture
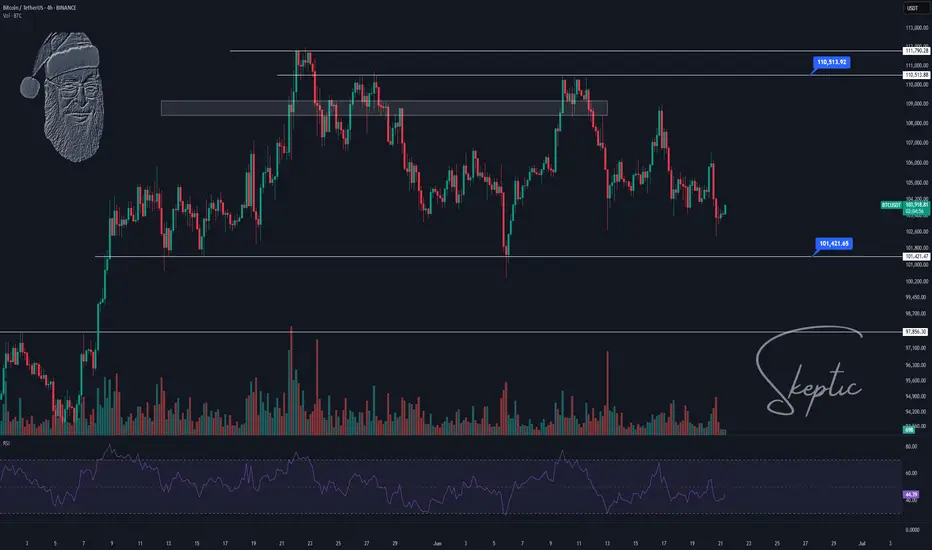
Let’s start with the Federal Reserve’s move—interest rates jumped from 4.25% to 4.5% . What’s the deal? Higher rates mean costlier borrowing , so businesses and folks pull back on loans. This drains liquidity from risk assets like Bitcoin and SPX 500, slowing their uptrend momentum or pushing them into ranges or dips. Now, mix in the Israel-Iran conflict escalating ? Straight talk: risks are sky-high , so don’t bank on wild rallies anytime soon. My take? BTC’s likely to range between 97,000 and 111,000 for a few months until geopolitical risks cool (like Russia-Ukraine became “normal” for markets) and the Fed starts cutting rates. Those two could ignite new highs and a robust uptrend. Let’s hit the charts for the technicals! 📊
Technical Analysis
Daily Timeframe: Setting the Stage
You might ask, “If 100,000 support breaks, does that mean we’ve formed a lower high and lower low, flipping the trend bearish per Dow Theory?” Absolutely not! Here’s why: our primary uptrend lives on the weekly timeframe, not daily. The daily is just a secondary trend. If 100K cracks, it only turns the secondary trend bearish, leading to a deeper correction, but the major weekly uptrend stays intact.
Spot Strategy: No spot buys for now. Economic and geopolitical risks are too intense. I’ll jump in once things stabilize. 😎
Key Insight: A 100K break isn’t a death sentence for the bull run—it’s just a shakeout. Stay calm!
4-Hour Timeframe: Long & Short Triggers
Zooming into the 4-hour chart, here’s where we hunt for long and short triggers:
Long Trigger: Break above 110,513.92. We need a strong reaction at this level—price could hit it early or late, so stay patient for confirmation.
Short Trigger: Break below 101,421.65. Same vibe—watch for a clean reaction to tweak the trigger for optimal entry.
Pro Tip: These levels are based on past key zones, but time outweighs price. Wait for a reaction to nail the best entry. Patience is your edge! 🙌
Bitcoin Dominance (BTC.D): Altcoin Watch
As BTC dips, BTC.D (Bitcoin’s market share) is climbing, meaning altcoins are taking a bigger beating. Don’t touch altcoin buys until the BTC.D upward trendline breaks. They haven’t moved yet—you might miss the first 10-100%, but with confirmation, we’ll catch the 1,000-5,000% waves together. 😏
Shorting? If you’re shorting, altcoins are juicier than BTC—sharper, cleaner drops with more confidence. Patience, patience, patience—it’s the name of the game.
Final Thoughts
My quieter updates lately? Blame the geopolitical chaos, not me slacking . I’m hustling to keep you in the loop with clear, actionable insights. here, we live by No FOMO, no hype, just reason. Protect your capital—max 1% risk per trade, no exceptions. Want a risk management guide to level up? Drop a comment! If this analysis lit a spark, hit that boost—it keeps me going! 😊 Got a pair or setup you want next? Let me know in the comments. Stay sharp, fam! ✌️