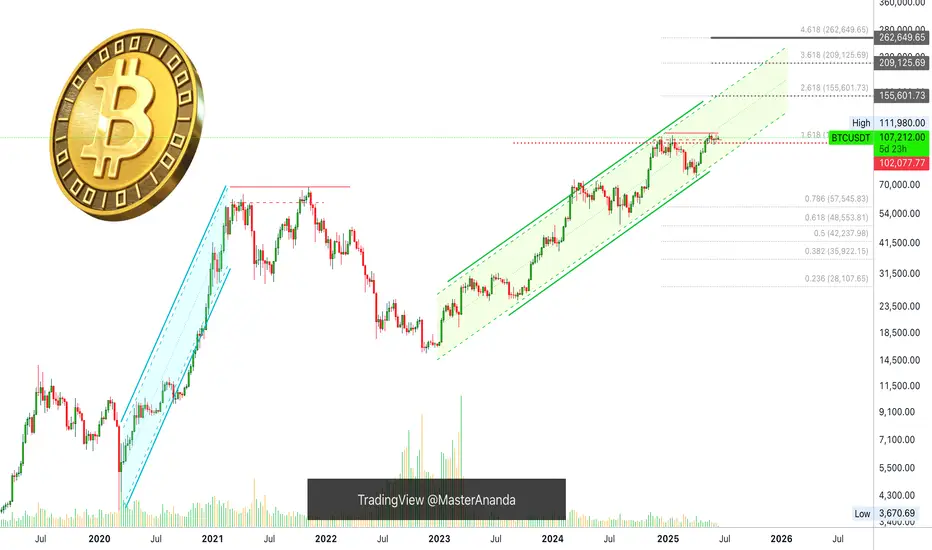
Bitcoin Will Continue Rising —Long-Term Chart —$200,000+ New ATHIn November 2021, the week after the all-time high was a crash. The weeks that followed were a continuation and the market went full red and didn't stop dropping until November 2022, a year later.
In May 2025, the week after the all-time high is neutral, sideways. Four weeks later and Bitcoin continues sideways consolidating near resistance, ready to break to new highs and continue rising.
Market conditions now are very, very different compared to 2021. Right now, we are only halfway through the current bull market, for Bitcoin, and we have room left available for plenty of growth.
In a matter of days, maybe 5-6 days, we get a new all-time high and this means not the end of the bull market but the start of the next and final bullish wave.
These targets on the chart are the most accurate of all numbers because they are based on almost 5 years of data.
Next target and minimum price for Bitcoin in the coming months is $155,601 but we know there is likely to be more, much more. With the institutional wave now in full force, banks opening to crypto because they have no other choice and the world evolving faster than anything we thought possible, we are aiming for $200,000 or more.
The next relevant level after $155,600 is $209,125. Which one is your target for this new 2025 all-time high?
Do you think Bitcoin will peak in late 2025 or early 2026?
Do you think you will manage to be successful in this round or are you bound to make the same mistakes? Over-trading, over-leverage, no being patient enough; not waiting for the right time to enter and not selling when the market is trading very high, greed; What will it be?
Do you think you have what it takes to succeed? You do!
Even if you made mistakes in the past or even if you are already doing good, you have what it takes.
If you are doing bad, this experience can be used to improve your game. If you are doing great, great, let's do better. There is never enough growth; we are happy, we are grateful but we accept abundance because we receive abundance thanks to hard work.
It is still very early but the market is starting to heat up. Once the bullish action starts, there is nothing that can stop us. The world will change for us. We will adapt to all market and geopolitical conditions, we will continue to improve and evolve.
The best one is not the one that makes no mistakes but the one that can extract learning from all experiences. Success is not being right all the time, success is never giving up.
Will you give up? Or, will you continue to trade long-term?
» Bitcoin is going up!
Namaste.
BTCUSDT.3L trade ideas
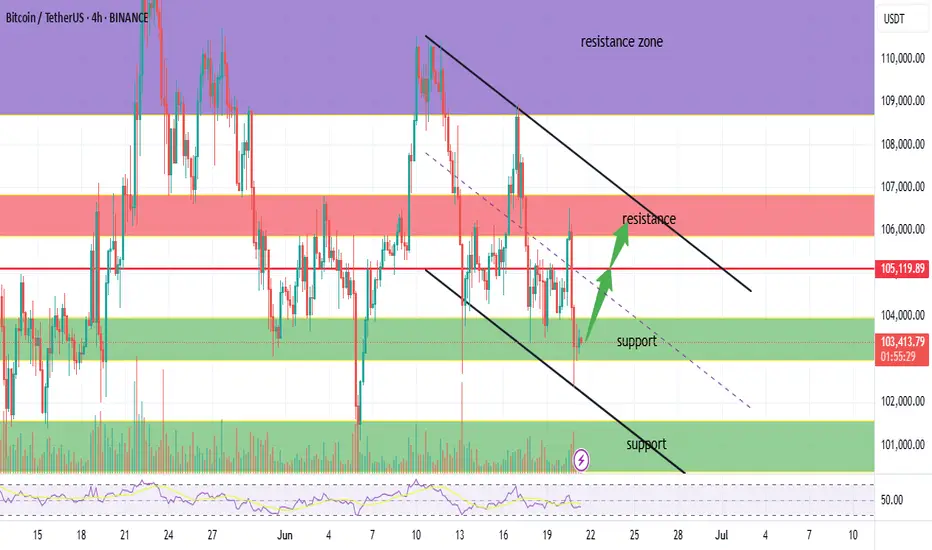
BTC at 103K – Bounce or Breakdown?1. Overall Trend:
The chart is currently within a descending channel, indicated by two parallel downward-sloping trendlines. The price continues to fluctuate within the boundaries of this bearish channel.
2. Current Price Action:
BTC has just touched the lower green support zone (around 103,000 – 102,500 USDT) and is showing a slight rebound.
→ This suggests a potential recovery toward the nearest resistance zone.
3. Key Levels:
✅ Nearest Support Zone:
103,000 – 102,500 USDT → The price is currently bouncing from this area. If this zone holds, a short-term rebound toward resistance is likely.
🟥 Nearest Resistance Zone:
105,000 – 106,500 USDT → This zone has repeatedly rejected price advances in the past. Watch closely as price approaches this level.
🟪 Major Upper Resistance Zone:
Around 107,000 – 109,000 USDT → If price breaks above the red zone, this will be the next target.
4. Potential Scenarios:
🔹 Scenario 1 (Bullish):
If BTC holds the 103K support and breaks above the descending channel → price could aim for 105K – 106.5K. If that level is breached, the next target may be 107K – 109K.
🔸 Scenario 2 (Bearish):
If the 103K support breaks → price may fall deeper toward the lower green support zone (around 101,500 – 100,500 USDT).
🎯 Summary:
Short-term trend remains bearish.
Price is reacting at support → a rebound is possible.
Need confirmation from volume and candlesticks to determine if the current downtrend can be broken.
Don't forget to like – follow – and share if you find it useful!”😁😁😁
BTCUSD 1D | big consolidation
🧠 1. Pattern and Market Structure Identification
✅ Trend and Pattern: Bullish Flag
• Structure: Price forms a descending consolidation pattern (descending channel) after a sharp upward impulse — this is a classic characteristic of a bullish flag.
• Breakout volume occurred from the consolidation zone near the green support area → an early signal that bulls are active.
• However, the price is currently retesting the breakout area and is testing the demand zone again.
📊 2. Volume Analysis
• Volume spikes (purple arrows) occurred at several key points:
• Initial breakout
• Support retest
• High volume during the breakout = valid breakout confirmation.
• Currently, volume is slightly declining = a signal of consolidation and possible accumulation.
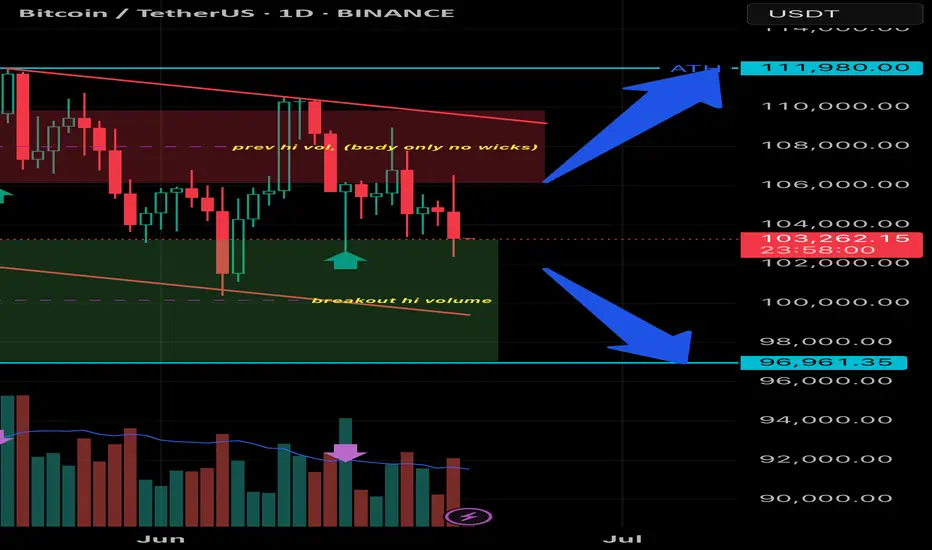
📉 3. Support & Resistance Levels
• Strong Support: 96,961 USDT (marked by the blue line and breakout volume).
• Major Resistance: 111,980 USDT (all-time high and projected target from the flag breakout).
• Current Price: 103,272 USDT → sitting between these two key levels.
🎯 4. Potential Price Direction
Bullish Scenario:
• If the 96,961 USDT support holds, price could continue upward → the bullish flag target = projected height of the flagpole.
• Conservative Target: 111,980 USDT (ATH)
• Aggressive Target (if ATH breakout occurs): 115,000+ USDT
Bearish Scenario:
• If price breaks below 96,961 USDT with strong volume, it could invalidate the bullish pattern and drop further to the 92,000 – 90,000 USDT range.
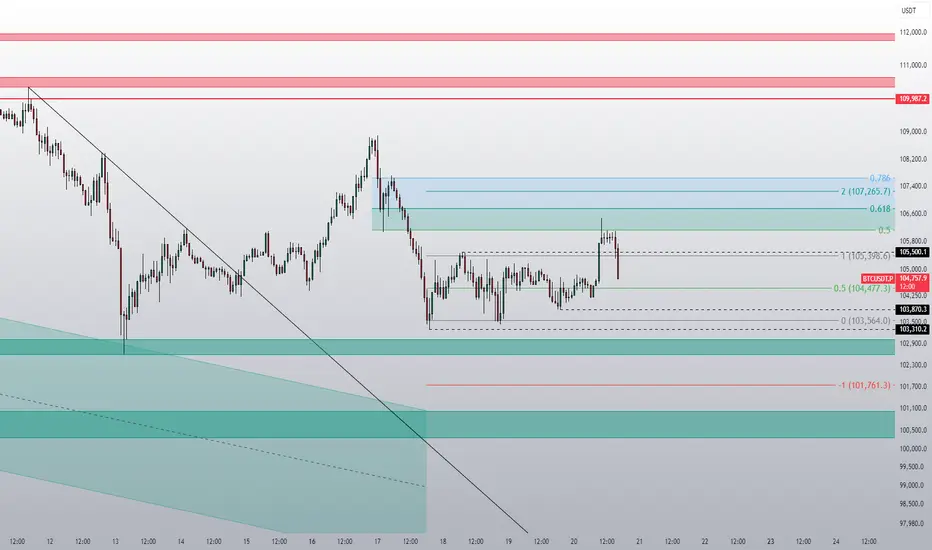
bitcoin bullish and bearish BINANCE:BTCUSDT.P
bullish
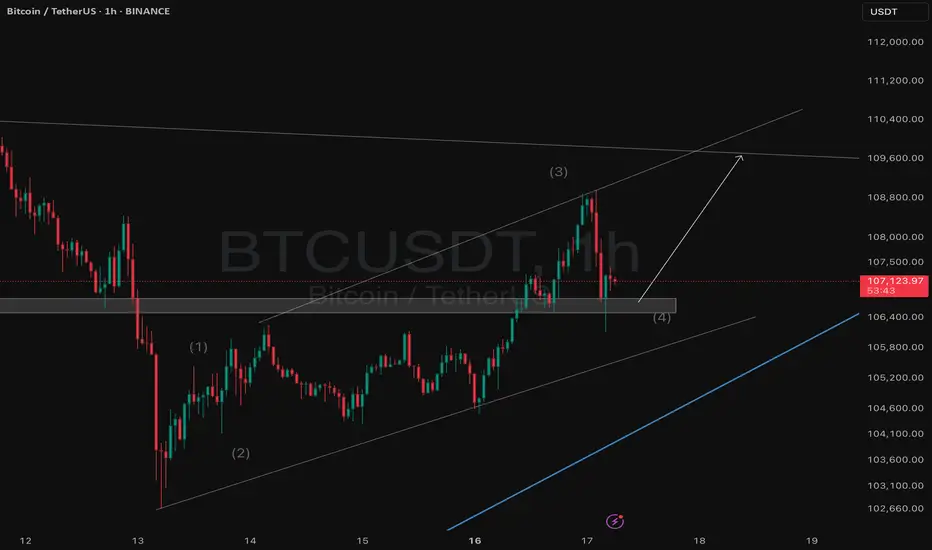
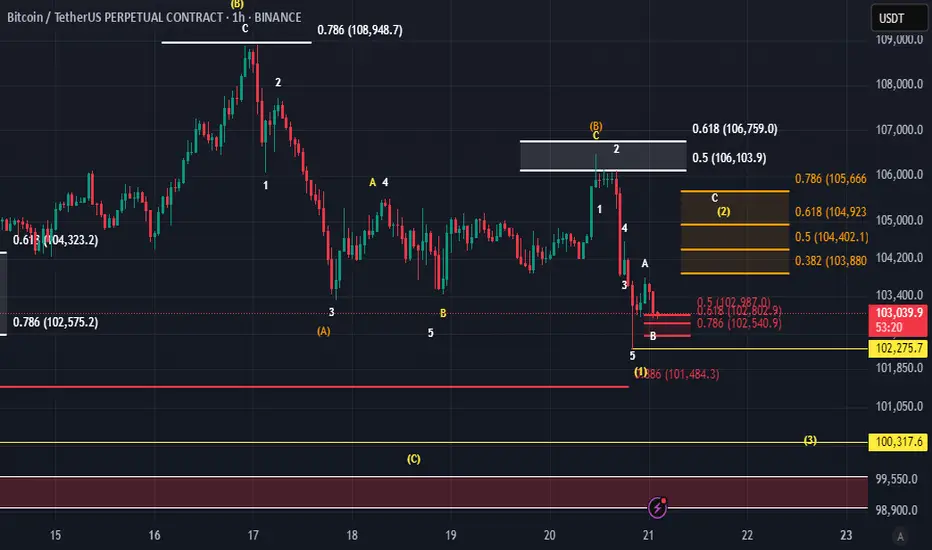
🔹 Technical analysis according to Elliott waves (time: 1 hour)
📌 The pattern shown on the chart shows a complex structure that includes a complex correction within the larger wave (B), and the following is clear:
🔸 Main waves:
Wave (1) up from the bottom has been confirmed.
It was followed by a corrective wave (2) that ended near the 0.786 Fibonacci level = 102,575.
Then the upward wave (3) started, and it seems that it has been completed or is about to be completed.
🔸 Current status:
The price is currently moving within a small corrective wave, likely wave (4).
Current major support is located at: 🔸 102,275.7 (very important level) 🔸 100,317.6 (in case the correction extends)
🔸 Critical resistance areas:
For the bullish scenario to be valid, the resistance must be broken:
106,759 (0.618 Fibonacci ratio)
108,948 (0.786 – peak of wave C)
---
🔹 Important technical points:
🔸 The last correction (A)-(B)-(C) shows a clear triple structure, indicating that wave (2) has been completed.
🔸 The price is currently bouncing off the 0.5 - 0.618 Fibonacci levels (104,402 - 104,923), which reinforces the possibility that wave (2) has actually ended, and that we are currently starting an upward wave (3).
---
✅ Conclusion:
✅ As long as the price is above 102,275, the upward scenario through wave (3) remains valid.
⚠️ Breaking 100,317 indicates the failure of the bullish scenario and a structural shift in the waves.
🔻 Alternative (Bearish) Scenario – Short-Term:
If the price fails to maintain the current support at 102,275, we may not be in wave (4) but rather at the beginning of a new downward wave within a broader corrective scenario, as follows:
---
🔸 Wave Interpretation:
🔹 Wave (B), which completed at the peak near 108,948, likely marked the end of an upward correction.
🔹 The current downward wave from that peak could be:
Either wave 1 of C within a larger correction,
or the beginning of wave (C) within a bearish (A)-(B)-(C) pattern.
---
🔻 Potential Downside Targets in This Scenario:
1. Breaking 102,275 = Confirmation of the beginning of a new downward wave.
2. First Target:
🔸 101,484 (1.618 Fibonacci Extension – Wave 1 Expected)
3. Second and Stronger Target:
🔸 100,317 = Previous Major Support, Representing an Important Structural Test Area.
4. Third and Most Extreme Target in This Scenario:
🔸 98,800 – 99,260 = Possible Wave C Extension (Corresponds to a Larger Downside Scenario).
---
⚠️ Failure Signal:
Remaining below 105,926 (Previous Sub-Wave Resistance) maintains selling pressure.
Any weak bounce and lack of a clear wave 5 upwards = an additional sign of bearish dominance.
---
🔻 Conclusion:
✳️ The bearish scenario assumes that the peak at 108,948 was the end of corrective wave (B), and that we are now in a downward wave C targeting areas between 101,400 and 99,200, and possibly lower.
✳️ A break of 102,275 would be key to activating this scenario.
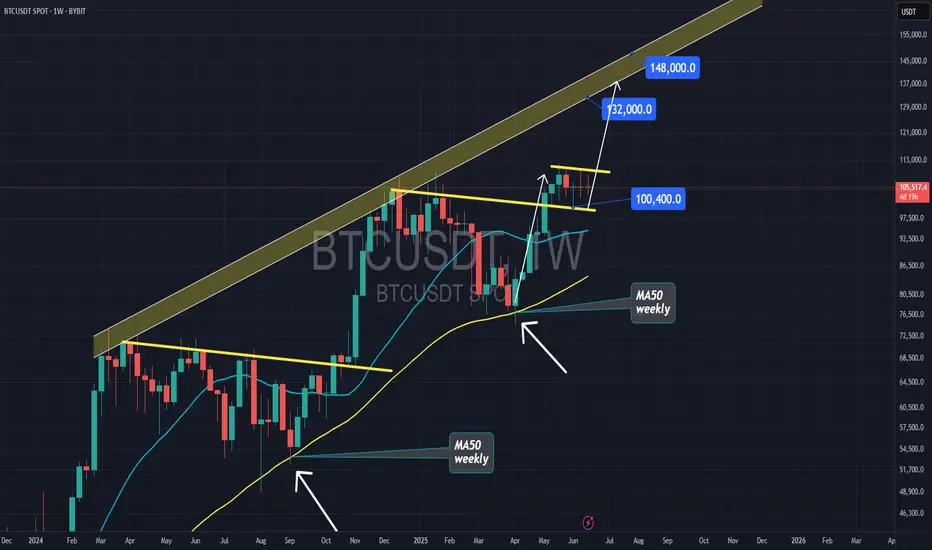
weekly BULL-FLAG!it looks like after the rally bitcoin had since early April, now this is a bull-flag pattern on weekly and that can push bitcoin to $140k.
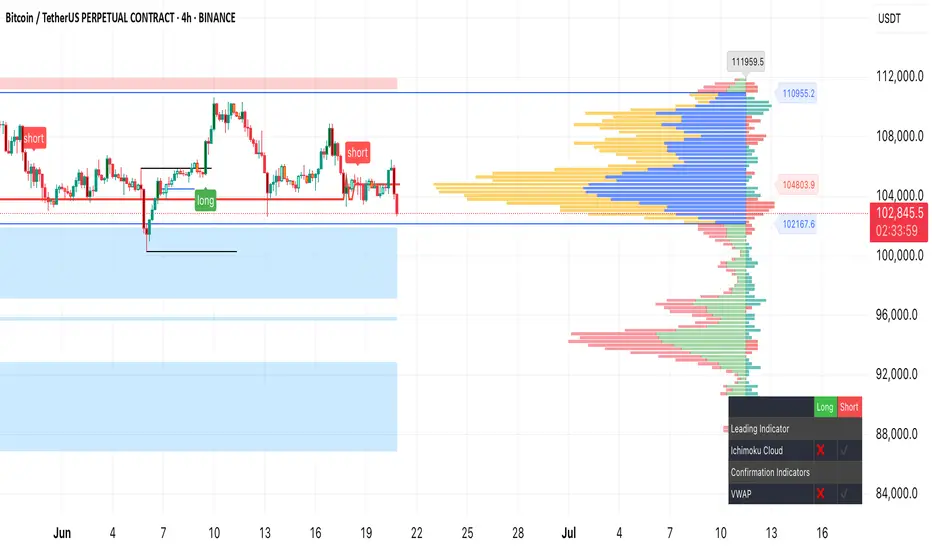
BTCUSDT - 4H Supply-Demand + Order Flow ViewBINANCE:BTCUSDT is struggling to hold above the 103K zone, which has now flipped into resistance. Price recently tapped into the 104K–105K supply zone and faced rejection, confirming bearish pressure. The most recent short entry aligns with overhead liquidity absorption and weakness near the high-volume node (~105K) on the volume profile.
We're now revisiting the previous demand zone (101K–102K), which has held multiple times but is weakening. A breakdown below this level opens up the next major demand zone around 98.5K–99K and possibly 94K if momentum accelerates.
🔻 Bias: Bearish unless 104K is reclaimed.
🔍 Watching: Reaction at current support and volume cluster near 100K.
📊 Tools Used: S/D Zones, VWAP, Volume Profile, Confirmation Indicators.
📌 Trade safe. Set alerts and don’t chase.
btc short setupSL 10500
tp 102500
with ongoing world events and liquidations available at that range, its very much possible that bitcoin will and must tap 102 or lower for a creating fear and wiping retailers out. But short with caution might give fake outs to trap longs.
thanks
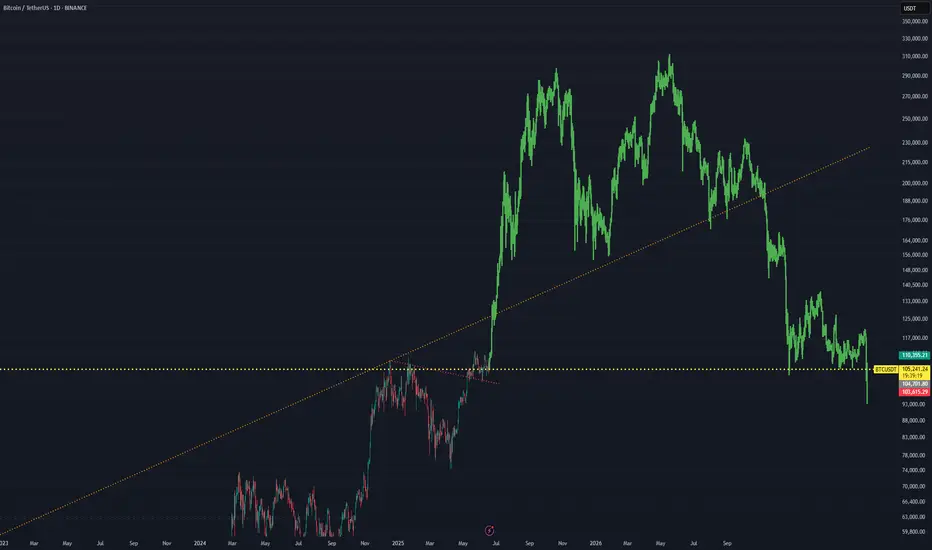
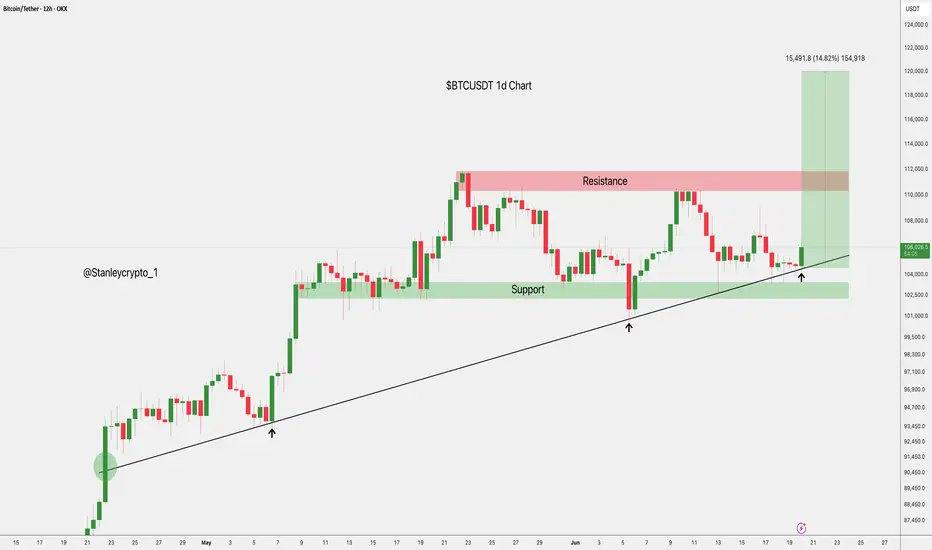
BTCUSDT Long-Term Roadmap: From Capitulation to a $310K BreakoutAfter a confirmed breakdown from both the ascending trendline and the horizontal support near $110,000, BTCUSDT has entered a bearish phase. However, the projected green candles in your forecast suggest a long-term recovery structure—a potential accumulation phase, followed by a breakout cycle toward a new all-time high at $310K.
📈 Long-Term Phases in the Projection:
1. Phase One: Capitulation & Accumulation (~$65K–$90K)
BTC breaks down below $100K, potentially finding support between $65K and $90K.
This becomes a classic accumulation zone, where smart money begins to position.
Volatility decreases, and price action flattens while volume builds.
2. Phase Two: Recovery & Structure Break (~$105K–$110K reclaim)
Price reclaims the broken support at $105K–$110K, now acting as resistance.
A successful flip of this level into support signals the start of a new bullish cycle.
Market sentiment starts to shift from fear to cautious optimism.
3. Phase Three: Expansion Phase ($110K → $180K)
Once past $110K, BTC enters a momentum-driven rally.
Important psychological levels like $120K, $150K, and $180K are reached.
Institutions and retail FOMO begin re-entering the market.
4. Phase Four: Mid-Cycle Reaccumulation (~$180K–$210K)
BTC consolidates in a wide range, forming a reaccumulation base.
This becomes the launchpad for the final parabolic leg upward.
Market disbelief turns into euphoria.
5. Phase Five: Parabolic Rally to $310K
Once $230K–$250K resistance is cleared, BTC enters parabolic mode.
Targeting the macro top at $310,000, aligning with a future cycle peak (likely post-halving cycle).
Could happen within 12–24 months, depending on macro and cycle momentum.
🔍 Key Technical Conditions to Watch:
Successful reclaim of $110K on high timeframe (weekly close)
Formation of a higher low above $90K
Volume confirmation during breakout of $150K and $180K
Break and hold above $230K confirms macro breakout
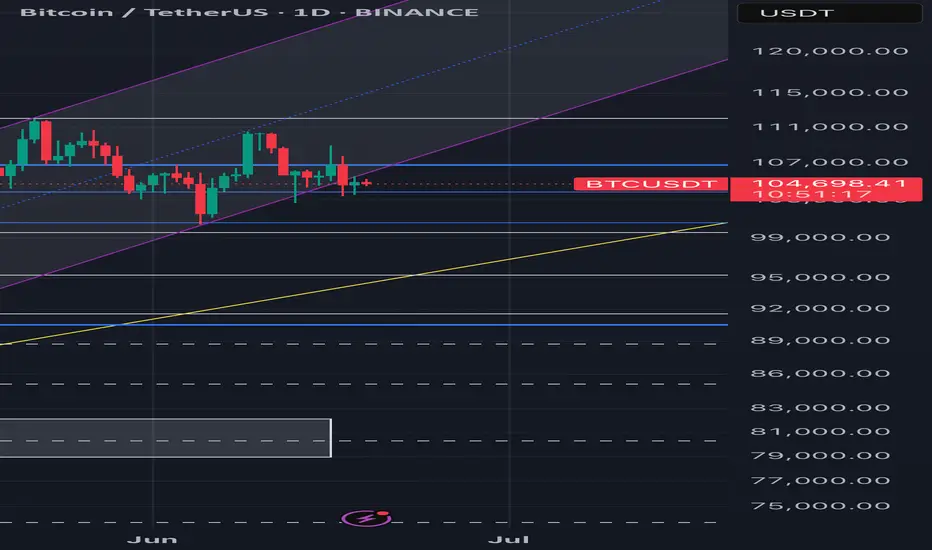
RangesReturning to range low form here is normal price action. Breakout to one side, breakout to the other, before the real breakout happens — most likely in the direction of the bigger trend, which is up.
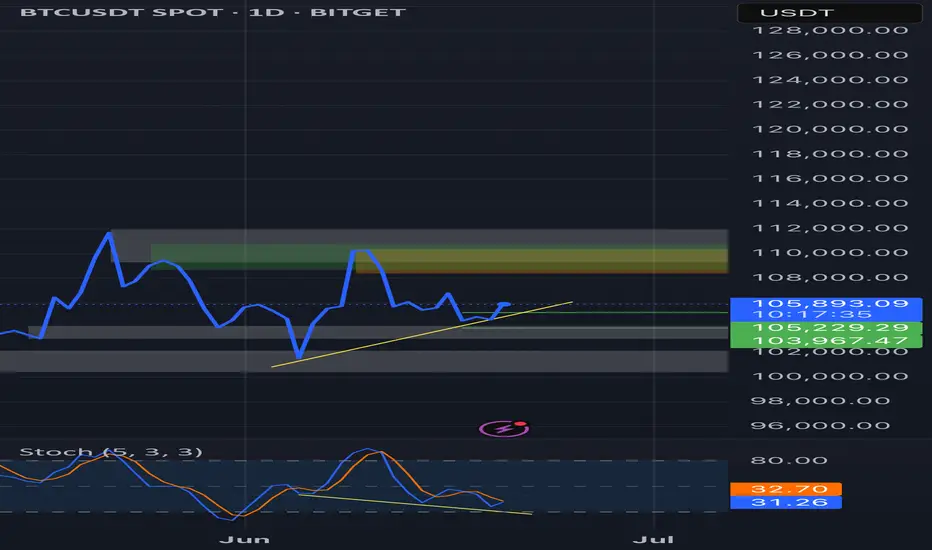
Bullish Divergence on Daily TimeframeBullish posible ! Strong confirmation for BTCUSDT.
Good luck and DYOR
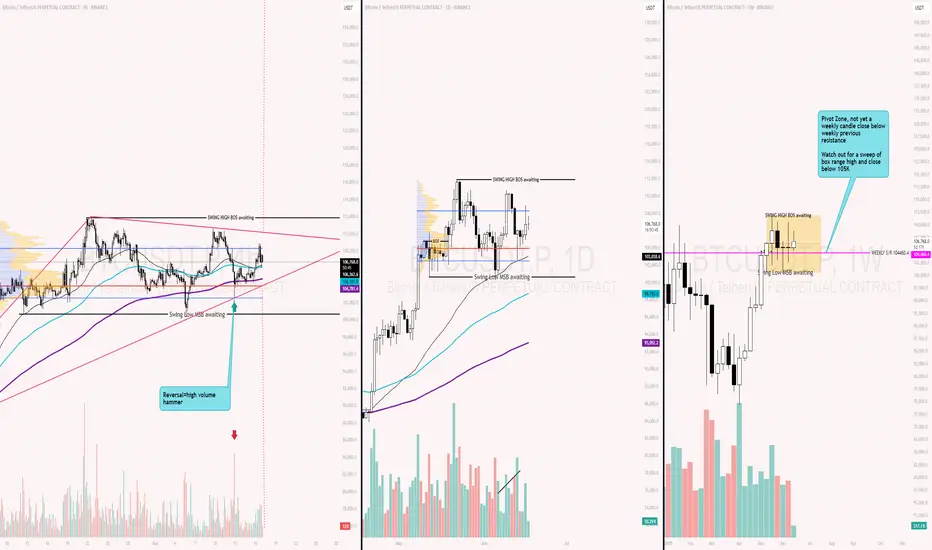
BTC Weekly BOX breakout or possible false breakoutWe have BTC setting up a nice weekly consolidation box, with candle closes consistently holding above the previous weekly ATH resistance. Multiple Doji closes indicate consolidation and compression. At the bottom of the box, we’ve seen strong reversals with high volume. The 4H chart is consistently defending the 200 EMA, supporting the idea that the daily trend remains strong — although direction is currently unclear.
Is distribution happening? It’s not easy to short just yet. We might still see a false breakout, position filling, and then a return to the box range. I’d be interested in a swing short if that happens — especially if the weekly candle closes with high volume and signals a reversal, indicating a potential bearish shift on the daily chart. Let’s keep in mind that June is historically weak, especially during the last two weeks.
On the long side, I’ll only be looking for entries after a daily break of structure (BOS).
Does not need to goes to the highs, we could drop below 100K if we lose box range low with a MSB.
Interesting days ahead — patience is key, as we currently don’t have many high-probability setups.
$BTCUSDT Eyes $120K After Key Support BounceBTCUSDT is holding strong above the ascending trendline and key support near $104K.
A fresh bounce suggests bullish momentum, with potential to break the $110K resistance.
If that happens, the next target could be around $120K. Trend remains bullish above support.
DYRO, NFA
#Bitcoin Roadmap for 2025–2026 A Deep Corrective Scenario UnfoldI believe the major top for Bitcoin was already printed on May 21st, at $111,000.
From here, I expect a three-wave corrective structure to unfold:
• 🔻 First drop to $69,000
• 🔼 Then a relief bounce to $85,000
• 🔻 Followed by a deeper decline to $46,000
If Bitcoin breaks the historical ascending trendline after reaching $46,000, I anticipate a five-wave bearish structure to continue:
• Further drop to $33,000
• Temporary correction up to $45,000
• And finally, a capitulation wave towards $19,000
I know this may sound early or even extreme to some, but if you review my previous Bitcoin outlooks going back to 2014, you’ll notice that many of these scenarios—however bold—have eventually played out with precision.
📌 Invalidation Level:
This scenario would be invalidated if Bitcoin closes a weekly candle above $115,000.
Good luck, fellow traders—stay sharp and prepared. 🧠📉
⸻

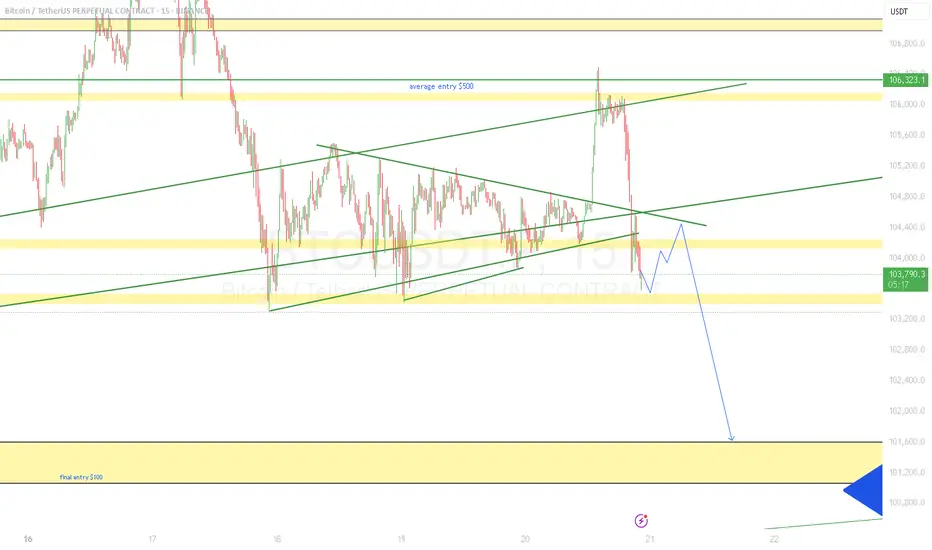
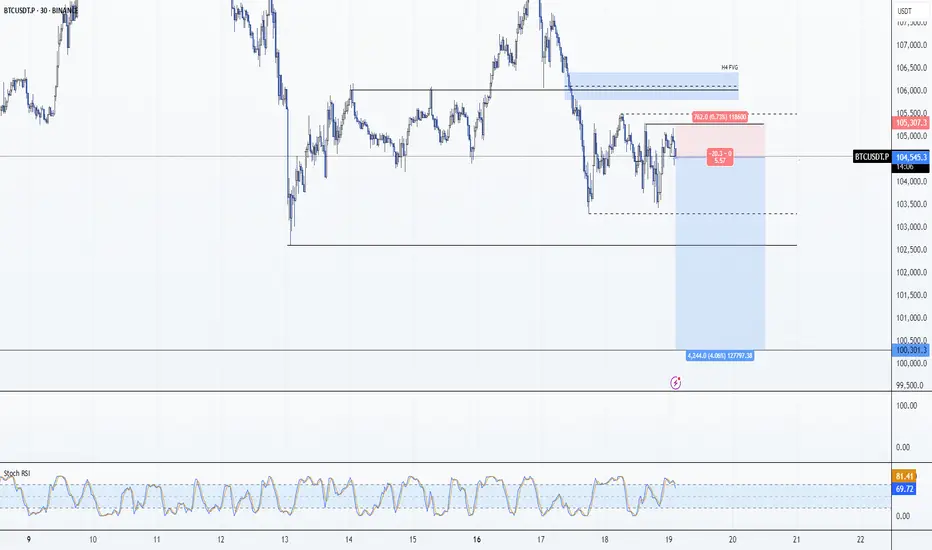
BTC/USDT Technical Analysis🔍 BTC/USDT Technical Analysis
📆 Chart Context:
Published on: June 18, 2025
Instrument: Bitcoin (BTC) vs Tether (USDT)
Timeframe: Appears to be 4H or 1H based on candle width and structure
🧠 Market Structure
🔸 Lower Highs Forming
Clear rejection from around 110,000–112,000 USDT
A sequence of lower highs suggests bearish momentum
Market is failing to break previous highs, signaling potential reversal
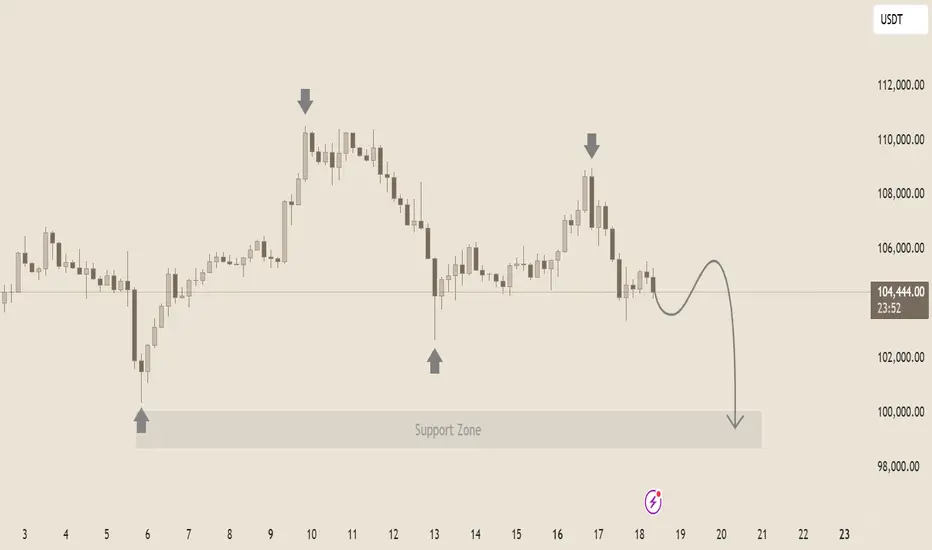
🔸 Strong Support Zone
Marked between $99,000 – $100,000
This level has previously caused price reversals (see June 6 and 13 wicks)
Currently being tested again — buyers have defended this area twice
🔁 Price Action & Candlestick Behavior
Recent candles show indecision and weakness after a mild bounce
Wick rejections near $106,000–$107,000 point to supply zone
Projected path (gray curve) implies a small pullback, then a breakdown into the support zone
📉 Prediction: Price Outlook
✴️ Short-Term (1–3 Days):
A likely pullback to $106,000, then a drop toward $100,000–$99,000
If support fails to hold, next target is $96,000–$94,500
✴️ Bearish Breakdown Confirmation:
Candle close below $99,000 with high volume = clear sell signal
In this case, bears may aim for $92,000–$90,000 next
✴️ Bullish Scenario (Less Likely):
If price holds above $104,000 and breaks $108,000, next resistance: $110,500–$112,000
📊 Key Technical Zones
Zone Type Price Level (USDT) Note
Resistance $110,000–$112,000 Previous top, major supply zone
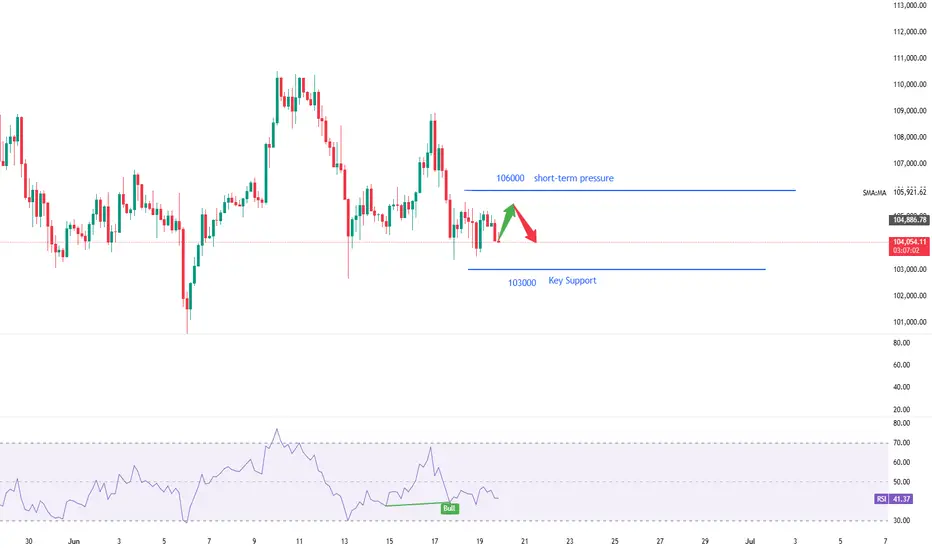
Short-Term Resistance $106,000–$107,000 Weak bounce, possible entry area for shorts
Current Price ~$104,376 Weak consolidation
Support Zone $99,000–$100,000 Key demand area
Breakdown Target $96,000–$94,000 If support fails
✅ Professional Outlook Summary
Market Bias: 📉 Bearish
Action Zone: 🔍 Watching $106K as potential short entry
Support Critical: $99K must hold, or deeper drop
Risk Level: ⚠️ High volatility likely
Today's BTC trading strategy, I hope it will be helpful to youBitcoin prices have fluctuated frequently in recent days, presenting a complex landscape. Looking at price data from the past week, Bitcoin has seen significant volatility. On June 13, triggered by Israel's airstrikes on Iran that escalated tensions in the Middle East, Bitcoin hit a low of $102,614 per coin—edging close to the $100,000 threshold. As of June 20, Bitcoin hovered around $104,500. While this represents a rebound from the recent low, prices remain relatively unstable, reflecting intense battles between bulls and bears with no clear trend established.
Reviewing this year's price trajectory, Bitcoin fell below $40,000 per coin at the start of 2025 before launching a robust rally. In less than a year, prices more than doubled, briefly hitting $99,000 per coin to set a new all-time high. Recent volatility can be seen as a correction after the prior surge—a common occurrence in crypto markets, typically a process where the market digests earlier gains and seeks a new price equilibrium.
Global macroeconomic conditions and shifts in crypto regulatory policies significantly impact Bitcoin prices. Continuously monitor the Federal Reserve's monetary policy stance: if the Fed signals rate cuts or implements easing, increased market liquidity may fuel Bitcoin's rally, warranting appropriate long position additions. Conversely, if the Fed hikes rates or maintains a hawkish stance, exercise caution and consider reducing positions. Meanwhile, track global crypto regulatory dynamics: positive policies from more countries can strengthen long positions, while signals of regulatory tightening require prompt strategy adjustments and position reductions to mitigate risks. Additionally, stay attuned to market sentiment and investor psychology to avoid herd behavior.
In Bitcoin's complex and volatile environment, long strategies must be flexibly adjusted. Investors should align with their risk tolerance and investment objectives, strictly implement strategies, and strive to maximize returns while minimizing risks.
Today's BTC trading strategy, I hope it will be helpful to you
BTCUSDT BUY@103000~104000
SL:102000
TP:105000~106000

BTC will get doomed to 96k?NO not now, but you can see it ditto follows the movement as said earlier and shown. with little liquidity left on the top of it!

Future market trend predictionIn the short term, the price trend of Bitcoin is full of uncertainties. On the one hand, if the global macroeconomic environment continues to deteriorate, with slower economic growth and increased inflationary pressures, it may prompt more investors to seek safe-haven assets. As an asset with certain safe-haven properties, Bitcoin may attract some capital inflows, providing support for its price. However, if regulatory policies are further tightened in the short term, especially if more stringent restrictive measures are introduced in countries and regions where Bitcoin trading is active, then the price of Bitcoin may face significant downward pressure.
you are currently struggling with losses,or are unsure which of the numerous trading strategies to follow,You have the option to join our VIP program. I will assist you and provide you with accurate trading signals, enabling you to navigate the financial markets with greater confidence and potentially achieve optimal trading results.
BTC: Short 19/06/25Trade Direction:
BTC Short
Risk Management:
- Risk approx 0.25%
Reason for Entry:
- M30 + M15 Bear Div
- Rejected off Monday low
- Failure to break weekly open
- H1 overbought
- Market is choppy, HTF Bearish
Additional Notes:
- Compounding shorts to maximize edge if trade confirms, currently have a risk free SOL short running. Moving my risk to this.
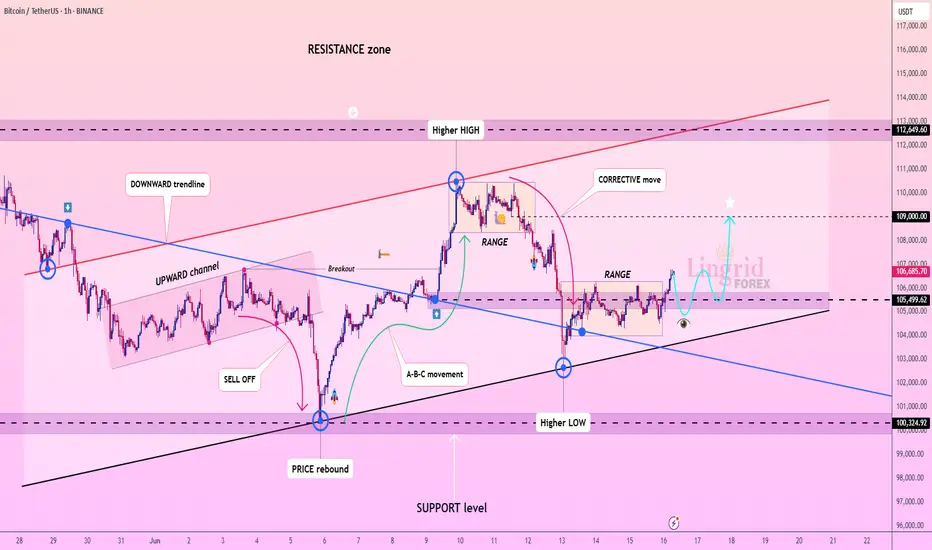
Lingrid | BTCUSDT potential Bullish Continuation After PullbackThe price perfectly fulfilled my last idea . BINANCE:BTCUSDT has formed a higher low after rebounding from the trendline near $104K and is attempting to stabilize within a minor range just above $105.5K. The broader structure shows a clean breakout from the downward trendline, followed by consolidation, suggesting accumulation. A bounce from the $105K–$105.5K support area would favor a continuation toward the $109K resistance level.
📈 Key Levels
Buy zone: 105,000–105,500
Sell trigger: break below 104,800
Target: 109,000
Buy trigger: close above 106,800 with strong volume
💡 Risks
Breakdown of support could retest the $100K region
False breakout may trap bulls above $106K
External macro news could trigger short-term volatility
Traders, if you liked this idea or if you have your own opinion about it, write in the comments. I will be glad 👩💻
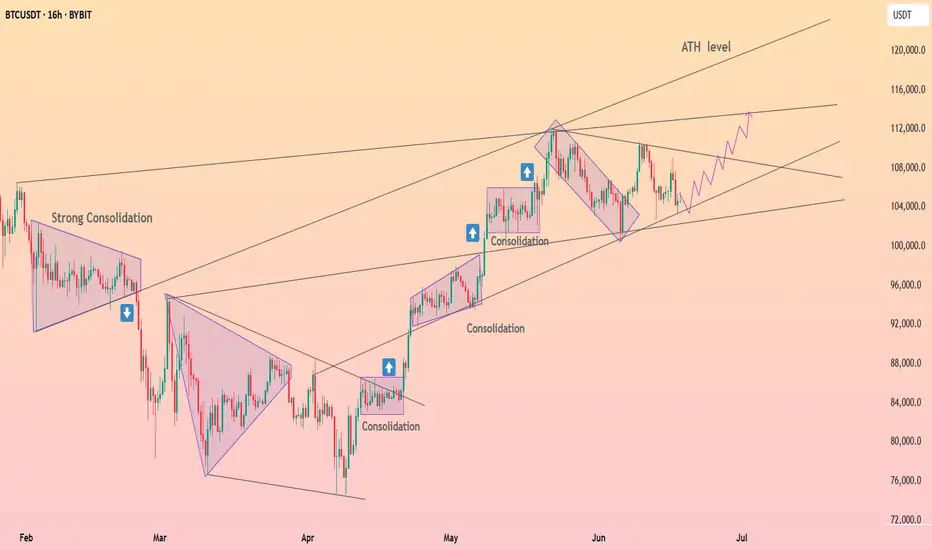
HolderStat┆BTCUSD forms a triangleBYBIT:BTCUSDT trades inside a narrowing flag between 104 k and 108 k. A push past 108 k activates the pole projection toward 112–114 k and possibly the ATH rail; rejection sends price to retest 102 k support before the next offensive.
BTC bullish rally before the fall?I am expecting a bullish Rally to the previous high since it's a third wave of current impulse I'm expecting BUY from here to the target mentioned. Will be exciting if any reversal signs occur. (BTC should touch 140,000+ in 2 months.)
entering buy from 107400
*A fall still pending* BITSTAMP:BTCUSD