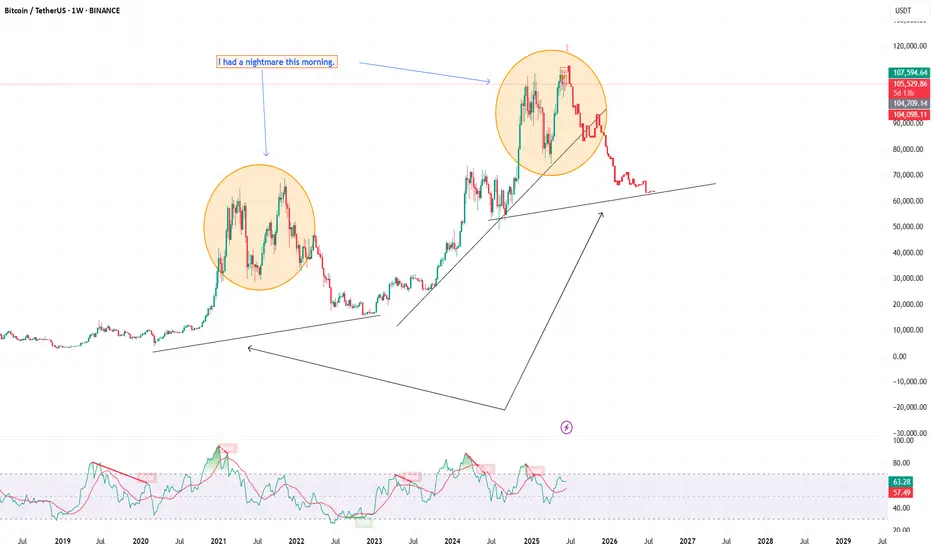
I had a nightmare this morning.Recently, I published my analysis about BTC and found that BTC is following a rising channel and is being supported by fib retracement.
But unfortunately, BTC hasn't shown any remarkable movement so far, and came back again the the support area.
I feel this is not a good sign for BTC.
ON a weekly view, It May repeat its previous movement.
I am publishing my reservation about BTC, be careful about BTC.
BTCUSDT.3L trade ideas
BTC - 106k now, whats next?106k is a rotational move, means the top liquidity get inside at first hence and then it goes down, watch it for
Trade #12: $BTC - Bullish Alignment Confirmed! Long Setup WatchRecap & Lesson Learned:
In Trade #11, I noted the daily structure was strongly bullish, but the 1HR chart was bearish. My expectation was for price to dip toward the 98,000 daily demand zone. However, the 1HR structure reversed structure before reaching that level — a reminder that markets don’t always follow our ideal path.
The Shift: Timeframe Synced = Conviction Amplified!
Now, BOTH daily AND 1HR structures are BULLISH and aligned. This synchronization signals robust momentum, and I’m positioned fully bullish — awaiting the right technical trigger to enter a long trade.
The Opportunity: Precision Entry at Demand
I’m eyeing the green demand zone near 106,500 for a potential long entry. This is where buyers previously stepped in aggressively, making it a high-probability reaction area.
Key Refinement: Patience & Confirmation
(Learning from Trade #11):
I will NOT enter blindly at 106,500. Instead, I’ll:
1️⃣ Watch price behavior for signs of strength
2️⃣ Confirm my entry criteria are met
3️⃣ Execute ONLY if evidence validates the setup.
Why This Discipline?
"It’s better to enter slightly higher WITH confirmation than chase a ‘sniper entry’ without confirmation."
No confirmation = No trade. Period.
My Plan:
WAIT for price to test ~106,500.
CONFIRM buyer strength and alignment with my rules.
EXECUTE a long position only if all boxes are checked.
Stay Alert, Stay Patient.
The trend is our friend — but only if we respect its rhythm. Updates to follow!
✅ Key Takeaways:
Daily + 1HR = Bullish Synergy.
Watch 106,500 for a confirmed long entry.
No confirmation = No trade. Discipline over FOMO.

BTC Rally in Play — Time to Lock In Profits and Wait for FOMC?📈 Bitcoin Rally in Play — Time to Lock In Profits and Wait for FOMC?
After the expected upward move, I believe now is a good time to either close your positions or secure partial profits, whether you're in Bitcoin or altcoins. The market will offer new opportunities, so there’s no rush.
With the upcoming FOMC meeting on Wednesday, I suggest holding off on new entries until the news is out and volatility settles.
Currently, the resistance at $108,347 isn’t confirmed as valid yet — but if we see a rejection from that level, it could become a short-term barrier. On the downside, to maintain this recent bullish momentum, the support at $106,568 must hold.
---
💬 How are you managing your trades ahead of the FOMC? Took profits already or still holding? Drop a comment below — always good to hear your plan!
US entering the war,~25% drop will happen if it's gonna escalateUS about to enter the war with Iran, as long the war finish quickly with US destory Fordow nuclear site and other facilities, we can stop around 94k$ zone,
war escalating more, will engage a bigger drop in markets.
Likely they will announce it after markets close on Friday. stay updated.

H&S $92K Short + CME Gap Fill Towards Support LineCurrently CME Gap already hit H&S with are target towards Gap Fill

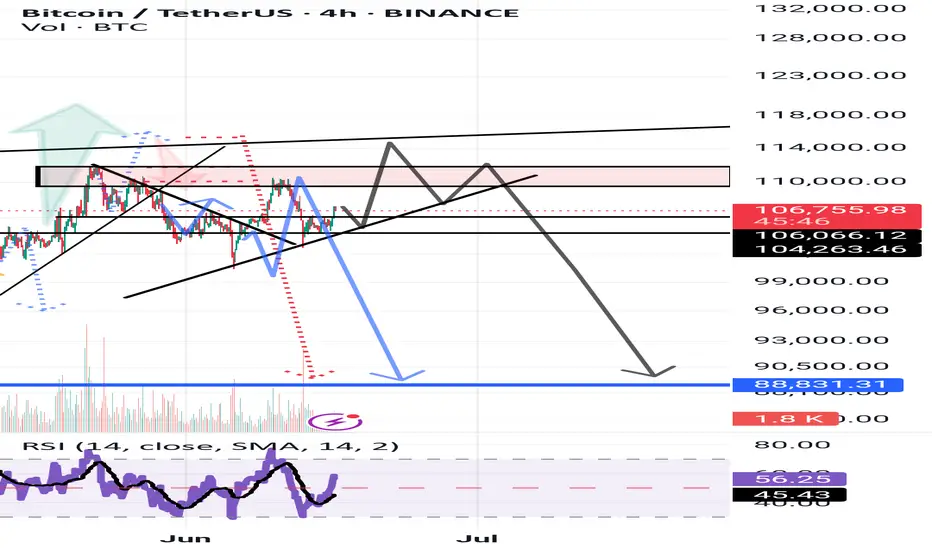
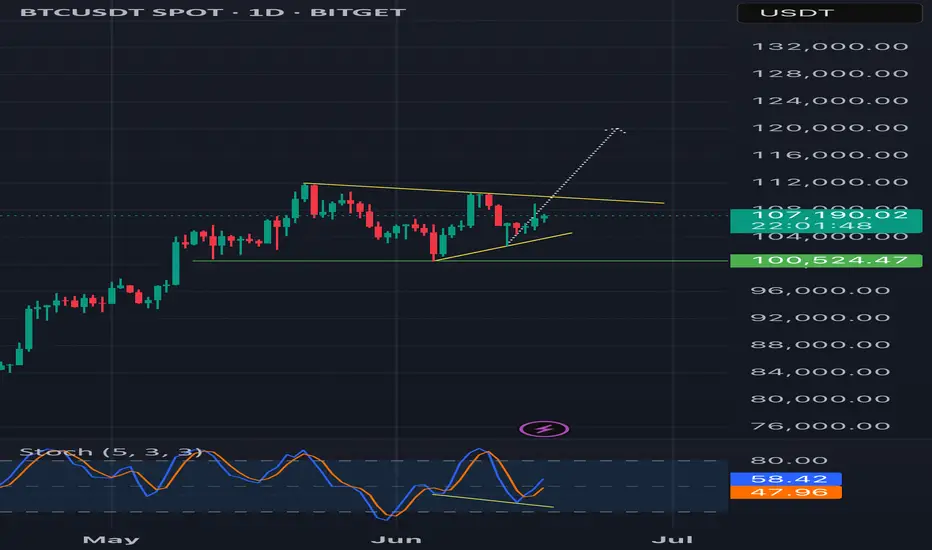
Kingbtc 3 4hWelcome to KIN BTC 3. It is expected that Bitcoin can form an upward step, initially reaching 108,200. After that, with a lower probability, a higher peak may also be formed. However, ultimately, the level of 88,700 is expected to be seen.
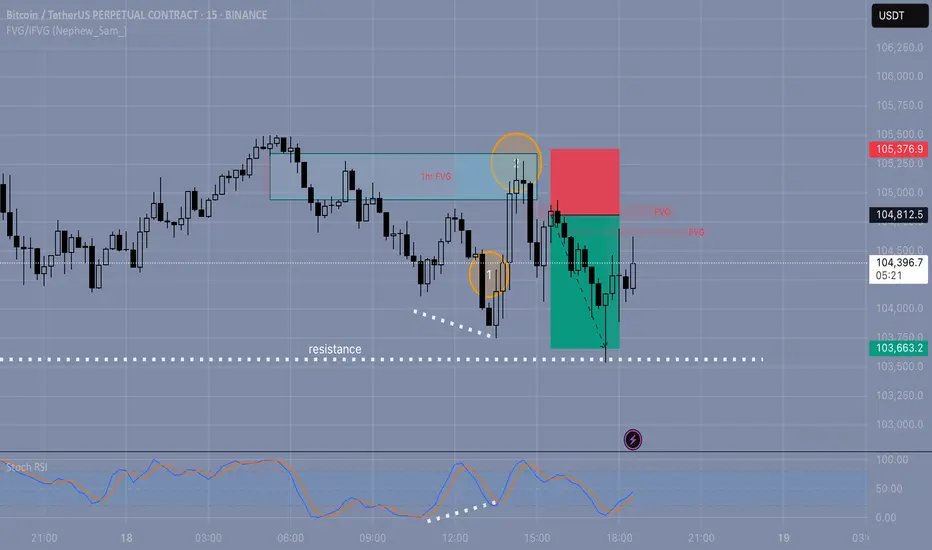
BTC Short | FVG Setup + RSI Filter | 18.06
Smart Money Concept | Intraday Trade | 1:2 RR
🔍 The setup:
Today I was watching for a short opportunity.
Price reached a key level and formed a bearish FVG — looked clean at first.
But I held off entering because I noticed RSI divergence — a red flag I always consider when expecting a potential level break.
💡 Why it matters:
RSI divergence often signals weakness in momentum.
For me, it's a key filter that helps avoid fake breaks — this was a good example of how I apply it.
📈 What happened next:
Price moved up to test the 1H FVG (zone #2) and formed another FVG slightly lower.
That second one was my entry point for the short.
🎯 Target:
I exited at a 1:2 risk-reward, which is my minimum.
The day was ending, and I didn’t want to hold the position longer — I’m not convinced the down move would continue cleanly (possible wicks or traps).
🤔 Question to the community:
How do you filter FVG entries?
Do you also use RSI or wait for structure shifts?
And what’s your outlook on BTC from here?
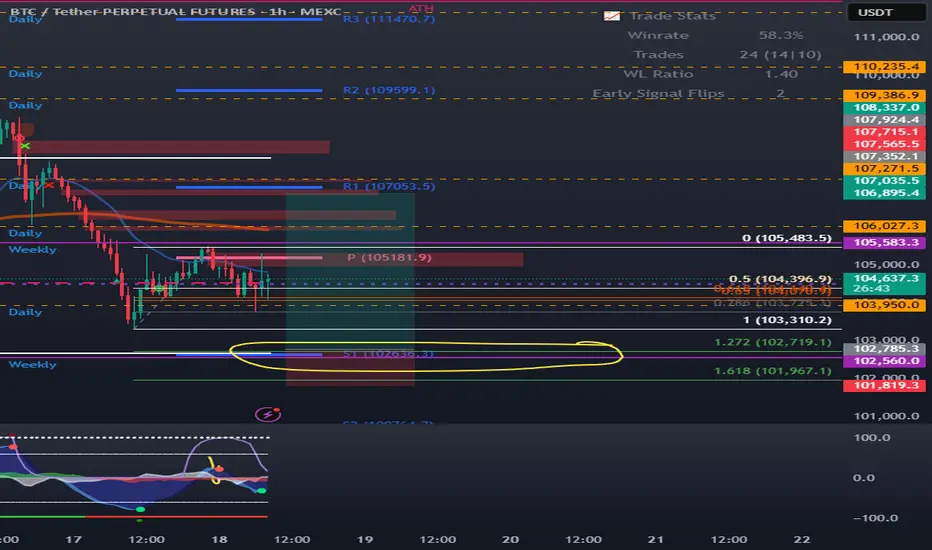
BTC Bitcoin VAL, S1, Weekly, 1.27 confluence at $102,700BTC Bitcoin VAL, S1, Weekly, 1.27 confluence at $102,700
If we do drop more, this is where I'm looking to buy. Lots of support in this area for a bounce back to the POC. A rejection of POC means we may be looking at 100k. Get past it, then target is VAH around 106k.
Bearish btcLooking at the market and what is going on around the globe 🌍
From my technical stand point btc would drop (80k)
BTC long now ! Bullish divergence confirm !Bullish divergence in daily timeframe is confirm. It might be good for take long position
#isharewhatitrade
#dyor
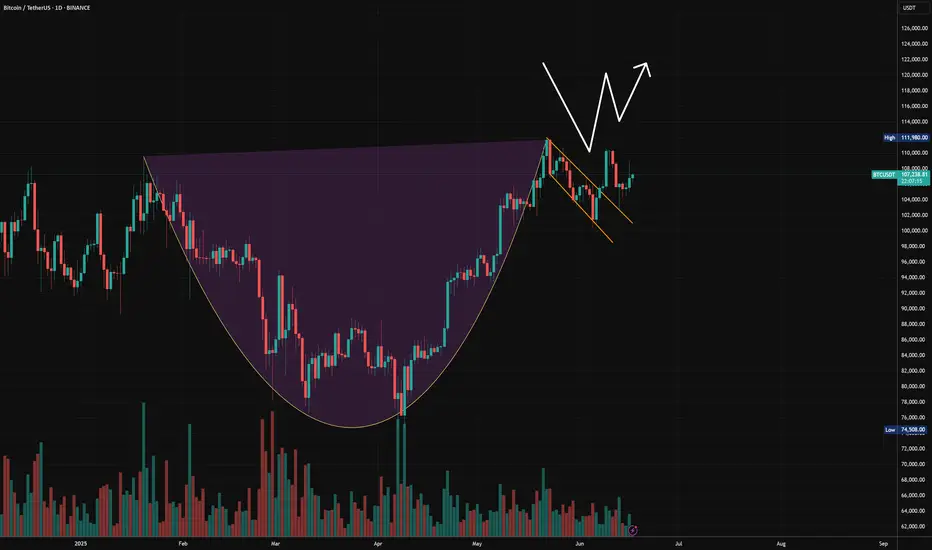
W pattern off the handle. #Bitcoin to 168K.From my most recent post of the Cup & Handle I see a W pattern. Price broke out of the handle to retest to confirm support creating a double bottom.
This is a very good sign to confirm the C&H for this bullish near future.
If we continue upwards and break the psychological resistance zone at 111K, I expect 168K within 3-6 months.
I attached the Cup and Handle analysis to the current.
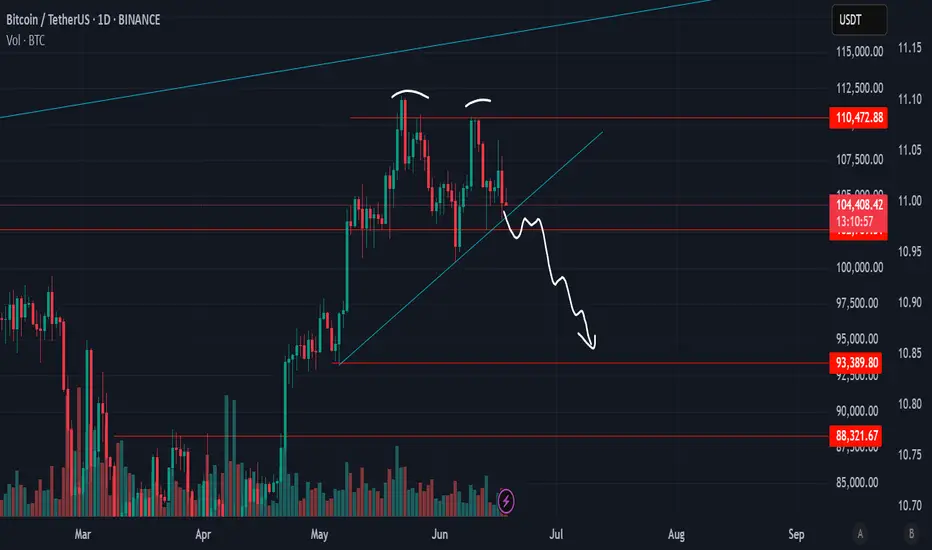
Bitcoin Double TopDouble top formation and now in support line and support trendline
if this line break, it will give rug and rug in altcoin, and maybe bitcoin can heading to 94k
But if bitcoin can solid above the lines, we can expect sideway with resist in 110k
Bitcoin Price Looking bullish strength#Bitcoin Technical Outlook – BTCUSDT
Bitcoin recently tested the key support zone at 102,500 and is bouncing back, indicating bullish strength amid ongoing Middle East tensions. The geopolitical uncertainty continues to reinforce BTC’s safe-haven appeal, helping the price stabilize above critical levels.
🔹 Key Support: 102,500
🔹 Immediate Resistance: 109,000
🔹 Next Resistance: 110,000
⚠️ Note: Market remains volatile due to geopolitical developments — risk management is essential.
you may find more details in the chart Ps Support with like and comments for better analysis share with you Thanks for understanding.

Current BTC Trend Analysis and Trading RecommendationsThe daily candlestick chart of BTC shows a three - day consecutive bearish retracement, having fallen back to the vicinity of the starting point of the previous pinbar rebound and currently remaining in a recent low - level sideways consolidation zone. However, the 4 - hour trend is pressured by the middle band of the Bollinger Bands, staying within a downward channel and forming a rebound - retracement wave pattern.
For short - term strategies, anticipate a further retracement first. Long positions should be initiated only after the support level is confirmed valid. This retracement represents a necessary consolidation phase before the bullish trend continues, and the current adjustment range does not pose a substantial threat of trend reversal to the overall uptrend. With the core upward trend intact and the direction remaining clear, BTC is expected to resume its upward momentum after a brief consolidation. The operational approach remains to go long on retracements.
BTCUSD
buy@103500-104000
tp:105500-106500
Investment itself is not the source of risk; it is only when investment behavior escapes rational control that risks lie in wait. In the trading process, always bear in mind that restraining impulsiveness is the primary criterion for success. I share trading signals daily, and all signals have been accurate without error for a full month. Regardless of your past profits or losses, with my assistance, you have the hope to achieve a breakthrough in your investment.
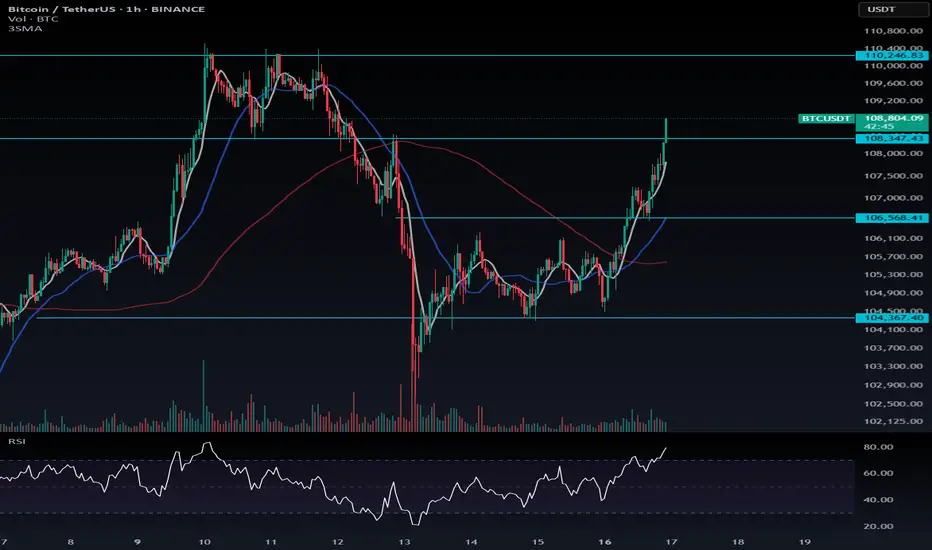
BTC Accumulated Over 104K💎 BTC PLAN UPDATE (June 16)
NOTABLE BITCOIN (BTC) NEWS:
At least four publicly listed U.S. companies announced plans on Tuesday to significantly increase their cryptocurrency exposure, committing a combined $844 million in new investments. The move reflects a growing corporate appetite for Bitcoin and other digital assets as alternative stores of value and growth opportunities.
The most substantial commitment came from Hong Kong-based ready-meal provider DDC Enterprise Ltd, which disclosed three separate purchase agreements totaling $528 million. The entire sum is earmarked for expanding the company’s Bitcoin reserves.
Technical analysis angle
DAY DAY: Bitcoin is united when uncertainty takes root
Bitcoin price moves widely at about $ 106,300 at the time of writing the article after failing to reach the $ 107,000 resistance threshold on Monday. Its technical structure, as observed from the daily chart below, shows the trend of price increases.
The dynamic convergence indicator (MACD) has maintained the signal to be confirmed on Thursday when the blue MACD line cut under the red signal line. This signal often encourages traders to consider reducing exposure to Bitcoin, thereby creating a dynamic motivation.
The relative power index (RSI) highlights the discount trend when it is sloping, approaching the middle line 50. The movement is below this important neutral level that can catalyze the downtrend, bringing the average exponent dynamic line of 50 days (EMA) at $ 103,064, the 100 -day EMA road at $ 98,783 and the 200 -day EMA road at $ 93,083 to become expected targets.
==> Comments for trend reference. Wishing investors successfully trading
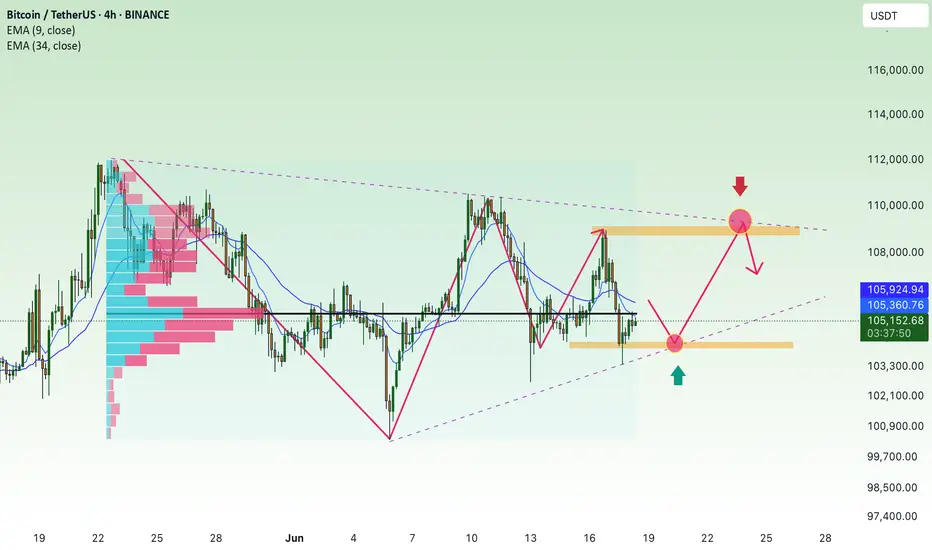
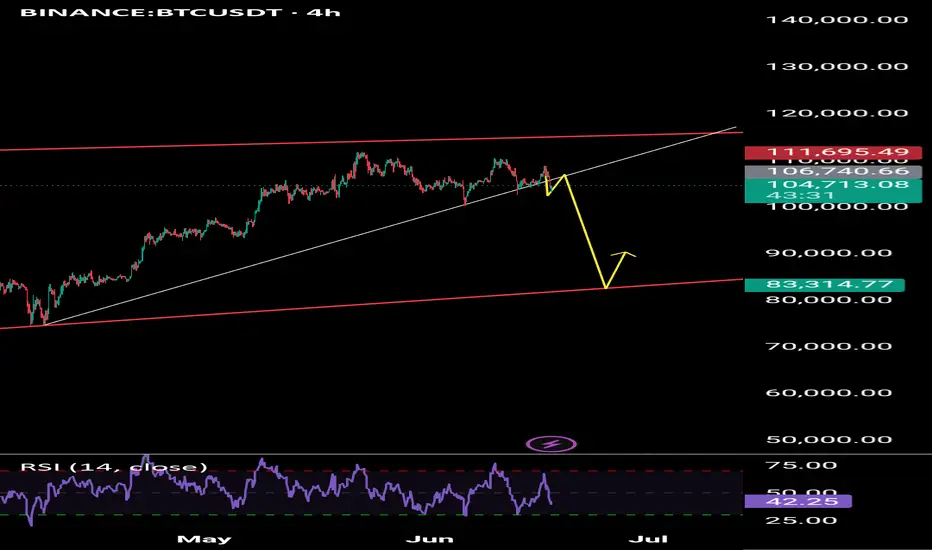
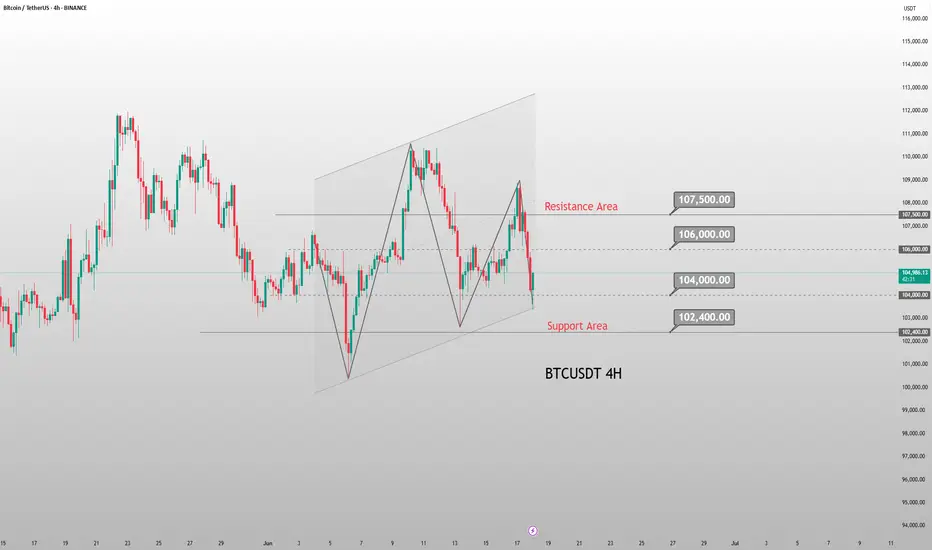
BTC/USDT in Consolidation: How To Trade the RangeBitcoin (BTC/USDT) is currently in a clear consolidation phase on the 4-hour chart 📊. Price action is trapped within a well-defined range, and for now, no dominant trend has emerged — we’re simply trading sideways between key support and resistance levels 🔁
In the video, we dive into how to tactically approach this kind of environment by trading the lower time frame trend shifts within the range — focusing on lower timeframe moves from range highs to range lows, and vice versa ⬆️⬇️
We also reference the broader macro picture — looking at the NASDAQ (US100) and the Magnificent 7 (MAGS) for potential clues about Bitcoin’s next directional move 🧠💡. Risk-on or risk-off sentiment in these key tech equities often correlates with Bitcoin’s momentum, making them critical confluence factors for BTC traders.
For now, the strategy is to remain range-conscious and reactive, rather than predictive. Until we get a confirmed breakout or breakdown, patience and precision remain key 🎯

At the moment, Bitcoin is hovering around the newly created FVG.🚨 BITCOIN MARKET UPDATE 🚨
Bitcoin has recently broken below the previous BPR (Balanced Price Range), signaling a significant shift in market structure. Along with this breakdown, a Bearish Fair Value Gap (FVG) has also formed — a strong indication that the market may be preparing for a further move to the downside.
📉 What This Means:
The break below BPR, combined with the emergence of a bearish FVG, suggests that bearish momentum is currently in play. This is often a sign that the market intends to seek out lower liquidity zones, potentially targeting new lower lows.
🔎 Current Setup:
At the moment, Bitcoin is hovering around the newly created FVG. If price retraces into this zone and gives us a clear bearish confirmation (such as a rejection candle, bearish engulfing, or other MSS confirmation), it could provide a high-probability sell opportunity.
🎯 Target:
The primary target would be liquidity below the most recent lower lows.
⚠️ Risk Management Reminder:
Always wait for proper confirmation before entering a trade. These setups are best traded using MSS (Market Structure Shift) or BPR strategies for higher probability outcomes.
📚 DYOR — Do Your Own Research!
Trading involves risk. Ensure you have a strategy in place and never trade blindly.

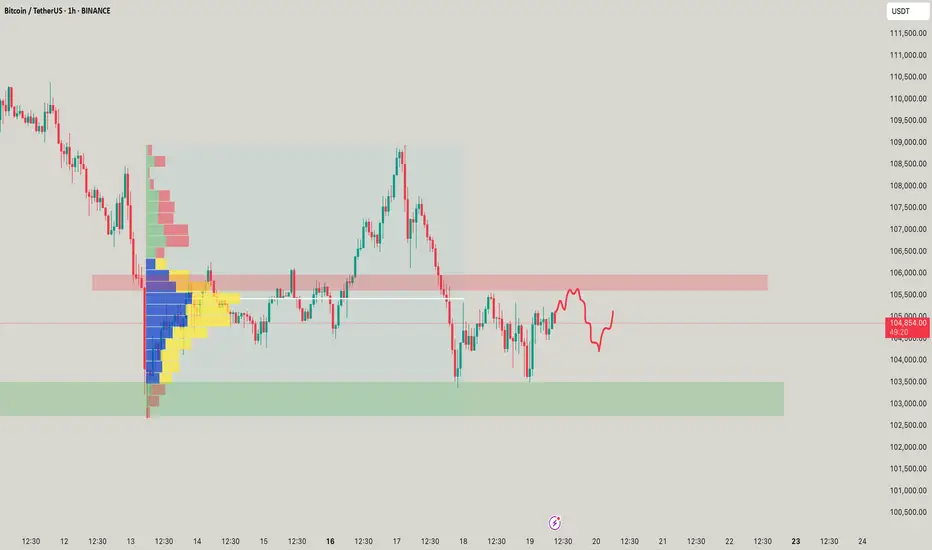
BTCUSDT. Initiative Analysis Market OverviewHey traders and investors!
📍 Context
On the daily and 4H timeframes, the market is in a sideways range (Black lines = range boundaries).
Buyer initiative is active on 4H. The target initiative is 108,952.
However, on the daily timeframe, the seller initiative is in control, and a seller zone has formed. The seller zone is the red rectangle on the chart.
📊 Key actions
The buyer attempted to break out of the range on the daily timeframe twice, but both times the seller pushed the price back inside.
The price is currently interacting with the seller zone. Watching for the reaction.
🎯 Trade Idea
🔸 Long positions — with caution. Only valid if the price holds above 105,336, aiming for the target at 108,952.
🔸 Until that happens, the priority is on further downside, in line with the current seller initiative on the daily. It’s reasonable to look for short setups if the seller defends 105,336.
This analysis is based on the Initiative Analysis concept (IA).
Wishing you profitable trades!

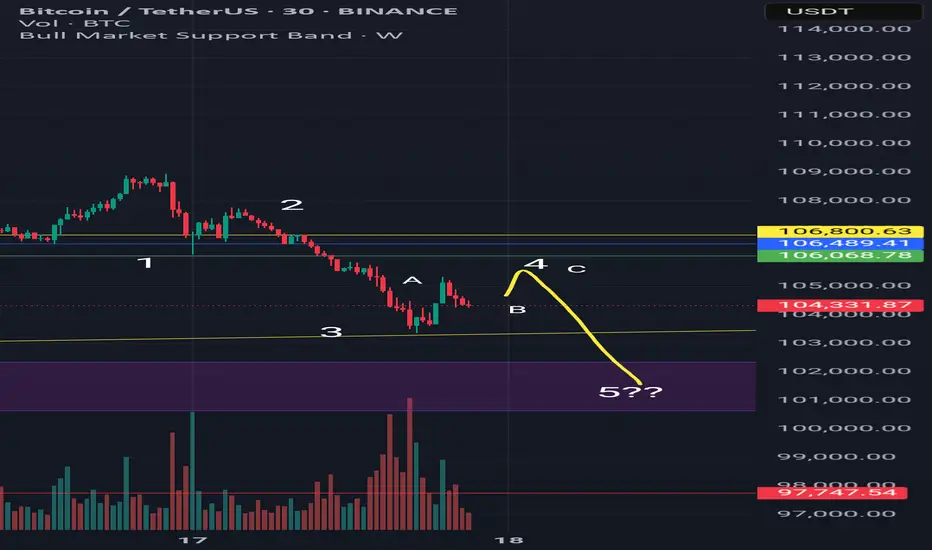
Most likely scenario for BitcoinI am tired of all analysts just saying that we are going down to 70k or up to 200k in one go.
So let me add a small informative chart for all people new or lost.
Don't get me wrong, i am bullish mid and long term but right now we are in the middle of a strong correction but shouln't last long.
We could have been super bullish above 106k but the price broke down with strength.
Now we see a super clear 5 wave movement down.
Currently we are in the 4 wave, trying to bounce back to the 106k area and doing a classic 4 wave ABC correction.
The bounce lacks volume so the most likely scenario is completing the 5 wave. We might get to the 101k area and ONLY THEN we can see what could happen.
If you are a futures trader, do it with caution and small leverage.
If you are a long term investor, these are perfect areas to buy more.
Good day to everyone.
BTC for long *The content on this analysis is subject to change at any time without notice, and is provided for the sole purpose of assisting traders to make independent investment decisions.
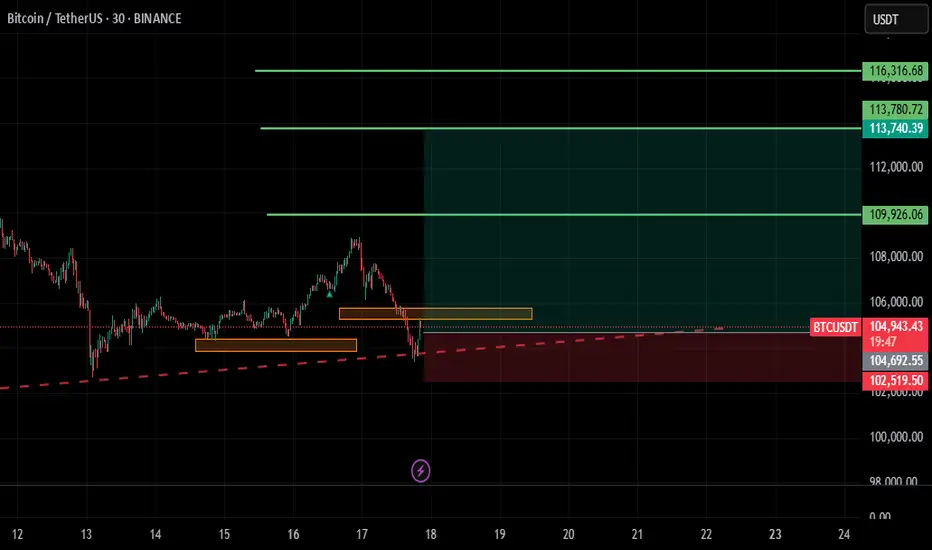
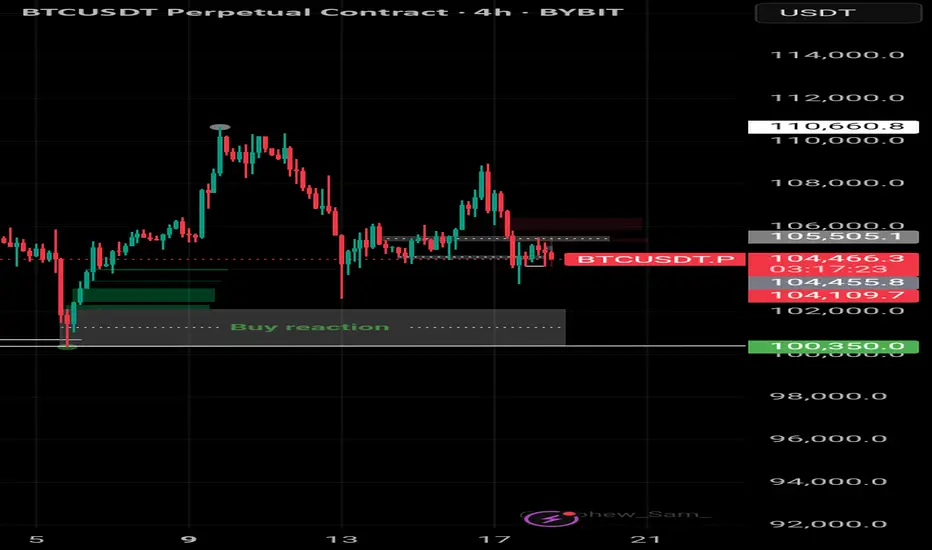
BTC long if it reclaims or holds ### 🔍 Breakdown of Chart:
* Timeframe: 15m BTCUSDT (Bybit)
* Current Trend: Sharp downtrend from the recent highs
* Zone Marked in Blue: Bullish Order Block / Demand Zone
* Yellow Path: Anticipated reclaim and reversal scenario
* White Curve: Possible double bottom (liquidity sweep)
---
### ✅ Why Long Plan Makes Sense:
1. Demand Zone (Blue Block):
This zone has previously caused a strong bullish reaction. It's likely institutional demand may rest here again.
2. Liquidity Grab Below:
Price might sweep the recent low (creating a trap for shorts) before reclaiming. That’s your “double bottom” logic.
3. Reclaim = Confirmation:
Waiting for a reclaim above the zone before longing shows patience and discipline — a smart move to avoid catching a falling knife.
4. Clear Invalidations:
If price fails to reclaim and breaks below the blue zone with momentum, your setup is invalidated — perfect risk control.
---
### ⚠️ Caution:
* If the red bearish OB above (around 104.6–104.8K) is respected, you might face rejection there. Consider partial profits before that area.
* Use confirmation (like a bullish engulfing, BOS, or FVG fill) after reclaim.
* If breaks blue zone then we might enter short