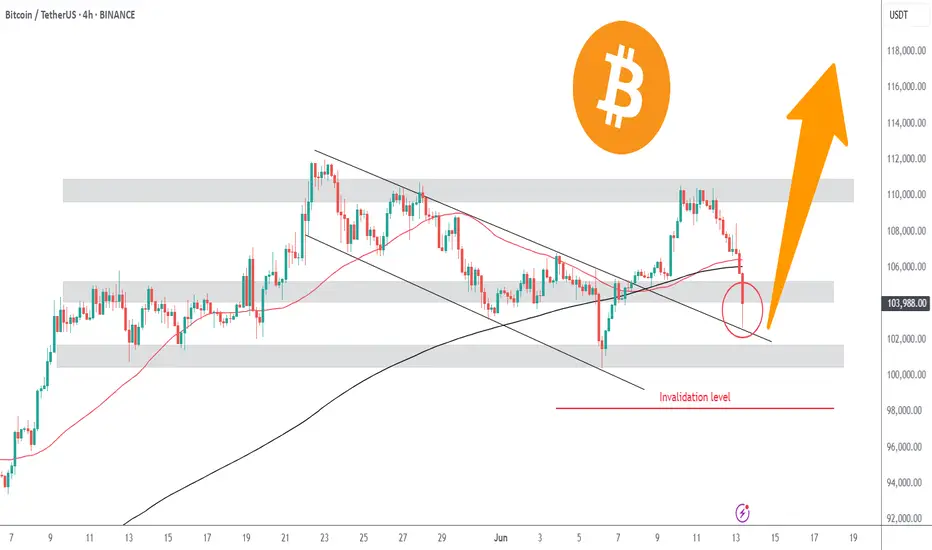
Bitcoin Retests Broken Channel | Bounce to $110k?Bitcoin is currently retesting the broken downward channel. This selloff was a market shock reaction due to Israel's airstrikes on Iran. Price found support around $103k, at the daily timeframe 50SMA. The daily 50SMA also served as support in the previous drop to $100k last week.
In the chart's red circle is likely where many long leveraged positions had their stop losses or liquidation levels. We can safely assume this event was a liquidity hunt as Bitcoin remains strong above $100k. A healthy pullback to retest.
Historically, we have seen similar market shock selloffs like this. One example is the 1st of October 2024 Iran strikes on Israel. Bitcoin crashed 5% from $63k to $60k. What followed after was a recovery to over $100k, never seeing $60k again.
Will Bitcoin recover?
We still have multiple bullish developments. Institutions are becoming increasingly interested in Bitcoin, the US Bitcoin reserve, SEC x Ripple case settlement, SOL ETF approval, Fed rate cuts, among others.
Provided that the conflict does not escalate, once the market panic reaction is over, we can expect a healthy bullish continuation, as long as Bitcoin remains above $100k.
We also have a massive pool of short liquidity above $111k. Once we break above this level it will be a short-squeeze to $120k.
BTCUSDT.3L trade ideas
Excellent Trade yesterday! Today's PlayHere are the scalp plays I am watching today. A few continuation plays in to demand and a reaction off supply. Lets see what the NY brings.
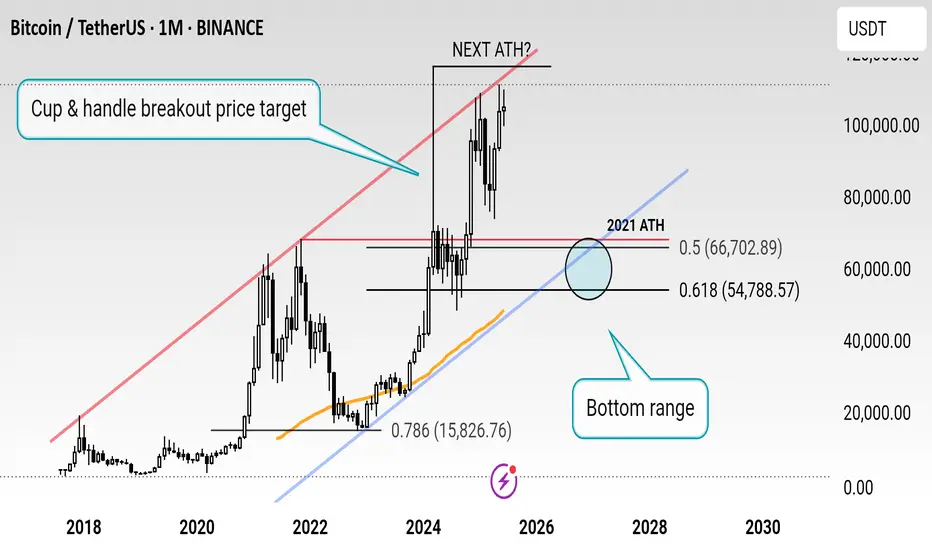
$BTCUSD Predictions support line
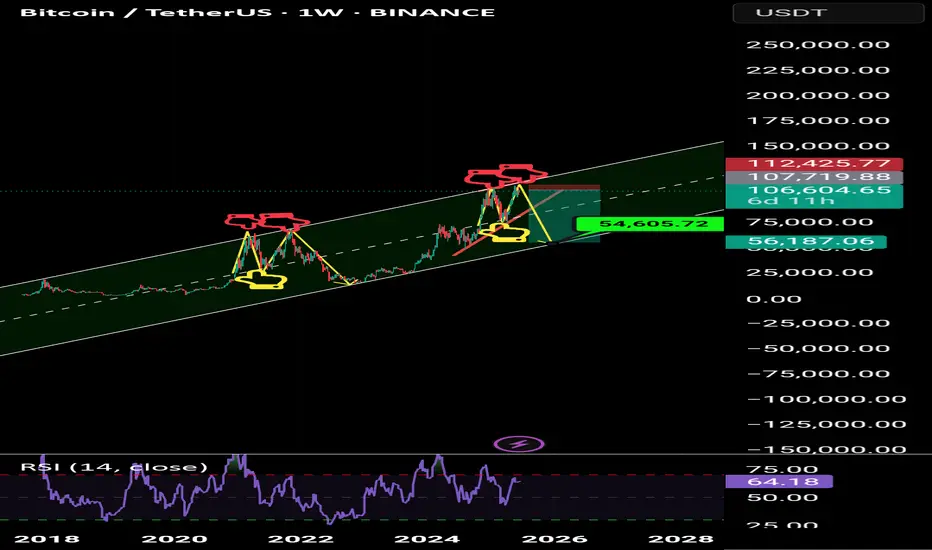
Bitcoin traders, get ready for an epic ride! This chart shows BTC still has to hit the price target from the Cup & Handle breakout, pushing it toward a major channel resistance! Once it peaks, a bear market could kick in, driving prices down to the support line. Buckle up for the volatility ahead!
Bitcoin sell short go 50k Bitcoin is ready to correct towards $56,000 after the double-top pattern on the weekly time frame.
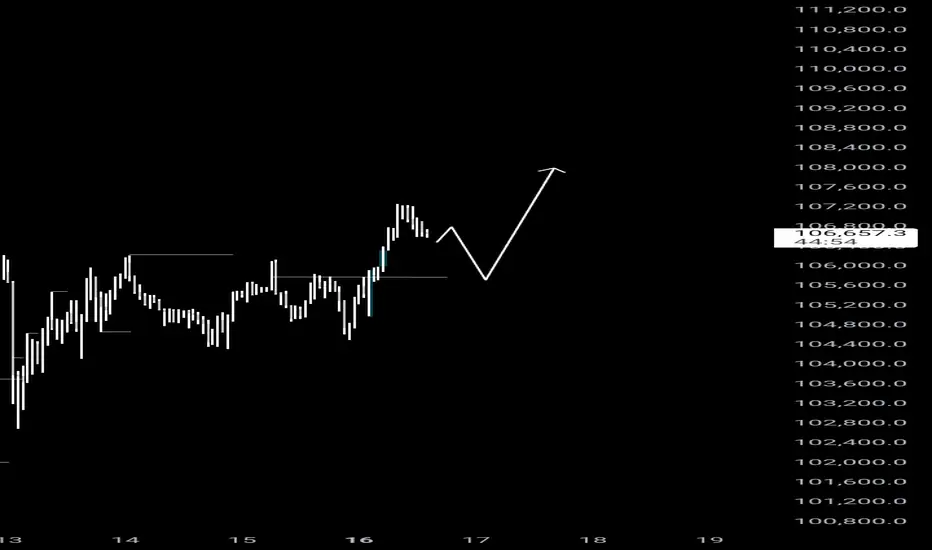
Btcusd buy ideaBTCUSD experienced a sell-off, filling the gap, but buyers stepped in, mitigating the decline. If buyers hold and consolidate above $105,500, it could pave the way for a potential rally towards $108,000-$110,000. What's your outlook, traders
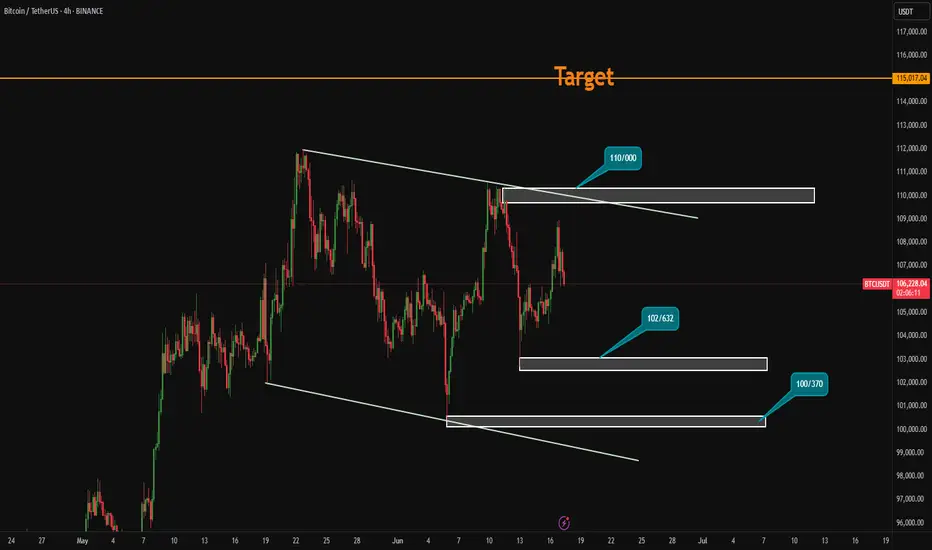
BTC/USDTHello friends, I hope you are doing well. This analysis came to my mind for Bitcoin. On the 4-hour time frame, if Bitcoin crosses the areas I specified, it will move towards its targets. It could be bullish because gold and oil were bearish yesterday. What do you think, friend?
BTC/USDT – Rising Wedge Breakdown Looms Near $110K
Idea Summary:
Bitcoin is compressing in a rising wedge on 1D/4H timeframes, approaching resistance around $ 110K–$ 112K. We’re seeing bearish divergence on RSI and MACD, declining volume, and sentiment cooling—signaling a potential breakdown.
Key Confluences:
• Rising wedge pattern (bearish reversal during uptrend) with converging trendlines and falling volume
• RSI divergence: price rising, RSI flattening/declining
• Volume behavior: weaker rallies, distribution-style setup near highs
• Sentiment neutralizing: Fear & Greed Index slipped from ~74 to ~55–60
• Macro backdrop: U.S. inflation cooling, Fed pause in rate hikes → but upcoming FOMC brings volatility risk
Conclusion:
BTC is near a wedge apex with short-term bearish structure forming. A breakdown could test $ 90K–$ 75K, whereas a break above $ 112K invalidates the setup. 📉
Trigger zones:
• Breakdown < $ 105K → triggers short
• Breakout > $ 112K → stop out & pause
💬 Thoughts? Breakdown or breakout next?
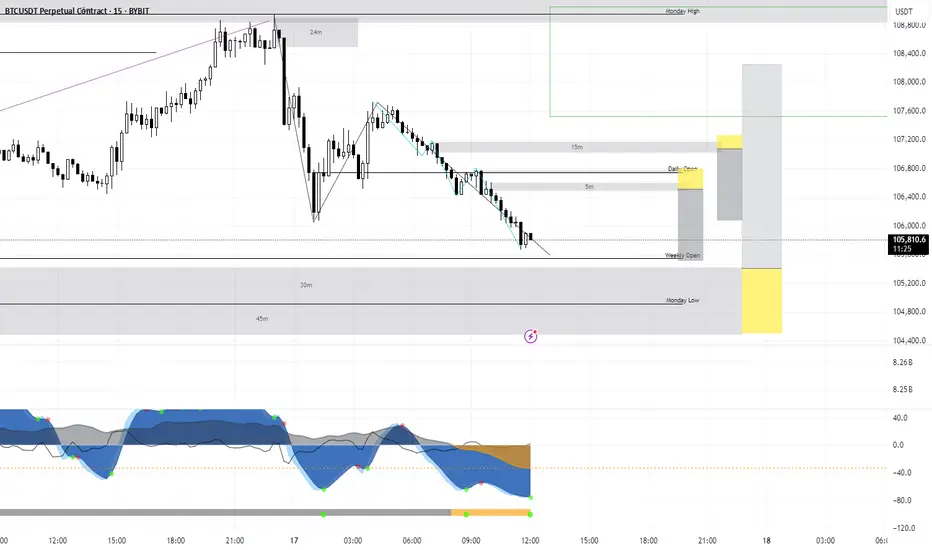
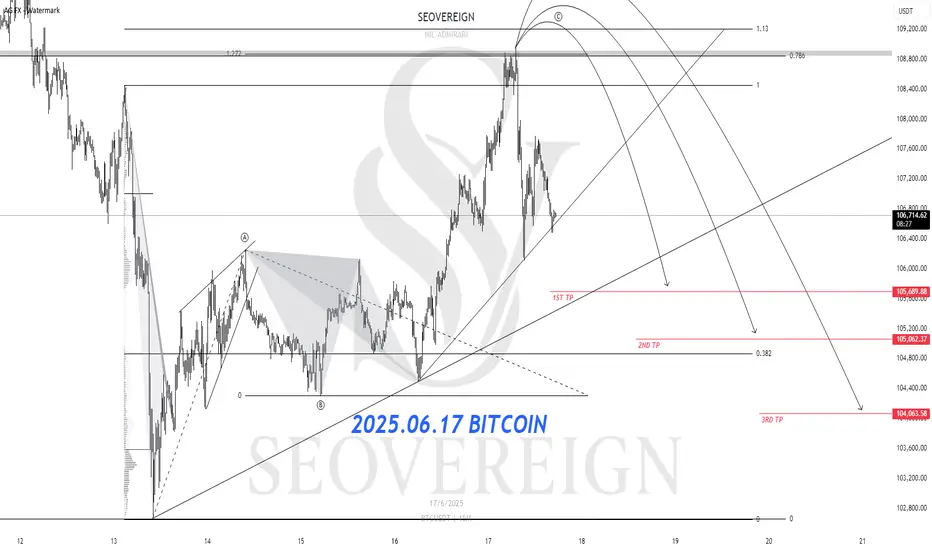
[SeoVereign] Bitcoin Bearish Outlook – June 17, 2025We are the SeoVereign Trading Team.
With sharp insight and precise analysis, we regularly share trading ideas on Bitcoin and other major assets—always guided by structure, sentiment, and momentum.
🔔 Follow us to never miss a market update.
🚀 Boosts provide strong motivation and drive to the SeoVereign team.
--------------------------------------------------------------------------------------------------------
Hello,
This is SeoVereign, approaching technical analysis not as a result but as a prediction, with a realistic perspective.
I am presenting a bearish view on Bitcoin as of June 17, 2025.
First, based on the fact that a downtrend appeared near the 0.786 level of the overall Fibonacci retracement, I believe strong downward pressure is forming, and thus I am outlining this bearish perspective.
This 0.786 level corresponds to around the 109,000 price range. On the chart, the 109,000–110,600 range is a very strong supply zone where support and resistance have repeatedly been confirmed.
Next, from a wave counting perspective, the 1.272 trend-based Fibonacci extension lies in a similar area as the 0.786 retracement level, which further reinforces my conviction in this view.
After successfully predicting the downward movement from the 11th, I have been continuously counting the recent upward wave, and the wave structure on the chart appears to align naturally, as I see it.
In addition, from a harmonic perspective, the Alt Bat pattern is functioning effectively, and since the movement has been captured within the pre-set X–1.13 range, the confirmation of this pattern can also be considered successful.
The first target is currently set around the 105,700 level.
I will continue to monitor the market closely, and once this idea progresses to a certain point, I will share more specific evidence and the thought process behind the bearish entry through an additional update.
Thank you.
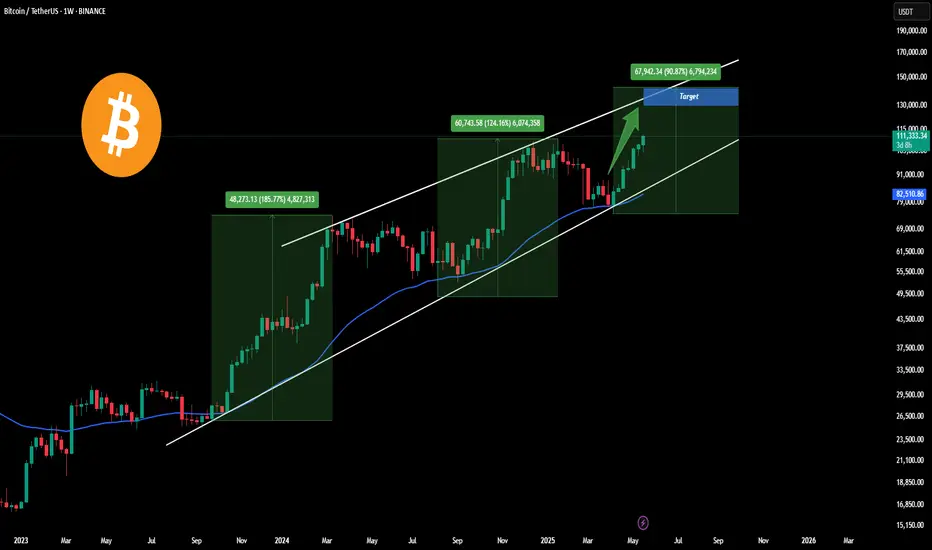
BITCOIN: As simple as that!Hello Traders,
First of all, a big thank you to all the members of our community for being part of this journey. With Bitcoin reaching a new all-time high, we are about to witness even more bullish momentum unfold. 🚀
A special shoutout to @TradingView for providing an incredible platform that empowers traders like us to showcase our technical skills, build our identity, and grow from nothing to something.
Now, let’s head to the update:
Since September 2023, BTC has performed exceptionally well. We witnessed a strong rally lasting until March 2024 (around 180 days), followed by a period of consolidation. BTC then made another leg up, hitting the historic $100K mark. After another consolidation phase, we are now seeing the start of a new bullish rally. 📈
Based on current analysis, this rally is expected to reach between $130K and $150K, with the target likely being achieved by early Q3.
So, sit tight, stay focused, and enjoy the ride! 🥂
Best regards,
Dexter
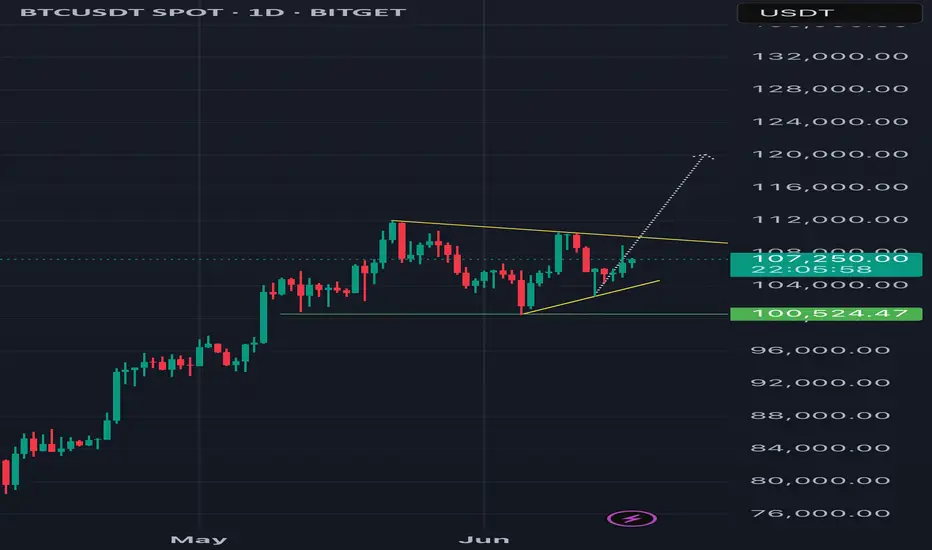
Bitcoin 100K Support Intact, The Bulls Win!Lately we've seen many cries about volume. Where is the volume? There is no volume! Etc. I tend to agree. My excuse in favor of a bullish Bitcoin was to say that low volume as prices moved higher worked as a continuation signal, things change.
We are now looking at BTCUSDT on the Daily timeframe and what I can notice is trading volume being relatively high. The days with high bull (green-buy) volume, are sometimes two to three times higher than the days with bearish (red) volume. This signal seals the deals. The bulls win.
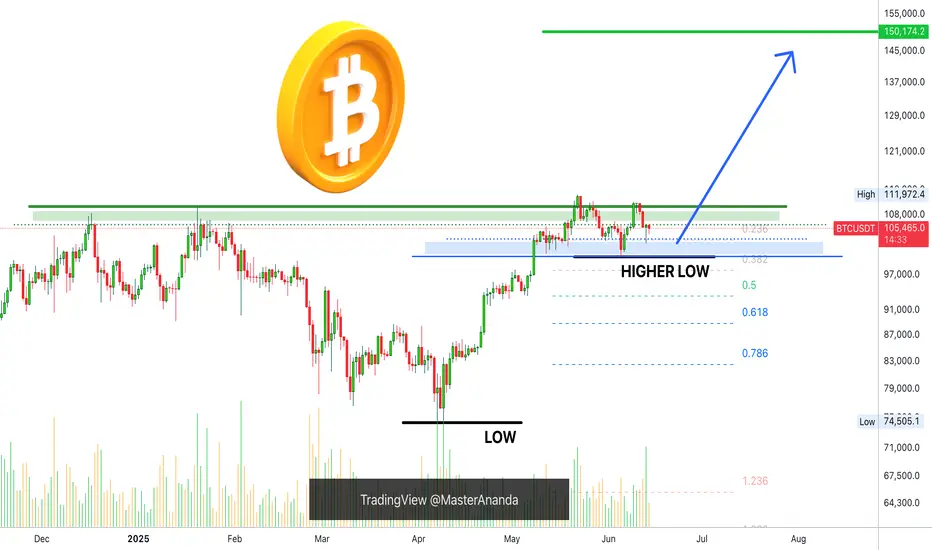
This is a chart drawing that I used in the past. We have the low 7-April low and a higher low 5-June. Very strong bullish action for two months straight; very little retrace, weak bearish action for several weeks, the bulls win again.
The consolidation zone, the accumulation range, is defined here with blue and green, we know the price to be $100,000 and $110,000, Bitcoin trades at the exact middle, above $105,000. Giving the bulls another win.
Yesterday the action produced a higher low compared to 5-June. Even with very bad geopolitical conditions, a surprise war, Bitcoin remains strong. If not even war can break 100K as support, this simply means that Bitcoin isn't going any lower, Bitcoin is going up.
The most revealing part is the fact that Bitcoin didn't even reach 100K. Not in 5-June, not yesterday. 5-June the low was hit at 100,386. Yesterday, the low was 102,656.
There is lots of demand, supply is limited.
People are buying the dip. Whales are buying, institutions are buying; the world wants Bitcoin. Price action says Bitcoin is going up.
We can extract supporting signals from the Altcoins, Ethereum, XRP and Dogecoin are good examples, all the big projects are strong now when we consider the fact they are trading above MA200 daily and weekly, and this confirms a bullish bias with long-term growth.
$150,000 is not the top, Bitcoin is likely to go higher by the end of the next bullish wave. We can consider prices such as $180,000 and $200,000. This is because nobody is selling. Since people are not willing to sell, prices are sure to increase. Many altcoins are now extremely bullish, small and big.
All market conditions are fully aligned, it is only a matter of time.
Patience is key. Prices will rise.
Namaste.
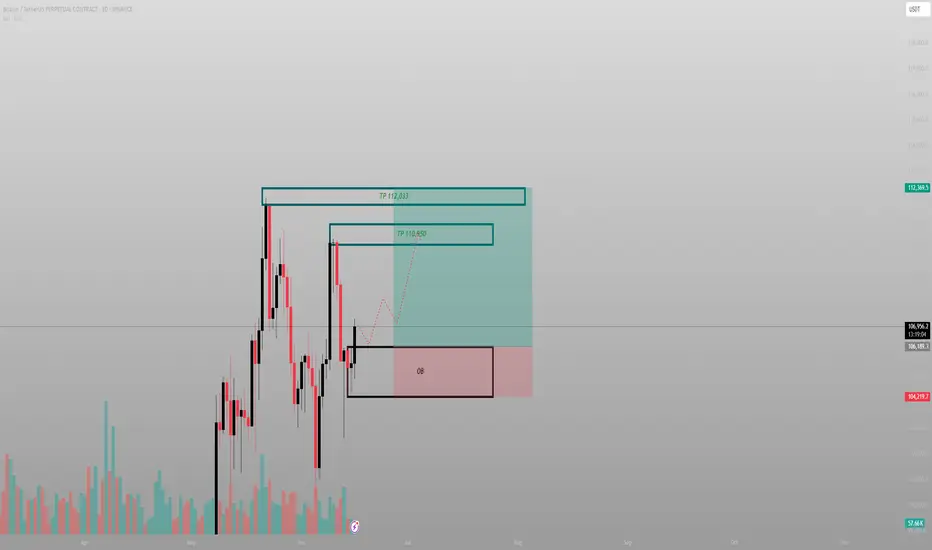
This isn’t a breakout. It’s a return to senderPrice didn’t rally from randomness — it tapped directly into a daily OB, respected it, and is now marching toward unfulfilled inefficiency above. What looks like recovery is really just Smart Money closing the loop.
The logic:
Price swept sell-side liquidity into a deep daily OB and rebounded sharply — not passively. The response wasn’t a bounce. It was intention.
Above? Two clean destinations:
TP1: 110,950 — inefficiency fill and EQ of prior supply
TP2: 112,033 — full delivery into unmitigated structure
No overlapping zones, no chaos — just precise levels that haven’t yet been claimed.
Execution:
Entry: 104,200–105,000 range
SL: Below 103,800
TP1: 110,950
TP2: 112,033
The risk is defined. The reward is prewritten.
Final thought:
“This move wasn’t built to excite you. It was built to deliver.”
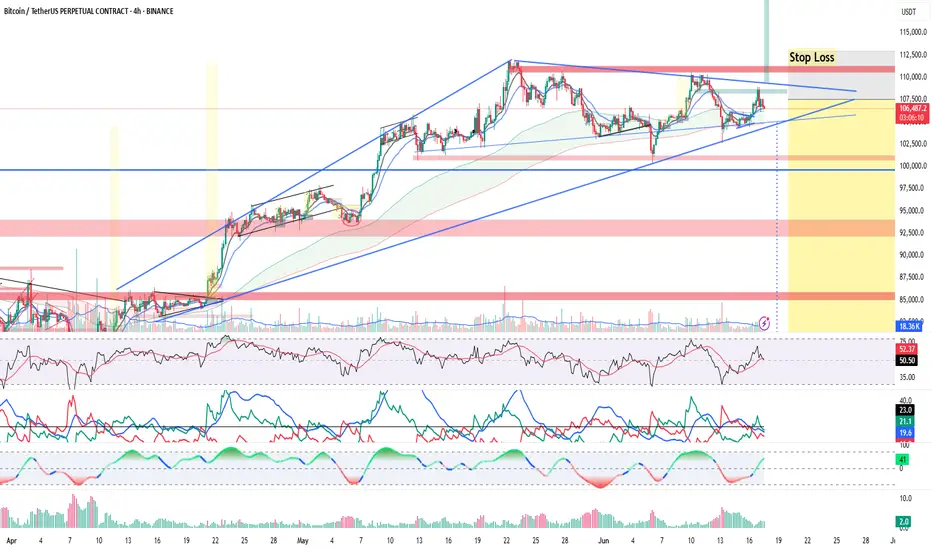
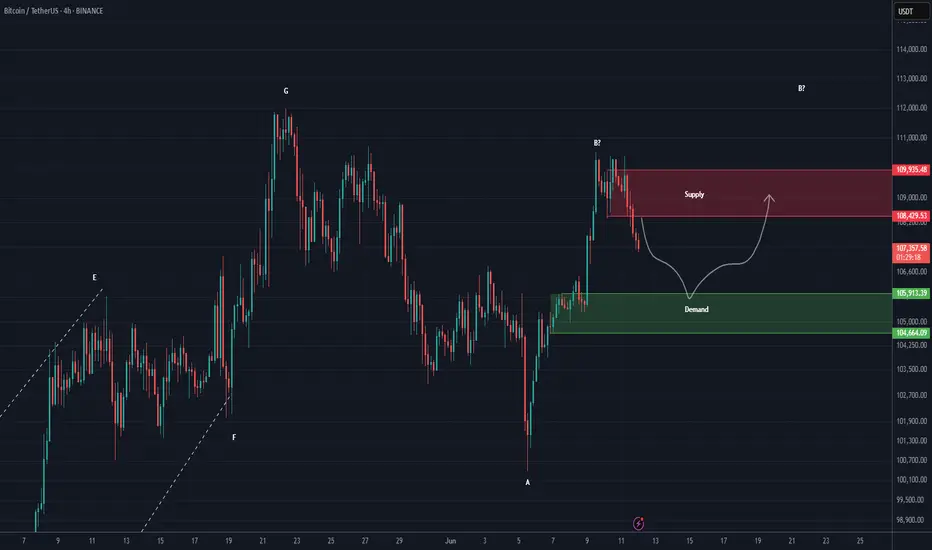
BTC ANALYSIS (4H)Last week, Bitcoin made a sharp bullish move upward, aiming for retail liquidity, which made the forecast path more difficult.
The green zone is a support area where Bitcoin might react.
To collect the ATH liquidity, Bitcoin needs to break through the red zone.
Let’s see what happens | when the market direction isn’t clear, there’s no need to take unnecessary risks.
For risk management, please don't forget stop loss and capital management
Comment if you have any questions
Thank You
Bitcoin Strategic Interval, CME Dislocation and Macro Friction.⊢
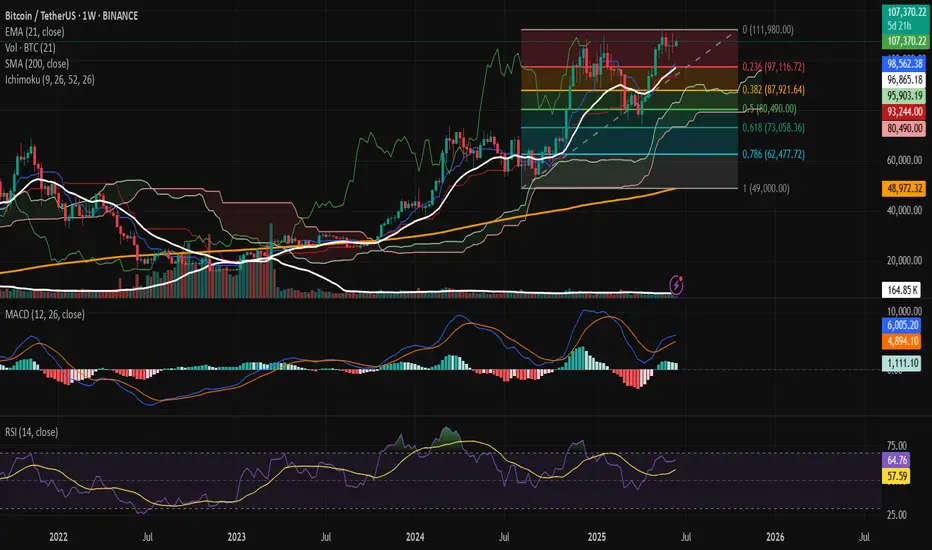
𝟙⟠ - BTC/USDT - Binance - (CHART: 1W) - (June 17, 2025).
⟐ Analysis Price: $106,851.31.
⊢
I. ⨀ Temporal Axis – Strategic Interval - (1W):
▦ EMA21 – ($96,818.00):
∴ The current candle closes +10.3% above the EMA21, maintaining bullish dominance over the mid-term dynamic average;
∴ This is the 17th consecutive weekly candle closing above the EMA21 since its reclaim in February 2025, forming a structurally intact uptrend;
∴ No violation or wick-close below the EMA21 has occurred since April, and the distance from price to EMA21 remains within a standard deviation of mid-trend movement.
✴ Conclusion: The trend is active and preserved. EMA21 acts as dynamic support and bullish pressure zone. A reversion would only be expected if weekly closes return below $98K with volume confirmation.
⊢
▦ SMA200 – ($48,969.73):
∴ The 200-week simple moving average remains untouched since early 2023, never tested during the current cycle;
∴ The slope of the SMA200 is positive and gradually increasing, indicating a long-term structural trend recovery;
∴ Price stands +118% above the SMA200, a level historically associated with mid-cycle rallies or overheated continuation phases.
✴ Conclusion: The SMA200 confirms long-term bullish structure. Its current distance from price makes it irrelevant for immediate action but critical as the absolute invalidation level of the macro trend.
⊢
▦ Ichimoku – Kumo | Tenkan | Kijun:
∴ Price is above the Kumo cloud, with Span A ($107,172.16) and Span B ($98,562.38) creating a bullish tunnel of support;
∴ The Kijun-sen rests at $95,903.19, slightly below EMA21, and aligns with the last strong horizontal range;
∴ Chikou Span is free from historical candles, confirming trend continuity under Ichimoku principles.
✴ Conclusion: All Ichimoku components are aligned bullish. Pullbacks to the Kijun around $96K would be healthy within a macro-uptrend, and only sub-cloud closes would question this formation.
⊢
▦ Fibonacci - (Swing Low $49,000 – High $111,980):
∴ Bitcoin remains between the (0.236 Fibo - $97,116.72) and local top at $111,980, showing respect for fib-based resistance;
∴ The (0.5 Fibo - $80,490.00) has not been retested since March, confirming the range compression toward upper quadrants;
∴ Weekly price is consolidating under fib extension with decreasing body size, suggesting strength with pause.
✴ Conclusion: The Fibonacci structure confirms bullish extension phase. If $97K breaks, retracement to (0.382 Fibo - $87,921.64) is expected. Otherwise, the breakout above $112K enters full projection territory.
⊢
▦ MACD – (Values: 1,077.98 | 5,963.81 | 4,885.82):
∴ MACD line remains above signal line for the third consecutive week, recovering from a prior bearish cross in April;
∴ The histogram has printed higher bars for four weeks, but the slope of growth is decelerating;
∴ Positive cross occurred just below the zero-line, which often results in delayed reactions or failures unless reinforced by volume.
✴ Conclusion: MACD signals a weak but persistent momentum recovery. Reaffirmation depends on histogram expansion above 1,500+ and signal spread widening.
⊢
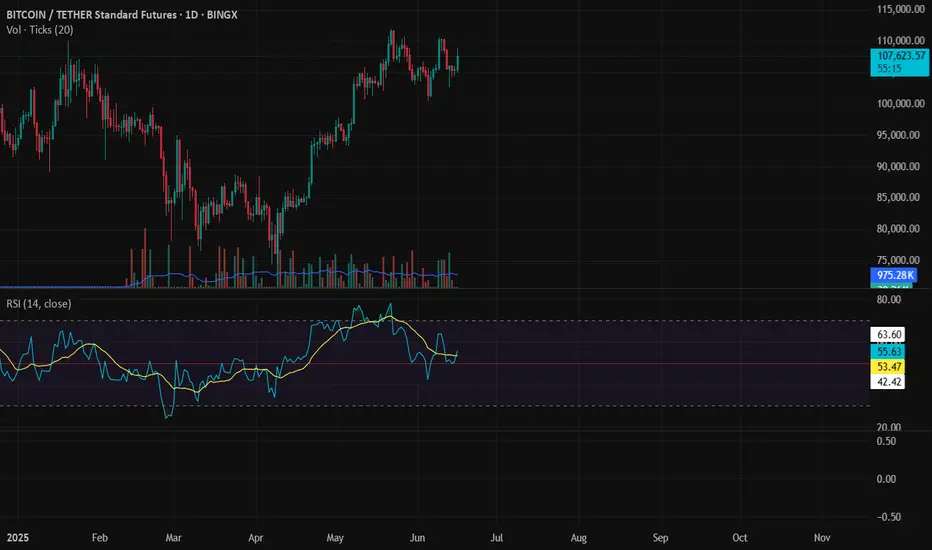
▦ RSI – (Close: 64.37 | MA: 57.56):
∴ The RSI is in the bullish upper quadrant, but without overbought extension, suggesting active buying without euphoria;
∴ The RSI has been above its moving average since mid-May, maintaining a healthy angle;
∴ Momentum is not diverging from price yet, but is approaching the 70 zone, historically a point of hesitation.
✴ Conclusion: RSI confirms controlled strength. Further advance without consolidation may trigger premature profit-taking. Above 70, caution increases without being bearish.
⊢
▦ Volume - (16.97K BTC):
∴ Weekly volume is slightly above the 20-week average, marking a minor recovery in participation;
∴ There is no volume spike to validate a breakout, which is common in compressive ranges near resistance;
∴ Volume has been declining since mid-May, forming a local divergence with price highs.
✴ Conclusion: Volume profile supports current levels but does not confirm breakout potential. A rejection with strong volume will mark local exhaustion.
⊢
II. ∆ CME Technical Dislocation – BTC1! Futures:
▦ CME GAP – BTC1! – ($107,445.00):
∴ The CME Futures opened this week at $105,060.00 and closed the previous session at $107,445.00;
∴ A clear unfilled gap persists between $105,060.00 and $107,900.00, with price action hovering just above the top edge;
∴ Bitcoin has a consistent historical behavior of returning to close such gaps within a short- to mid-term range.
✴ Conclusion: The unfilled CME gap acts as a gravitational technical force. As long as price remains below $109K without volume expansion, the probability of revisiting the $105K area remains elevated.
⊢
III. ∫ On-Chain Intelligence – (Source: CryptoQuant):
▦ Exchange Inflow Total - (All Exchanges):
∴ Current inflow volume remains below the 1,000 Bitcoin daily threshold, indicating no panic selling or institutional exits;
∴ This inflow level corresponds to accumulation or holding phases, rather than distribution;
∴ The pattern matches a neutral-to-positive mid-cycle environment.
✴ Conclusion: There is no structural on-chain pressure. As long as inflows remain low, risk of capitulation or distribution is minimal.
⊢
▦ Spot Taker CVD - (Cumulative Volume Delta, 90-day) – (All Exchanges):
∴ The 90-day CVD shows continued dominance of taker buys over sells, reflecting ongoing demand strength in spot markets;
∴ However, the curve is flattening, suggesting buyers are meeting resistance or fading interest;
∴ No sharp reversal in the CVD curve is detected — only saturation.
✴ Conclusion: Demand remains dominant, but the pace is decelerating. Without renewed volume, this curve may revert or plateau.
⊢
▦ Exchange Inflow Mean - (MA7) – (All Exchanges):
∴ The 7-day moving average of exchange inflow continues to decline steadily;
∴ This metric often precedes calm phases or pre-breakout plateaus;
∴ Historical patterns show similar inflow behavior before prior volatility expansions.
✴ Conclusion: A period of silence is unfolding. Reduced mean inflow suggests price is awaiting external catalysts for movement.
⊢
▦ Funding Rates – (Binance):
∴ Current funding rates are neutral, with slight positive bias, suggesting balanced long-short sentiment;
∴ No extreme spikes indicate absence of excessive leverage;
∴ This equilibrium typically precedes significant directional moves.
✴ Conclusion: Market is leveled. Funding neutrality reflects hesitation and prepares ground for upcoming directional choice.
⊢
IV. ⚖️ Macro–Geopolitical Axis – (Powell, Middle East & BTC/XAU):
▦ MACRO CONTEXT:
∴ Jerome Powell is scheduled to speak on Wednesday (June 19), with markets anticipating remarks on rate stability or future hikes;
∴ Ongoing tensions in the Middle East (Israel–Iran) elevate risk-off behavior in traditional markets;
∴ Bitcoin has triggered a rare Golden Cross vs. Gold, as noted by U.Today, signaling digital strength over legacy value.
✴ Conclusion: Macro remains the primary external catalyst. Powell’s statement will determine short-term volatility. Until then, Bitcoin floats between its technical support and CME magnetism, with gold dynamics providing long-term bullish backdrop.
⊢
⚜️ 𝟙⟠ Magister Arcanvm – Vox Primordialis!
⚖️ Wisdom begins in silence. Precision unfolds in strategy.
⊢
What is what I think BTC is bearish short to full the FVGs if you look very closely to the chart. Full the gaps and back up for a long
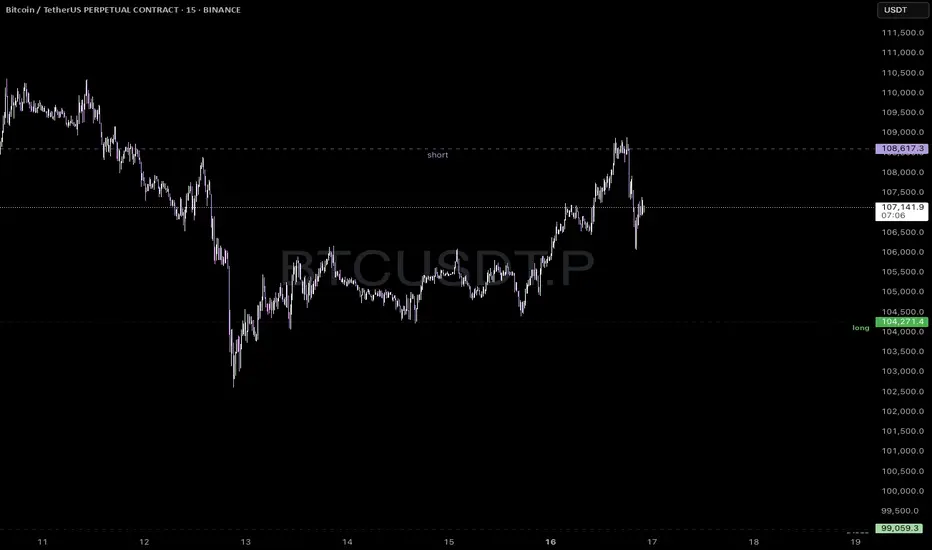
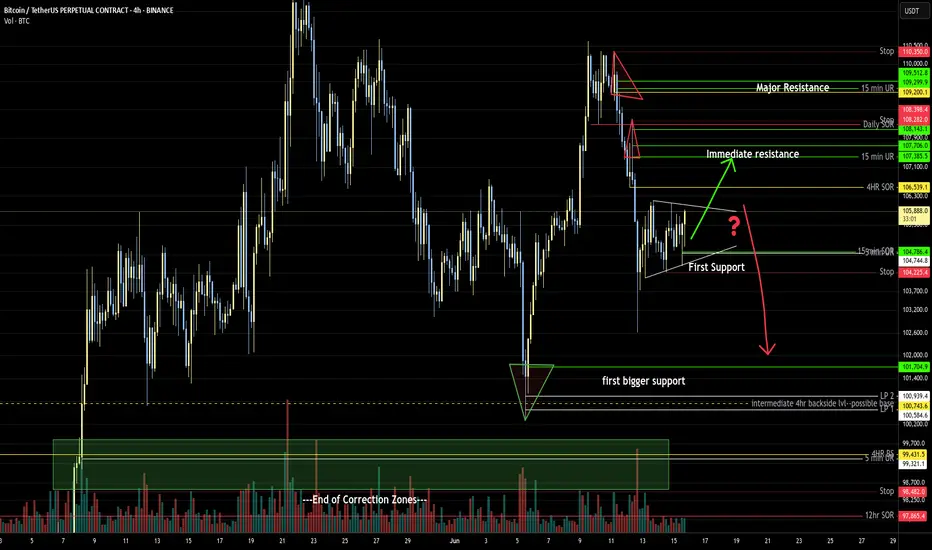
BTCUSD – Range Scalping Zones IdentifiedPrice tapped into a previous short zone near 108.6 and showed rejection. We’re watching for downside follow-through toward the 104.2 to 104.5 range where a potential long opportunity may form.
This chart outlines clean range-based levels for scalping. These zones line up with prior liquidity sweeps and local structure shifts. Scalpers can look to react at these levels depending on how price behaves when we get there.
Ideal for traders on lower timeframes like the 15m, but the concept applies across intraday setups. Always wait for confirmation before entering.
BTC long now ! Bullish divergence confirm ! Bullish divergence in daily timeframe. It might be good for take long position on btc .
#DYOR
BITCOIN BITCOIN weekly candle closed respecting the demand ascending trendline and we have seen buyers return against speculation from elite traders,
the retest of daily roof will be watched for potential rejection at 111-117k, and i will be watching 125k-136k ascending trendline roof should we have a daily break of structure above the current ALTH.
keep eyes on break of the current floor break out on daily, close below will be a a new week rejection ,where we will likely hold sell into 98-97k zone .

sellsell
Iron dome is hacked & Iran is hacking nuc sil.Tela vvv is going to be de stroiiiiied this night
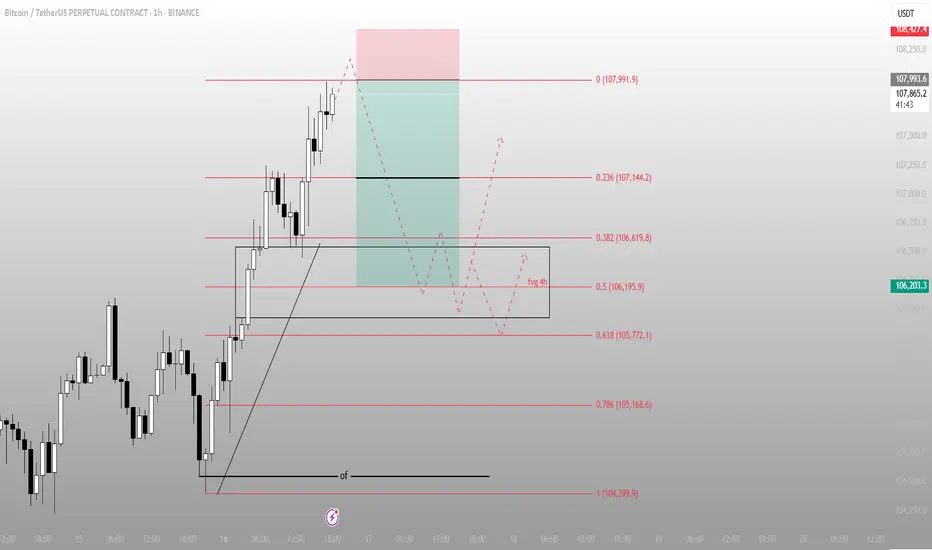
That wasn’t a breakout. That was the stop runBTC swept the high into 107,991 — precision tap of the premium fib. Now the delivery shifts. Price has already done its job: take liquidity, trigger late longs, and set up the real move.
Here’s the execution breakdown:
Price tagged the 0 level of the fib extension — 107,991 — and rejected
A clean 4H FVG sits just below around 106,195.9 (0.5), aligned with 0.382 and 0.618 fib levels (106,619.8 to 105,772.1)
This is the re-entry zone for Smart Money — not the top chasers
Expectations from here:
→ Rebalance into the 106.6–105.7k region
→ If that zone holds and price shifts structure bullish again, we retest 107.1 → 107.9 → break higher
→ If we lose 105.7 cleanly, I’m watching 104,399.9 — the deeper inefficiency magnet
This isn’t about confirmation. It’s about preparation.
More trades like this — clean, controlled, conviction-based — live in the profile description.
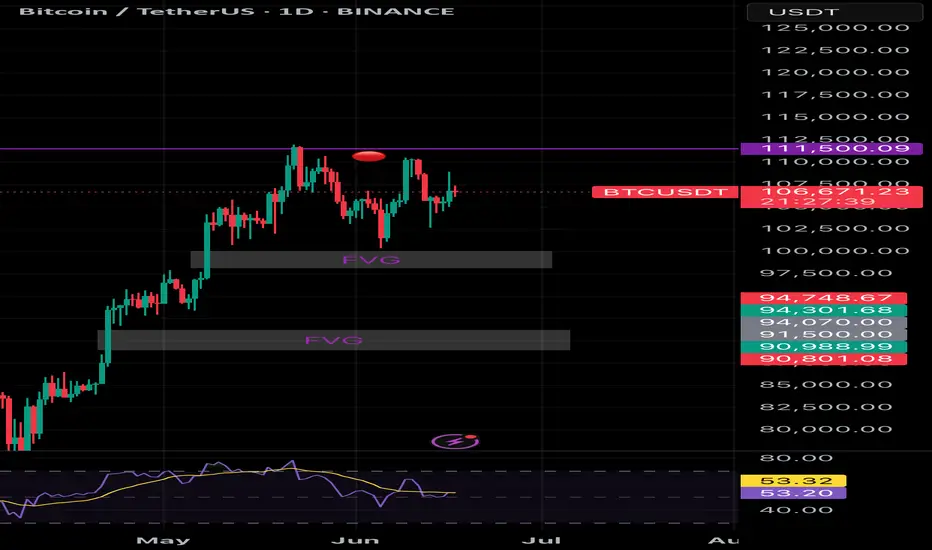
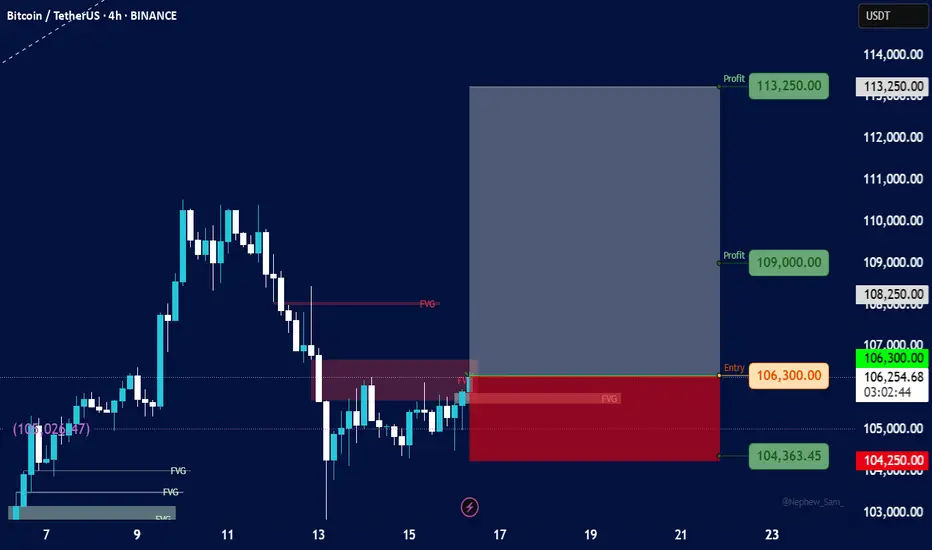
BitcoinEntry Point:
Entry Level: 106,300 USDT
Price is currently slightly below entry (106,254.67), so the trade setup is still valid and could trigger soon.
Stop-Loss (SL):
Stop Level: 104,250 USDT
Defined just below the lower FVG zone, indicating where invalidation would occur.
Take-Profit Targets (TP):
TP1: 109,000 USDT (near minor resistance)
TP2: 113,250 USDT (major target)
The Risk-to-Reward Ratio (RRR) looks favorable — possibly over 3:1, which is strong.
Shift stop to entry after reaching TP1
Bitcoin Market Analysis and Future Trend ForecastThe Bitcoin market has once again become the focus of investors. The price of Bitcoin has shown a significant upward trend, successfully breaking through the key resistance level of $106,000 per coin with an intraday increase of over 2%, demonstrating the strong vitality of the market. This price movement not only reflects the warming of positive sentiment in the cryptocurrency market but also indicates the gradual recovery of investor confidence, which has become the core driving force behind Bitcoin's current rally.
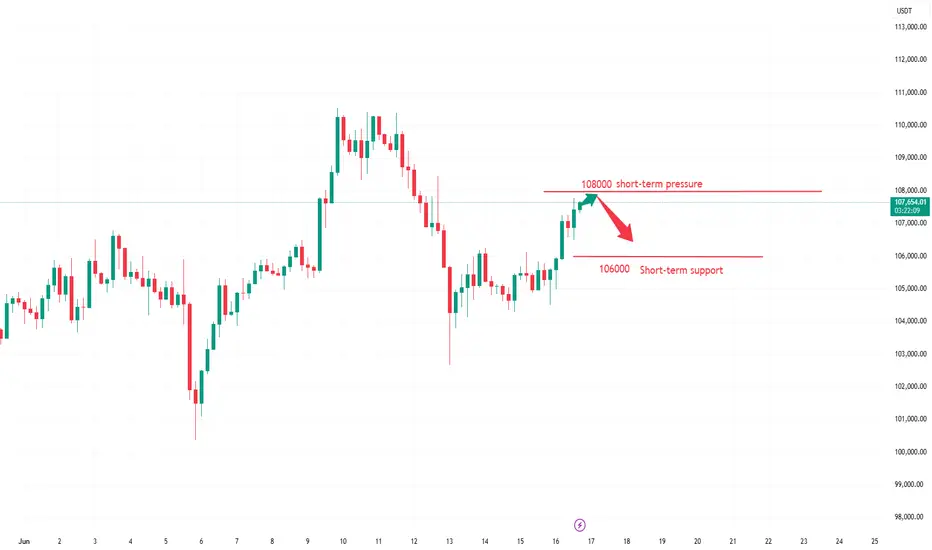
Currently, the Bitcoin price is at a critical juncture. From a daily chart perspective, after reaching an intraday high of $107,265, Bitcoin failed to effectively break through the key resistance level of $108,000 and has since retracted to fluctuate around $106,940. On the 4-hour timeframe, the MACD indicator shows that the histogram remains in positive territory, but the rate of increase has slowed, suggesting a short-term weakening of bullish momentum. Meanwhile, the RSI indicator stands at around 65, approaching the overbought zone, indicating that the market faces short-term correction pressure.
you are currently struggling with losses,or are unsure which of the numerous trading strategies to follow,You have the option to join our VIP program. I will assist you and provide you with accurate trading signals, enabling you to navigate the financial markets with greater confidence and potentially achieve optimal trading results.
Trading Strategy:
sell@107500-108000
TP:106000-106500
Bitcoin Overall: Likely Higher, then lower once moreIndicated are some of the major support and resistance levels I'm looking at. I'd expect price to break out of the current consolidation to the upside before moving lower.
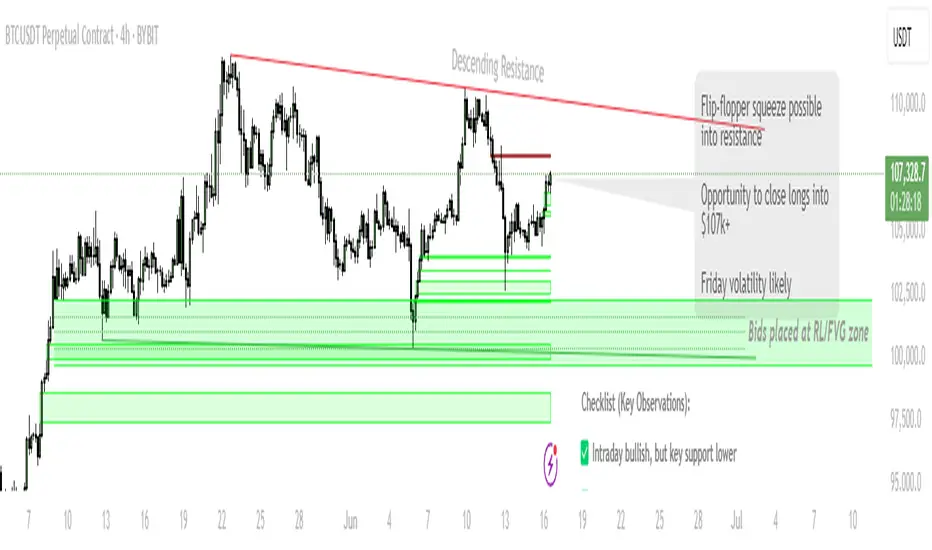
BTC Setup: Watching for a Trap — Bids Below, Flip Above!Scenario 1 (Fakeout & Reversal):
Watch for push to $107,000–$108,000 (potential bull trap)
Close longs on move into resistance zone
Look for reversal signals (SFP, strong rejection) to re-enter lower
Scenario 2 (Sweep and Bounce):
Place bids at/just below $100,272 (1D Support) and within $98,000–$100,000 (FVG)
Target: Move back toward trendline resistance ($107k+)
Stop: Below $97,200
Invalidation:
Structure flips bearish on a clean break/close below $97,200
🔔 Triggers & Confirmations:
Enter longs only on SFP or strong bounce confirmation in FVG zone
Avoid chasing if price is between $102k–$106k (“no-trade chop”)
📝 Order Placement & Management:
🔼 Buy Limits: $100,300 / $99,000 / $98,000 (staggered bids in FVG)
🛡️ Long Stop: $97,200
🎯 Target: $107,000–$109,000 (trendline resistance)
📝 Take profits on spike to $107k+
🚨 Risk Warning:
Friday volatility, news risk
Avoid new longs above $107k — watch for failed breakout/fakeout