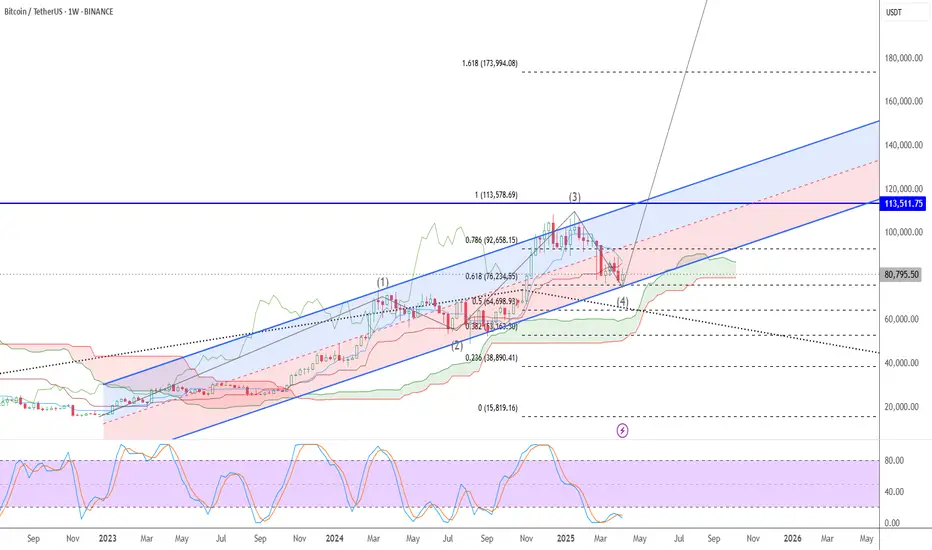
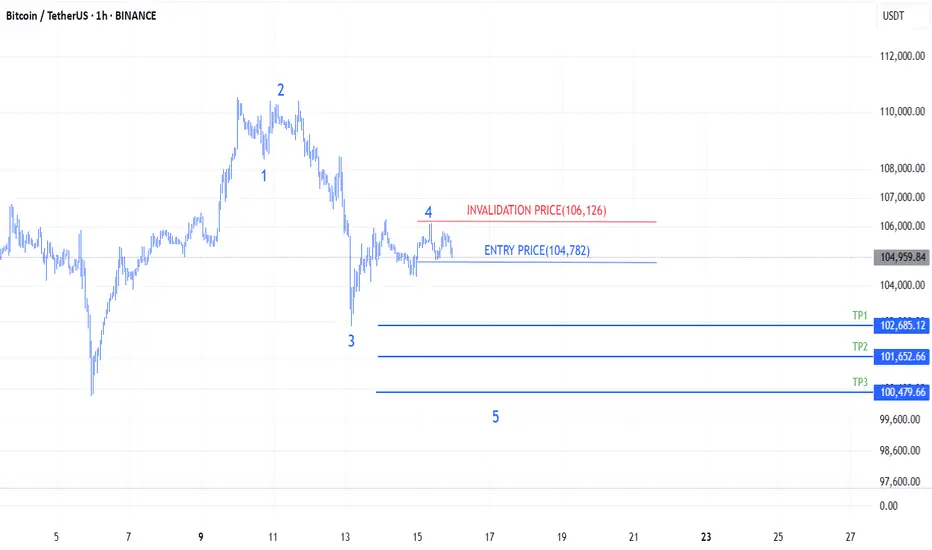
It is possible that Bitcoin is finishing wave 4It is possible that
Bitcoin is finishing wave 4
Will expand to wave 5
The target is more than 250,000 dollars
BTCUSDT.3L trade ideas
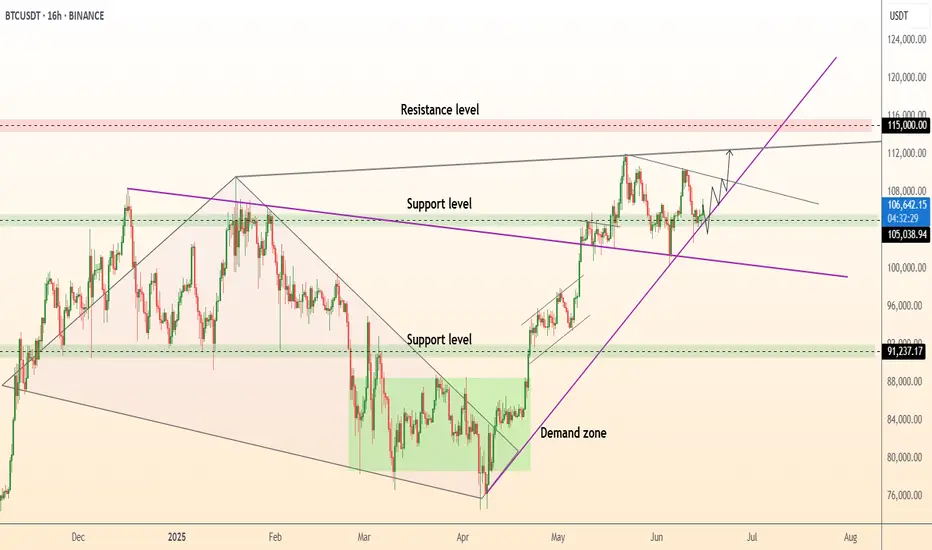
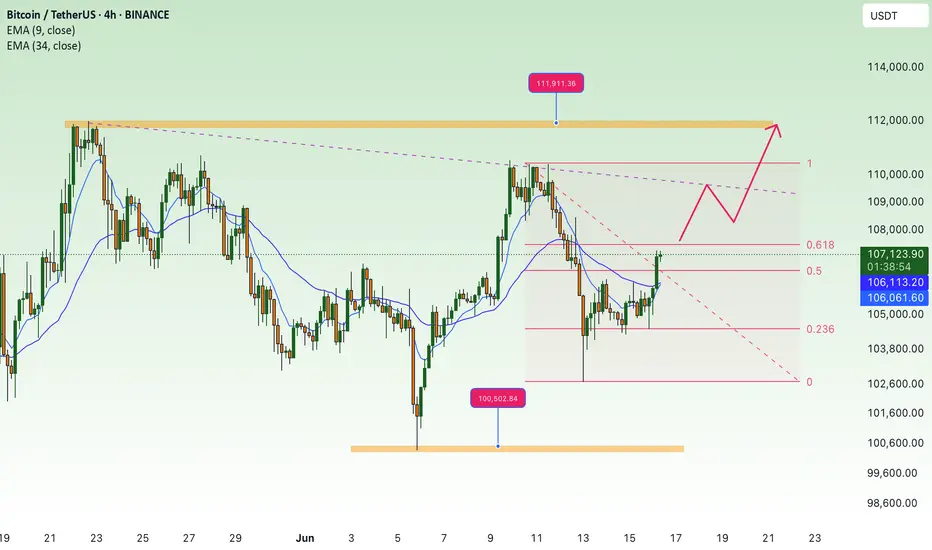
DeGRAM | BTCUSD formed the rising bottom📊 Technical Analysis
● BTC rebounded exactly at the purple long-term trend-line and green 102.5-104 k demand, reclaiming the 105-106 k support band; the old wedge cap is now acting as a floor.
● Price is coiling in a 16-h bull flag beneath 108 k; its 1.618 projection intersects the channel roof/ red supply at 111.6-115 k, while rising lows keep momentum pointed up.
💡 Fundamental Analysis
● U.S. spot-BTC ETFs attracted about $240 m of net subscriptions on 14 Jun, ending the outflow streak and signalling renewed institutional demand as exchange reserves slide to multi-year lows.
● Benchmark 10-yr Treasury yields are back under 4.45 %, easing dollar pressure and helping risk assets rebuild after the FOMC spike.
✨ Summary
Buy 105-106 k; flag breakout above 108 k targets 111.6 k → 115 k. Invalidate on a close below 101.8 k.
-------------------
Share your opinion in the comments and support the idea with a like. Thanks for your support!
Accumulate, BTC back above 110K💎 BTC PLAN UPDATE (June 16)
NOTABLE BITCOIN (BTC) NEWS:
Bitcoin (BTC), Ethereum (ETH), and Ripple (XRP) are showing signs of stabilization around key support levels following last week’s correction. BTC is attempting to regain momentum after closing below a critical support zone, while ETH and XRP are hovering near technical thresholds that could determine their next directional move.
TECHNICAL ANALYSIS OUTLOOK:
Bitcoin could decline further if it closes below the 50-day EMA
Bitcoin closed below its daily support at $106,406 on Thursday, then bounced back after retesting the 50-day Exponential Moving Average (EMA) at $102,893 on Friday. BTC has since stabilized around the $105,000 level over the weekend. As of Monday, it continues to consolidate, trading near $105,788.
If BTC fails to close above the $106,406 resistance level and heads lower, it may extend its decline toward the psychologically significant $100,000 level.
The Relative Strength Index (RSI) on the daily chart is hovering around the neutral 50 mark, signaling indecision among traders. Meanwhile, the Moving Average Convergence Divergence (MACD) indicator shows a bearish crossover on the daily chart, indicating selling pressure and a possible downtrend continuation.
At this stage, whether you're new or experienced, it's wise to spend more time practicing, deepening your technical analysis knowledge, and exploring educational content shared on the channel. Strengthening your foundation will help you protect your capital in this volatile environment.
==> This analysis is for trend reference only. Wishing all investors successful trades!
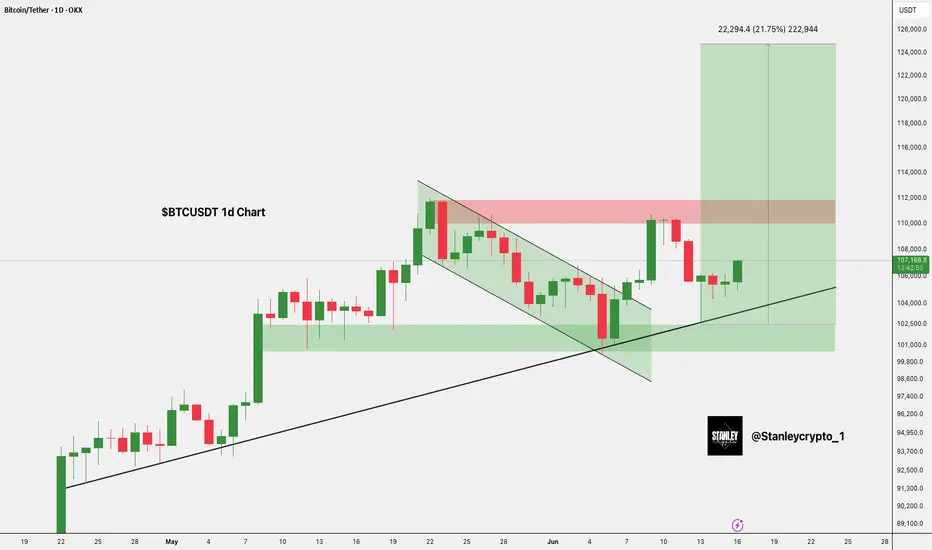
$BTC Breakout Targets $125KCRYPTOCAP:BTC has broken out of a falling wedge and is holding strong above the $103K support zone.
Price is pushing upward toward the key resistance at $110K– $112K.
A breakout above this zone could trigger a move toward $125K.
DYRO, NFA
Monday trades of the day🔥 These are the scalps I’ve got my eye on today. 🔥
Mostly looking at continuation longs — unless structure tells a different story.
💡 Key Plan:
For each long setup, I’ll wait for an internal market structure (MS) flip before pulling the trigger. No confirmation, no entry. Precision is the priority.
📅 Class Schedule:
Monddaday | After 6 PM
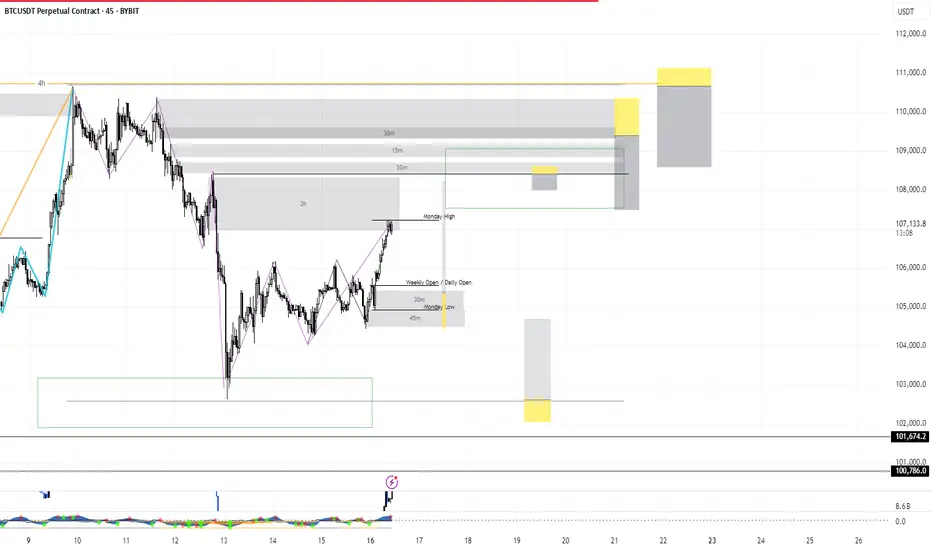
BTC BITCOIN ,we are watching every step and price action,the next clear directional bias on long will be on the break and close of daily supply roof at 111k, while the sell confirmation will be on the break and possible retest of the daily ascending trending line holding buyers for today 16th.
Israel and Iran war could be seeing liquidity into crypto especially bitcoin

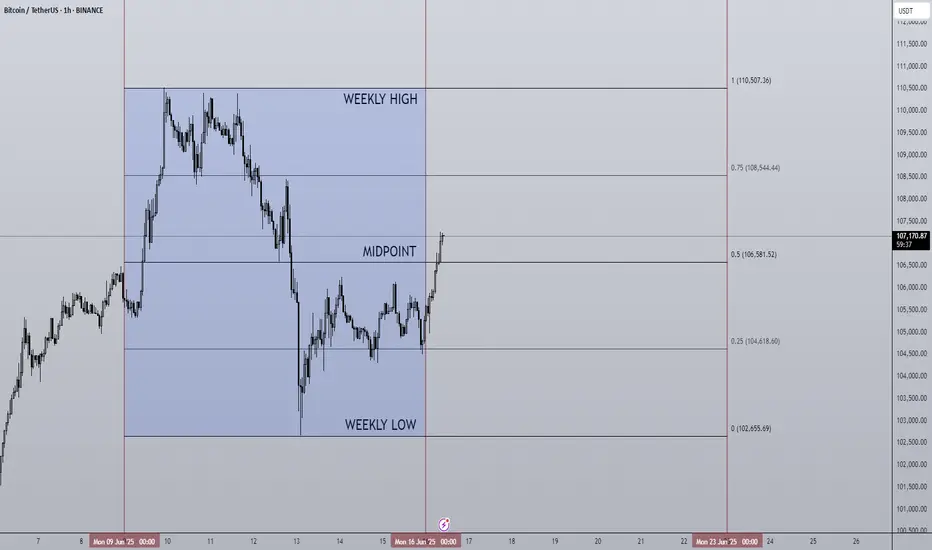
16/06/25 Weekly OutlookLast weeks high: $110,507.76
Last weeks low: $102,655.69
Midpoint: $106,581.52
With all eyes on the ever escalating geo-political landscape, how did BTC react and what can we see for this week?
The initial move higher broke through the previous weeks high with strength before a triple top just under ATH, then falling back down towards the lows of $102,650 which was the previous weeks midpoint, both levels were key battlegrounds as pointed out in the last weekly outlook.
Now the midweek fall off could be blamed by the escalating conflict in the middle-east, that is an argument that has merit as risk-on assets naturally take a hit when uncertainty enters the market. From a TA standpoint BTC had three separate attempts at $110,500 and failed it, the bulls therefore have to retreat as the battle is lost and have expended their resources. So I see it as a both FA and TA are responsible for the move.
As the week starts with a positive early move the orderblock at 0.75 line looks like the next key battleground, rejection at that level would see BTC enter a more rangebound environment within the weekly range. Flipping $108,500 makes a weekly high retest probable IMO.
I do believe that the geo-political aspect will play a role this week so volatility is expected.
Good luck this week everybody!
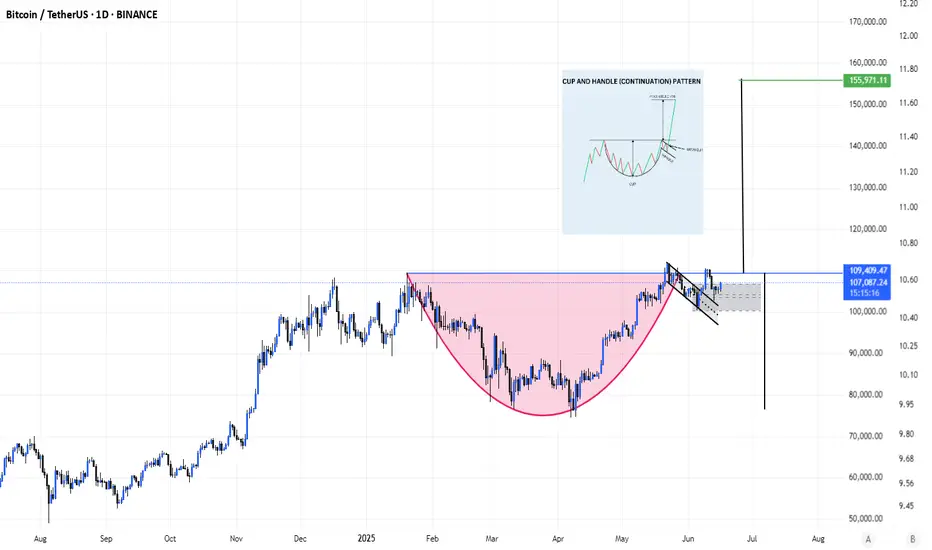
BTC/USDT.dBtc forming a beautiful Cup and Handle chart pattern. Target is $150k roughly. Price should really move hard once BTC goes above the neckline into price discovery. This is a good risk to reward setup. Enjoy!
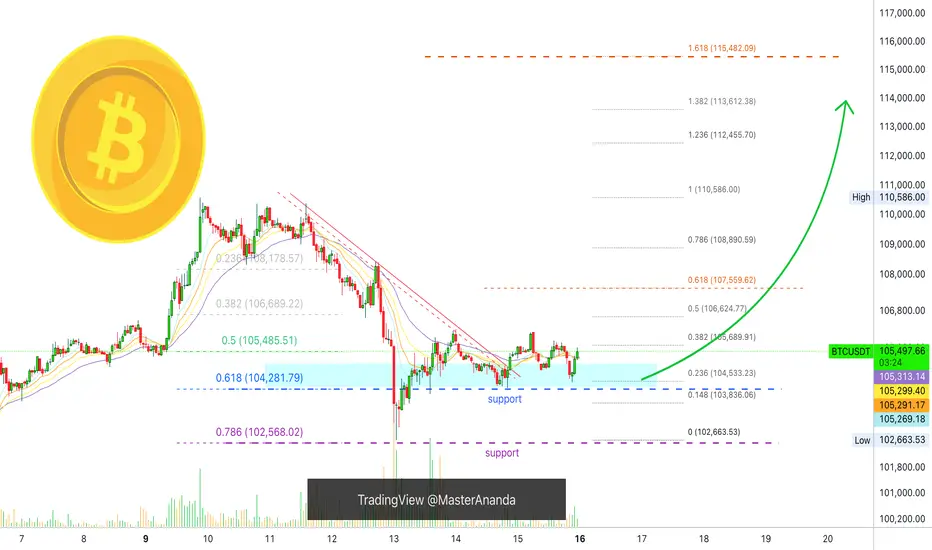
Bitcoin Short-Term, 1H Timeframe, Bullish ($115,482 Next Target)Bitcoin completed its retrace 13-June 01:00 AM with a higher low at $102,663. Price action and trading volume indicates that the bearish move is over. Bitcoin is trading above support in the form of 0.618 Fib. retracement.
Bitcoin is turning bullish moving above EMA34, EMA21, EMA13 and EMA8 all in this current active session.
Immediate support stands between $105,293 and $105,314.
Next support is $104,533 and main support $104,282 matching the 0.618 Fib. retracement level.
Next target easy hit is $106,625, followed by $107,559. The second being a mild resistance.
Bitcoin can easily continue higher short-term aiming next at $108,989 followed by the last high at $110,586. Depending on how this level is handle we can update the short-term view.
The 1H timeframe is bullish now based on price action, candlestick patterns, higher lows, moving averages and the oscillators.
Namaste.
BtcBtc direction is turned over in to huge sell and bear whale is active now the trading price will go to ward 99k lets keep on eye
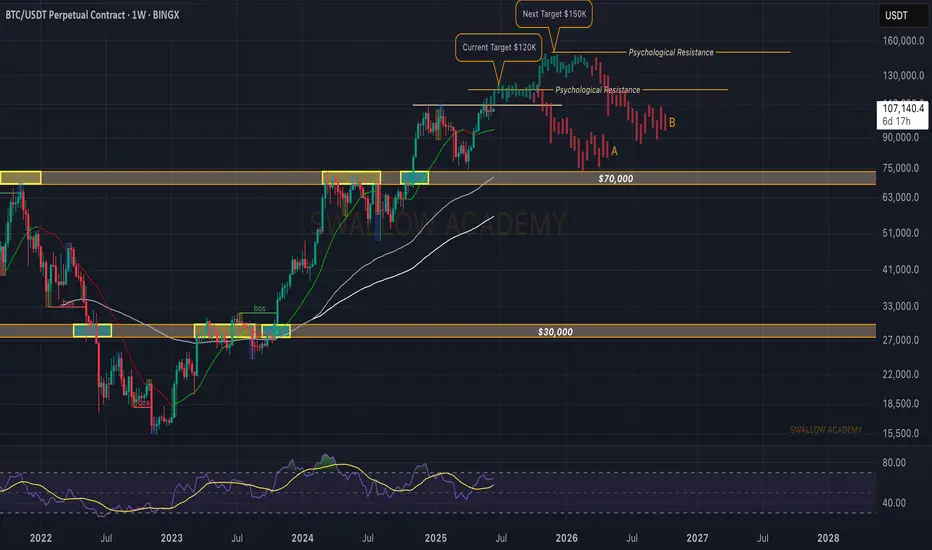
Bitcoin (BTC): Gameplan Remains Same | Bullish Start of WeekBitcoin is showing signs of recovery, where buyers are taking over the Monday lows and pushing prices to upper zones. Now that we see the recovery, we are back in play, expecting the price to reach the ATH area once again, where we will be looking then for $120K.
Swallow Academy
Crypto Crash Is Coming! Time to sell everythingThe war is escalating every day, major hits in Tel Aviv , Haifa and big cities. US will get involved wether they want it or not, since Israel doesnt want to stop the war without fully destroying all threats and leaders, and it can't finish the war alone.
Btc have to fill the monthly gap, crash is coming.
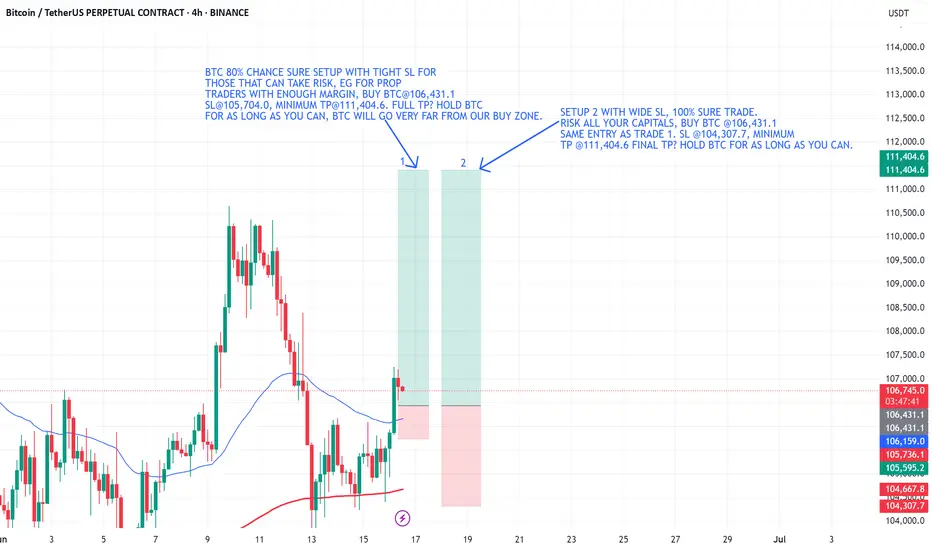
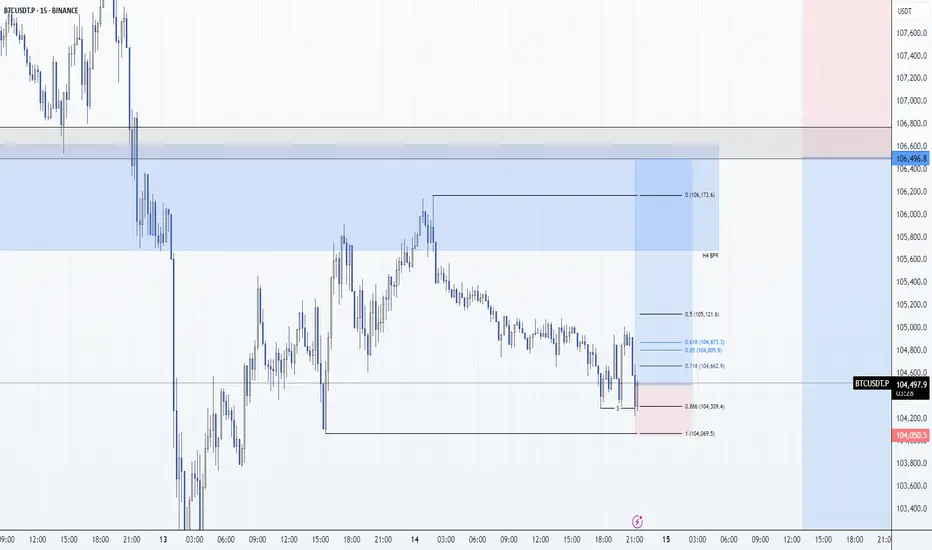
BTC: Scalp Long 14/06/25Scalp Long
Risk is halved because weekend
Then additionally halved because counter HTF Trend =
0.25R Risk
Reason:
0.886 retrace
M5 EQL swept
M5 Ts
M15 Bull Div
H1 Bull Div
Still hoping we get a 106,700 retest. For HTF Higher probability shorts.
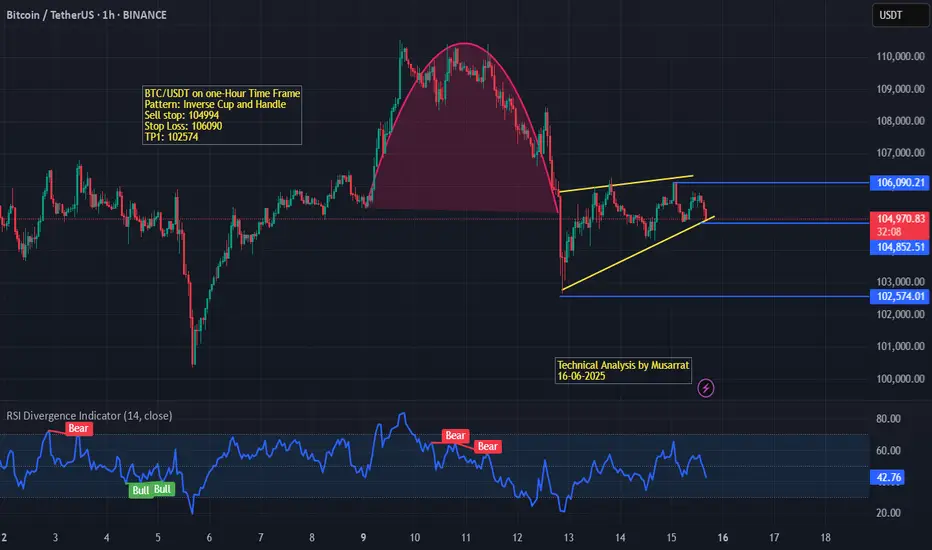
BTC/USDT on one-hour Chart ProjectionsThe chart illustrates a classic Inverse Cup and Handle pattern formation. The cup is clearly marked by a rounded top, indicating a reversal structure forming after a previous uptrend. Following the breakdown from the right rim of the cup, the price action has transitioned into a bearish consolidation, forming a potential rising wedge or weak bear flag – both of which typically indicate continuation to the downside.
Key Levels & Trade Setup:
Sell Stop: 104,494
Stop Loss: 106,090
Take Profit 1 (TP1): 102,574
These levels suggest a short-selling strategy with a favorable risk-to-reward setup targeting the breakdown of the handle portion of the pattern.
Indicators:
RSI (14, close) is currently at 42.95, which lies in the neutral-to-bearish territory.
Multiple Bearish RSI Divergences were signaled before the recent drop, supporting the short thesis.
Minor Bullish RSI signals were observed earlier but failed to sustain momentum above the 50 line.
Conclusion:
The technical structure, along with bearish RSI signals and pattern confirmation, suggests that BTC/USDT is likely to experience further downside, especially if price breaks below the 104,494 support. A breakdown from the current ascending structure could lead to the 102,574 support zone being tested in the near term.
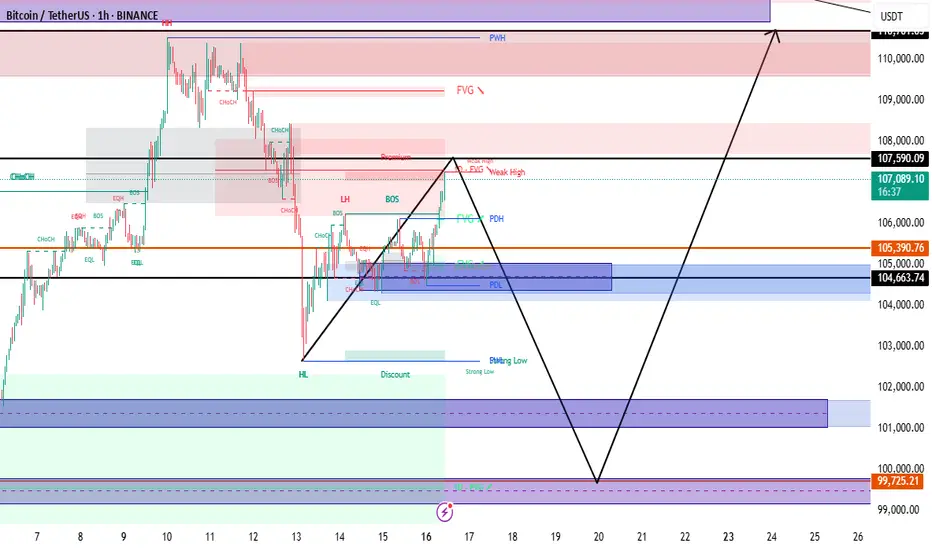
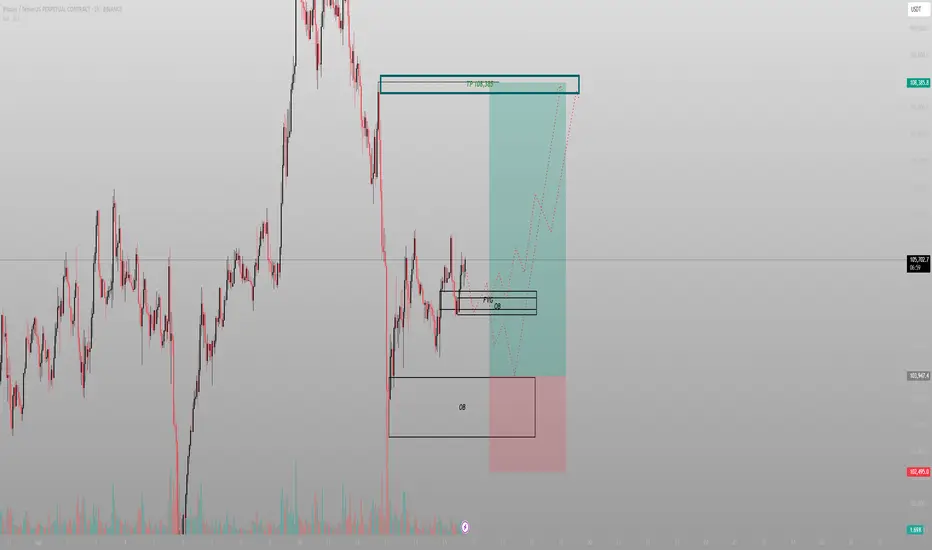
The FVG was the invitation. The OB was the entryBTC delivered exactly where it needed to. It didn’t break down. It rebalanced. The chart isn’t noisy — it’s speaking. And it’s pointing to 108.3k.
The logic:
Price printed clean displacement, returned to mitigate a 1H FVG stacked on top of a refined Order Block, then paused. That pause is structure — not indecision. Volume compression confirms it: absorption, not rejection.
A deeper OB sits below at 102.5k. If we tap it, it’s not invalidation — it’s refinement. But the primary play is already in motion.
The path:
Reclaim 105.7k range high
Break above intraday liquidity
Deliver to 108.3k inefficiency fill
Execution:
Entry: 104.8k–105.1k (current OB zone)
SL: Below 103.9k
TP: 108.3k
Don’t react to the candles. React to what they represent — engineered displacement followed by precision mitigation.
Final thought:
“This isn’t a trade setup. It’s a delivery route — and I’m already onboard.”
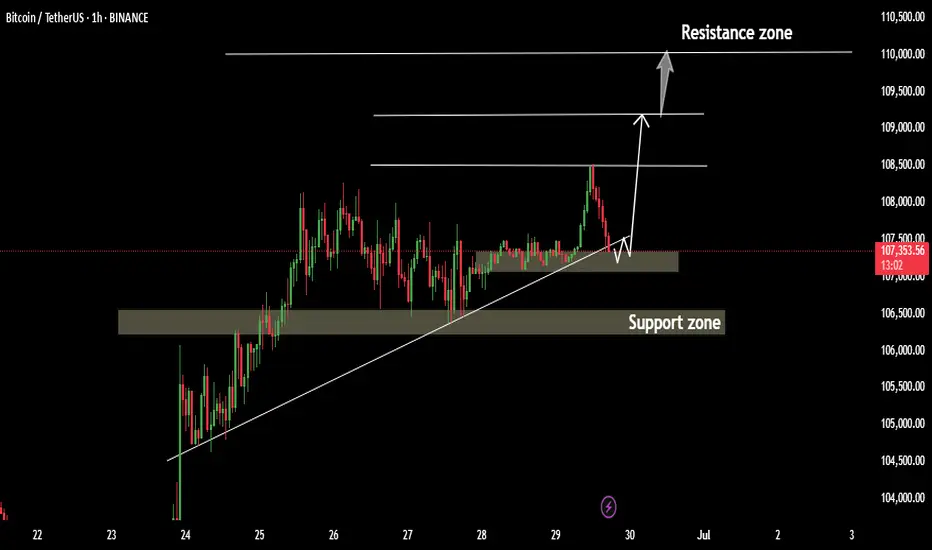
BTCUSDT Analysis – Bullish Focus Amid ConsolidationBTCUSDT Analysis – Bullish Focus Amid Consolidation
Bitcoin is currently mirroring the broader market sentiment, particularly tracking the S&P 500. After a false breakout above the psychological 100K level, BTC entered a distribution phase, followed by a consolidation range. This indicates a potential accumulation before a bullish continuation, although resistance levels remain key hurdles.
False Breakout at 100K: A failed breakout attempt triggered a sharp reversal, signalling short-term weakness. Price rolled back and found temporary support around 106,200, pausing further downside The pair is consolidating within a tight range, indicating a possible setup for a renewed bullish push.
Outlook: Despite the resistance cascade, BTC remains in a bullish structural zone as long as it holds above 106,000. A clean breakout above 108,500–110,000 could open the path back toward 114,000–117,000. However, failure to break may result in a deeper pullback towards 104,000–102,500.
Ps Support with like and comments for more analysis Thanks for supporting.
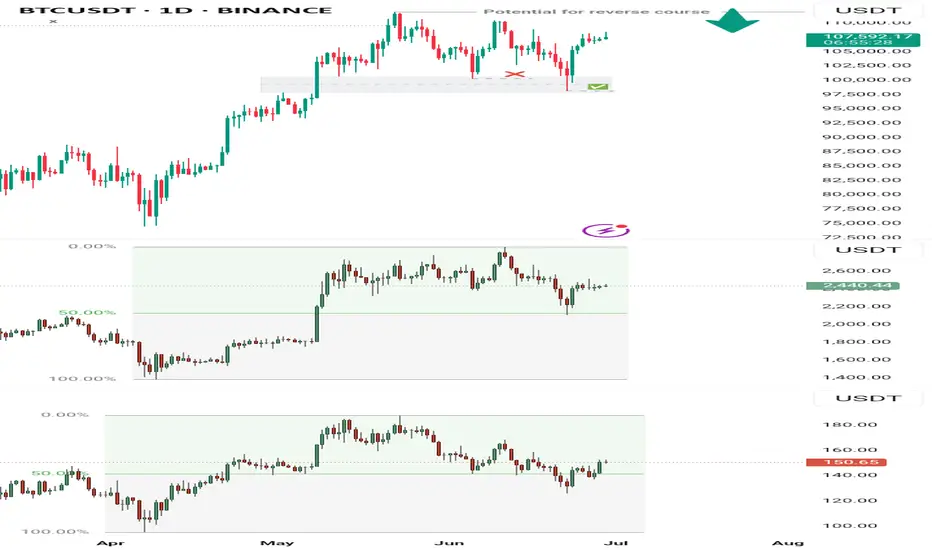
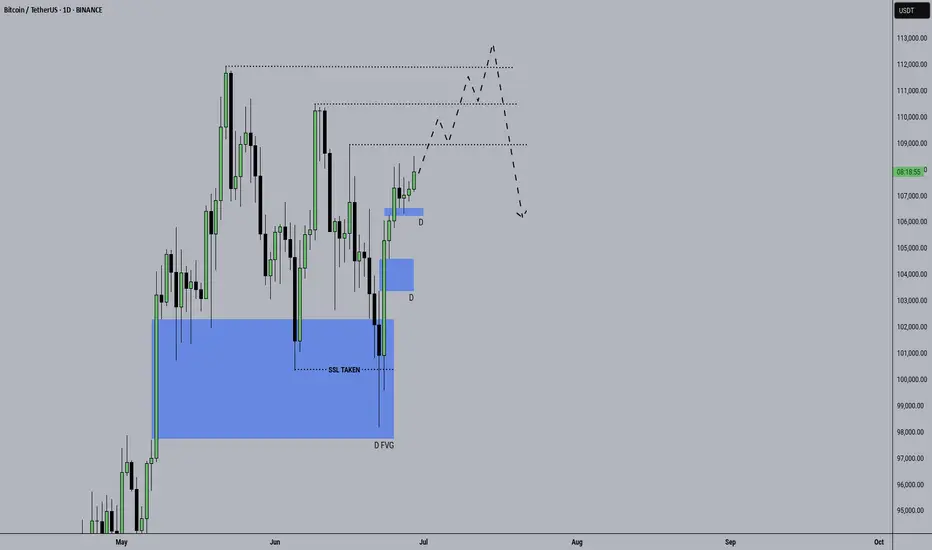
BTCUSDT Market Outlook (Daily Chart)BTC’s failure to rally into a new all-time high (ATH) from the June 5th low can be attributed to the fact that price wasn't coming from a true discount zone. Similarly, key correlated assets like ETH and SOL also hadn’t reached their respective discount levels at that point. This misalignment created an unbalanced market structure, which necessitated a corrective move to realign broader market pricing.
Now that both ETH and SOL have tapped into their discount zones and shown signs of recovery, the conditions are more technically sound to project a potential ATH for BTC in the coming weeks or month. However, on a broader scale, this current rally could serve as a liquidity trap — drawing buyers into a high before distribution.
As for now, any sudden price drop should be seen as a potential buying opportunity into the anticipated new ATH. But caution remains key — any strong sell signal or reversal confirmation near the ATH zone could trigger a significant selloff as sellers regain control.
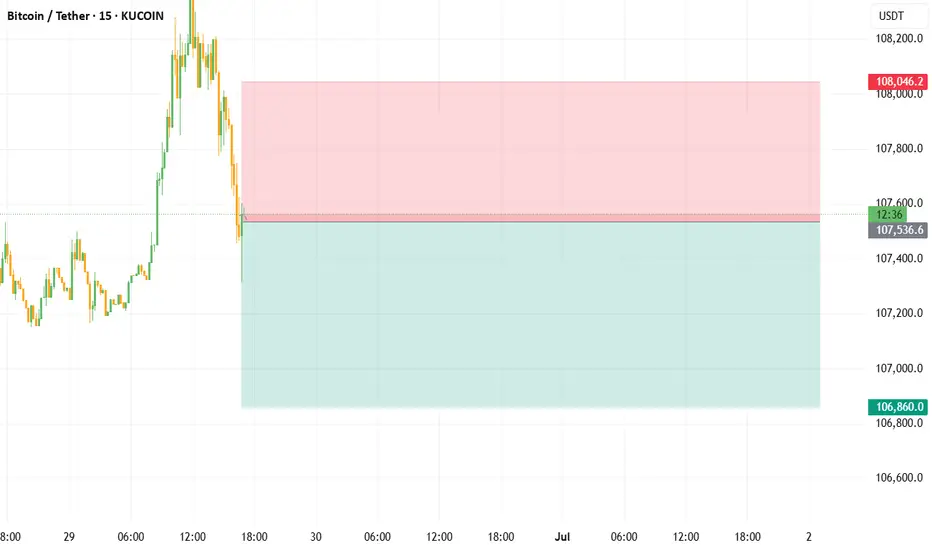
BTC/USDT high win scalping signals in 15 minutes are as follows- Signal: SHORT
- Admission: 107,480 ~ 107,620
- Take Profit: 107,100, 106,860
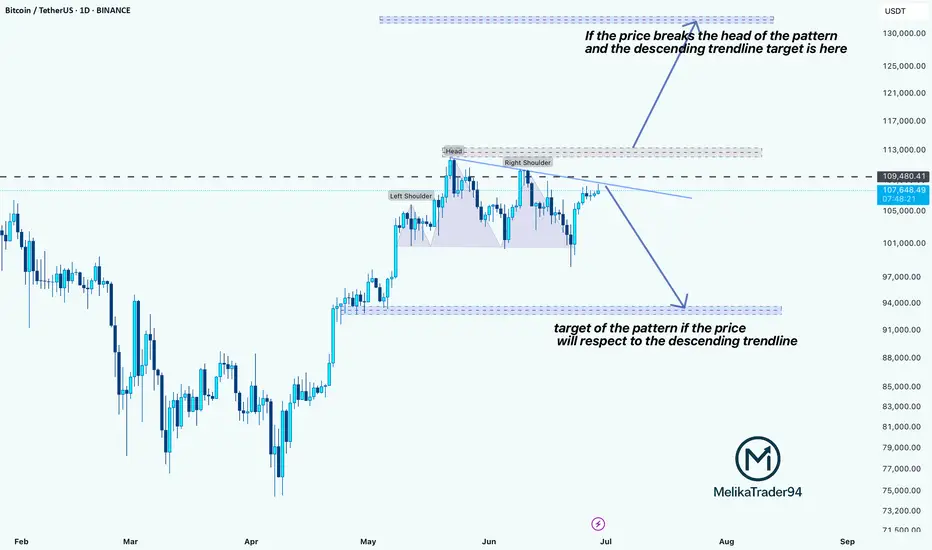
Bitcoin at a Crossroadshello guys!
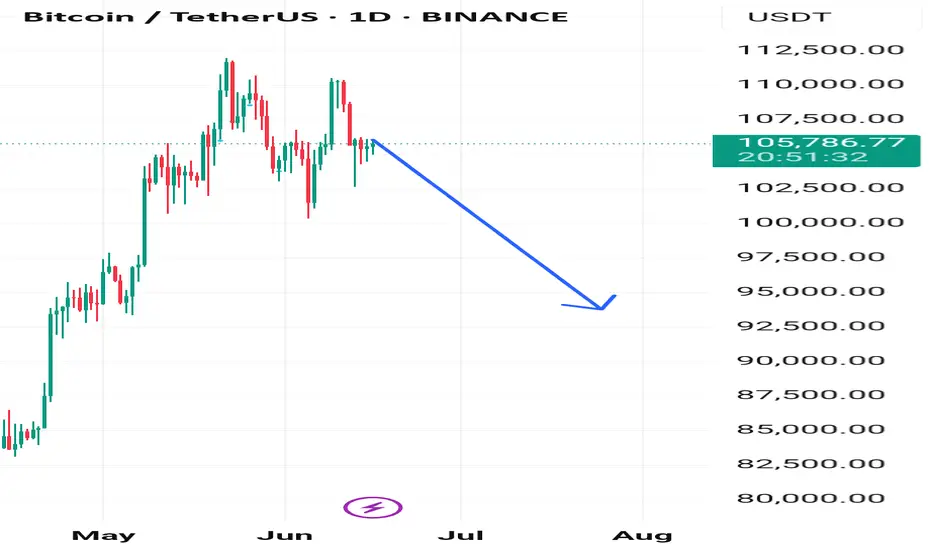
In the current 1D chart of BTCUSDT, a Head & Shoulders pattern has formed, suggesting potential for significant price movement in the near term. The structure includes a defined left shoulder, head, and right shoulder, with a descending trendline acting as a critical resistance level.
🔹 Bearish Scenario:
If the price respects the descending trendline and fails to break above the neckline (around $109,480) , a bearish reversal is likely. In that case, the target based on the pattern lies near the $93,500–94,000 support zone. This level aligns with a previous consolidation area, making it a strong candidate for a reaction or bounce.
🔹 Bullish Scenario:
On the flip side, if the price breaks above the neckline and the descending trendline, invalidating the pattern, a strong bullish continuation could unfold. The potential breakout target would be around $127,000–130,000, in line with the projection from the head of the pattern.
BTC to move upwards this week?Daily Outlook:
- market swept sellside liquidity
- price moved impulsively
- market moving higher reaching buyside liquidity
- may reach ATH and sweep to go lower
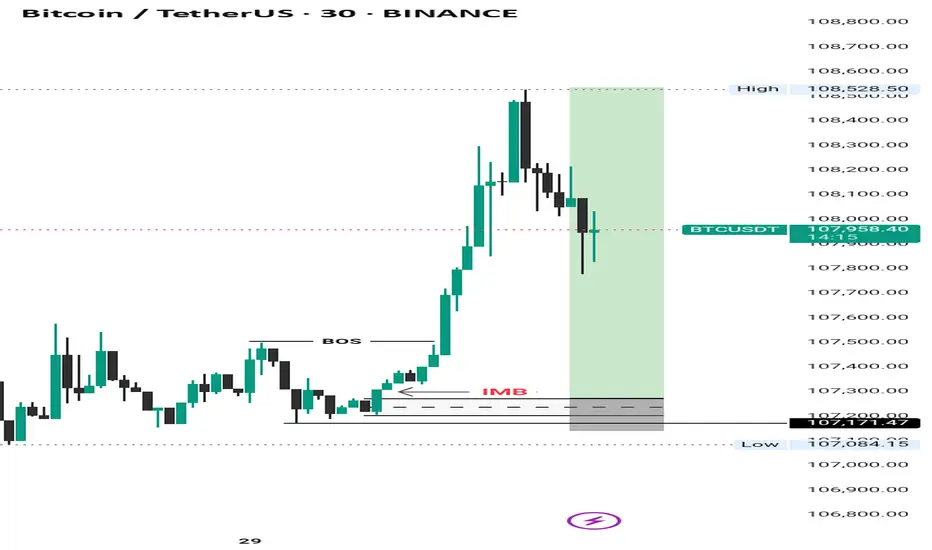
BITCOIN TRAVELLING NORTH In the wee hours of Sunday we got a BOS indicating a strong bullish movement to the upside.
BINANCE:BTCUSD
Proper risk management is advised.