BTCUSDT.3L trade ideas
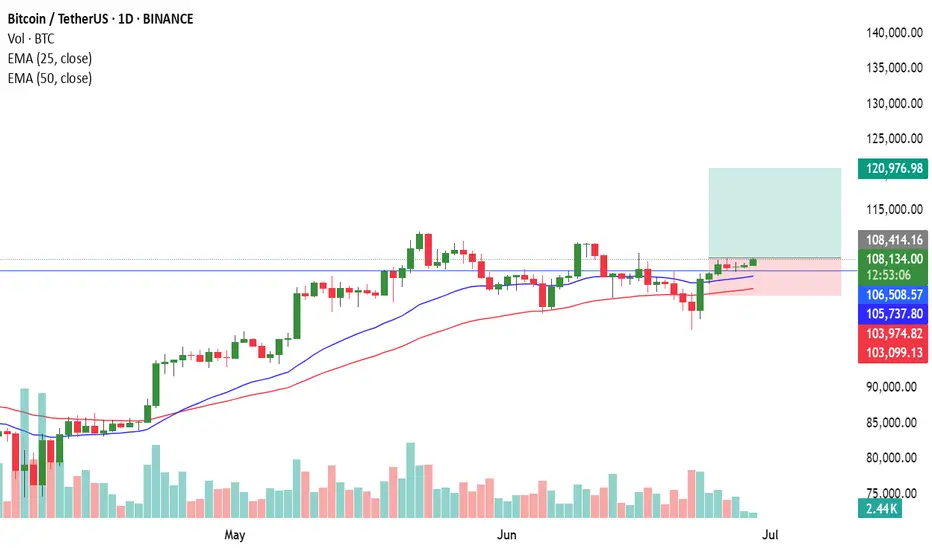
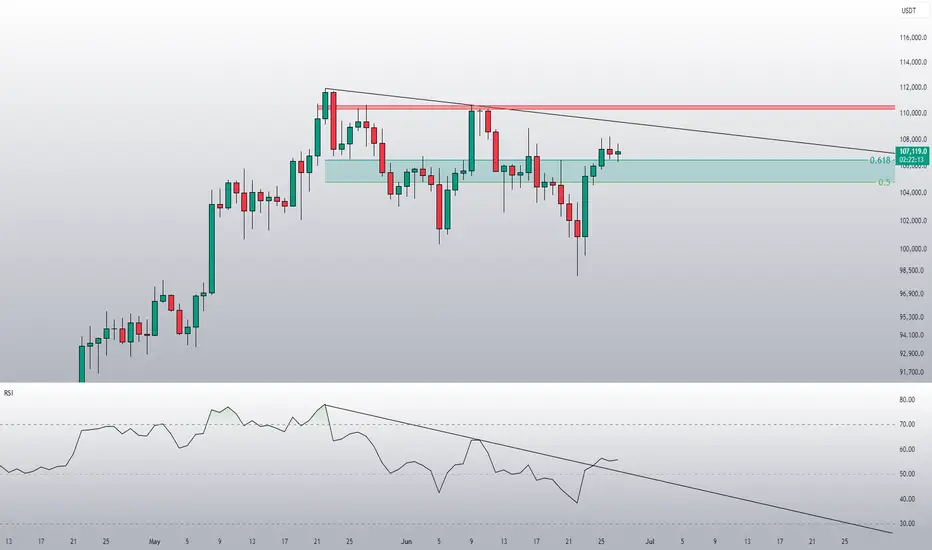
Analysis of Bitcoin Market StrategyTechnical Analysis of Bitcoin (BTC) Contracts: In terms of today's market, the daily chart of the large cycle closed with a small bullish candle yesterday. The K-line pattern shows consecutive upward movements, with the price above the moving averages. The attached indicators are in a golden cross, indicating an obvious upward trend in the long term. However, the current upward momentum and sustainability are relatively weak. Therefore, it is recommended to maintain short-term trading and strictly control risks.
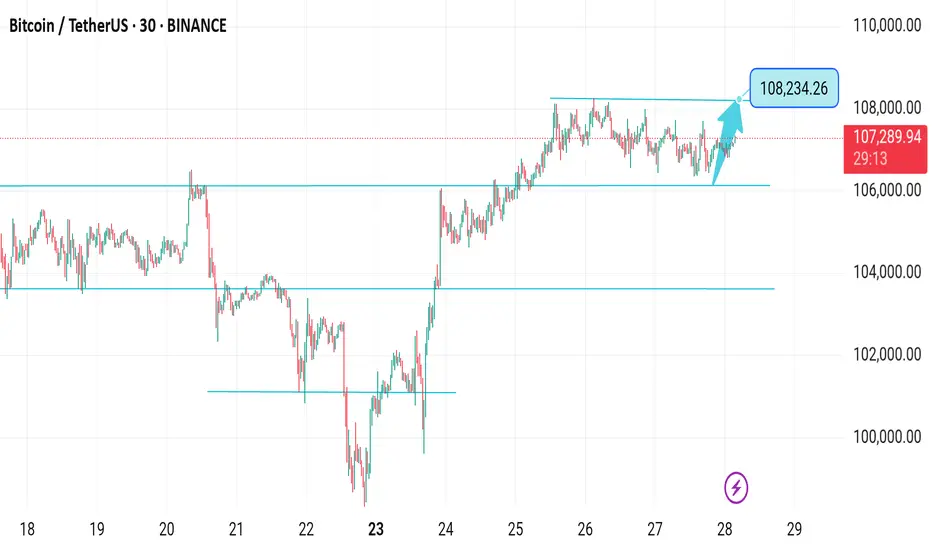
In the short-term hourly chart, the overall price has been consolidating at high levels. The current K-line pattern is in consecutive bullish candles, with the price above the moving averages, and the attached indicators are in a golden cross. Therefore, an upward movement is highly probable today, with the support level near the 106,300 area.
you are currently struggling with losses,or are unsure which of the numerous trading strategies to follow,You have the option to join our VIP program. I will assist you and provide you with accurate trading signals, enabling you to navigate the financial markets with greater confidence and potentially achieve optimal trading results.
Trading Strategy:
buy@106300-106500
TP:108000-108500
Bit coin buy for long term.It is very break out to almost double. The profit booking will be update when it reaches target.
LONG BTC TILL 129,000Hi, I am expecting BTC to continue its uptrend with little fluctuations till 129K. Can go more till 140K but would be needing confirmation before we long again.
DISCLAIMER: ALL MY SHARED IDEAS ARE ONLY FOR EDUCATIONAL PURPOSES. I AM NOT RESPONSIBLE FOR YOUR ANY PROFIT OR LOSS.
6HR CPR StratMultiple examples of trending price action using the 6Hr CPR Start, combining with momentum ribbons using PAR.

BTC Breakdown Stp Bearish triangle Sell below $60.5k target 58k$Chart Overview:
Asset: BTC/USDT (Bitcoin)
Chart Type: Candlestick
Timeframe: Likely intraday (short-term, possibly 15m or 1h)
Indicators/Tools Used:
Trendlines
Support/Resistance levels
Pattern formation (possible descending triangle)
---
Technical Analysis:
🔻 Bearish Bias (Sell Signal):
Pattern: A descending triangle pattern is visible—typically a bearish continuation pattern.
Lower Highs: Indicates selling pressure increasing over time.
Flat Support Zone: Around $60,500–$60,600. Price is testing this zone repeatedly.
Breakdown Likely: If price breaks and closes below this support, a sharp drop can be expected.
---
📉 Put Direction: Sell BTC
Entry (Sell): On break below $60,500
Target 1: $59,200 (near previous consolidation zone)
Target 2: $58,000 (measured move from triangle)
Stop Loss: $61,000 (above descending trendline)
---
✅ Summary:
BTC is under pressure below resistance and forming lower highs.
If it breaks $60,500 support, a downward continuation is expected.
Strategy: Sell on breakdown, target $58,000 short-term.
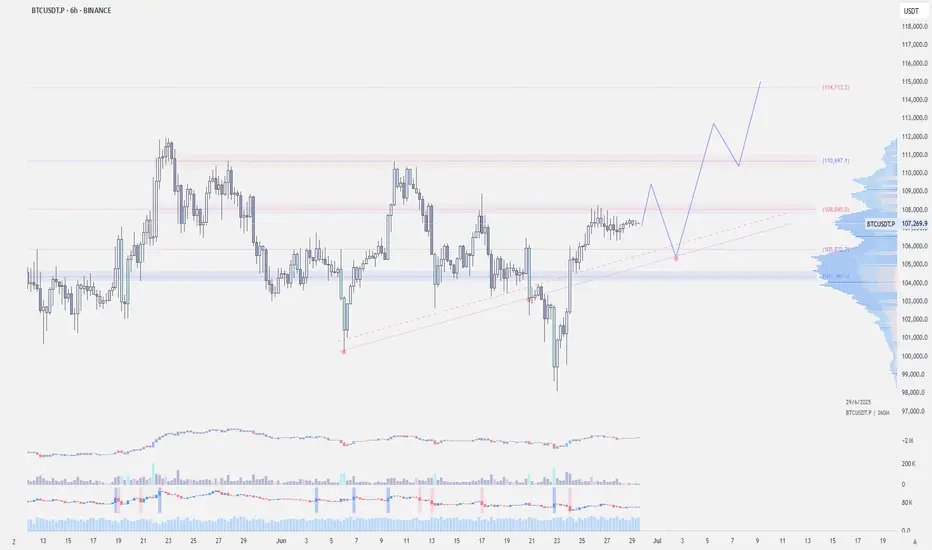
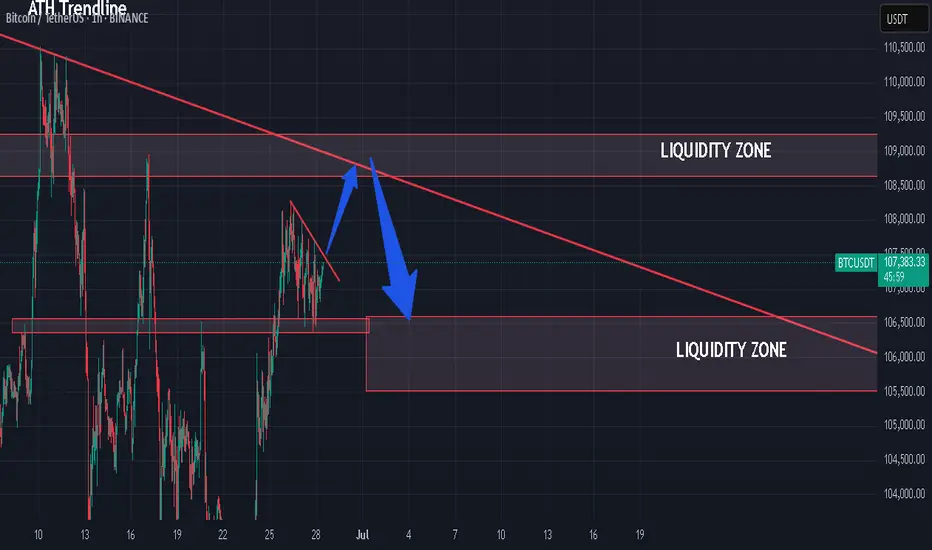
Bitcoin - Weekend OutlookCRYPTOCAP:BTC | 6h
Bitcoin is compressing below its all-time high, with 108k as the local resistance that must be reclaimed for a bullish continuation to retest the highs.
I expect the price to clear some poor highs around 108.8k–109.6k before taking out the bad lows around 106.3k-105.4k
As long as we hold above 104k , I believe we’re in a strong position and expect we will retest the highs.
However, losing the 103k support level would be concerning.
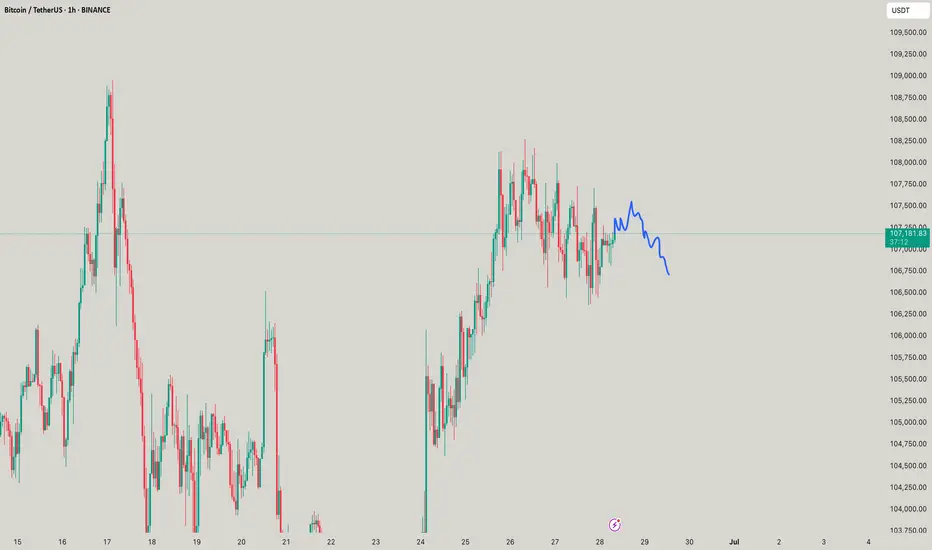
Bitcoin's Growth Potential Intact Despite Short-Term UncertainyBitcoin has rallied to $108k after sweeping liquidity below $98k, driven by easing geopolitical tensions in the Middle East. The cryptocurrency's fundamentals and structural trends suggest room for growth, but it appears to have exhausted its momentum, entering a consolidation or accumulation phase. Technically, the 4-hour chart is limited, but a potential correction to $104k-$103k could occur before further growth. For now, traders can focus on short-term buys and sells in the $106k-$108k range, awaiting clearer direction.

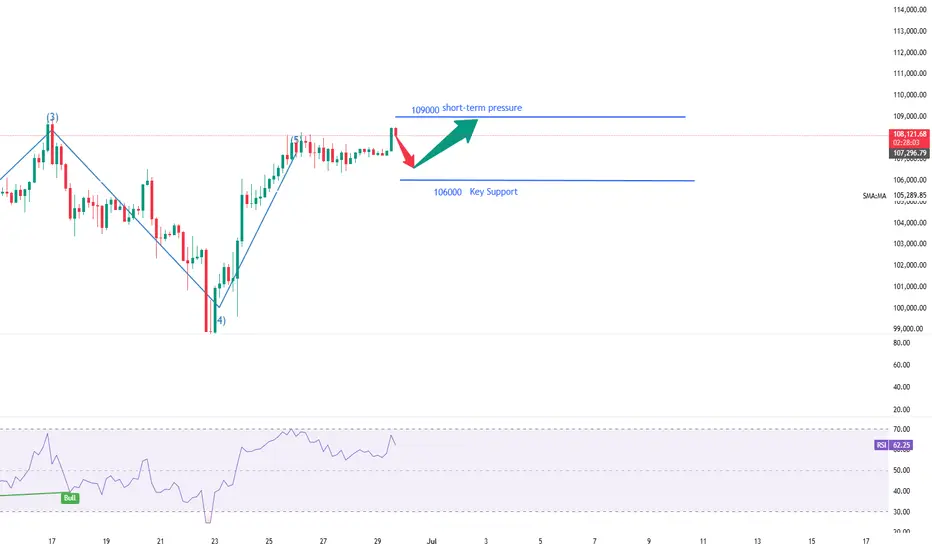
BTC Trade Setup 28.06.2025 BTC Possible Trade Setup.
Entry 108.600 - 109.000
TP.1 106.500
TP.2 105.500
SL 110.000
its my own analysis, i am not liable of any loss.
BTC - Its Constipated!This is BTC 4H SVP
Birds eye view says its just negating all moves, neither down or tops,
In simple words: right now BTC is stuck in a tight box. If it breaks down, we may see a fast drop to $106,000. If it breaks above $107,600, it may go higher. Until then, avoid entering blindly and wait for one side to win.
Chances are way higher for it to move up! Hoping to make EQH and a small fall.
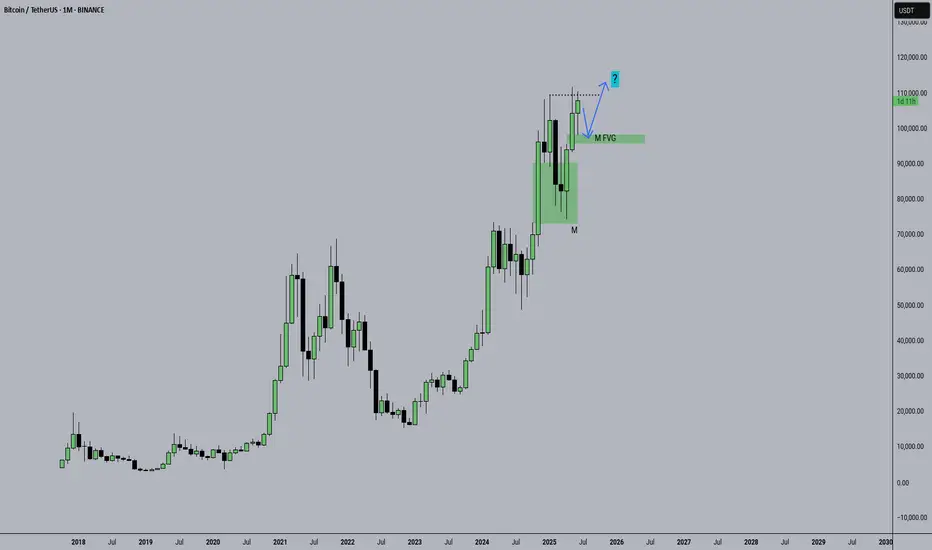
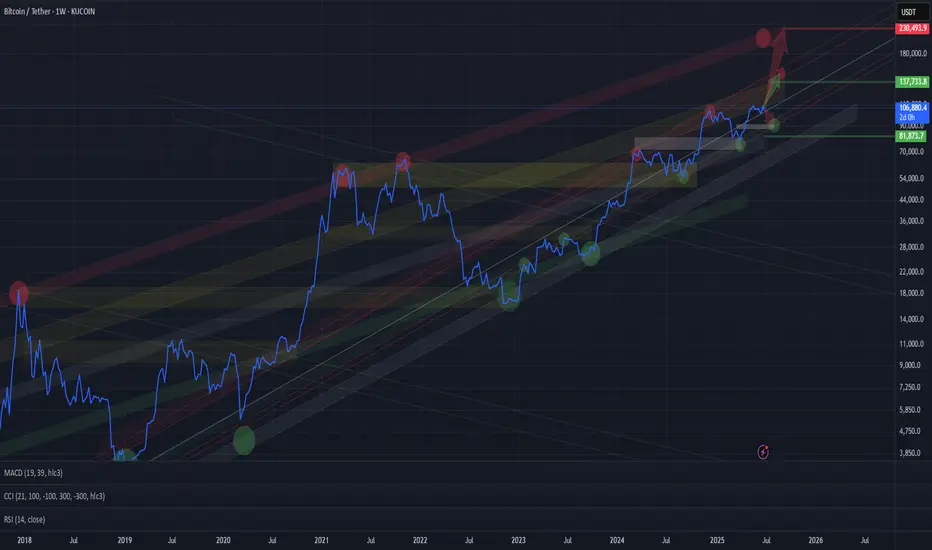
BTC BTC/USDT LONG_TERMChannels are drawn, long-term targets are clear. The upper extreme visible so far is around $200K for Bitcoin — possible within this cycle.
More realistic targets for this cycle are around $135K.
In the short term, a correction to the lower red channel zone ($88K–94K) is possible.
Watching closely.
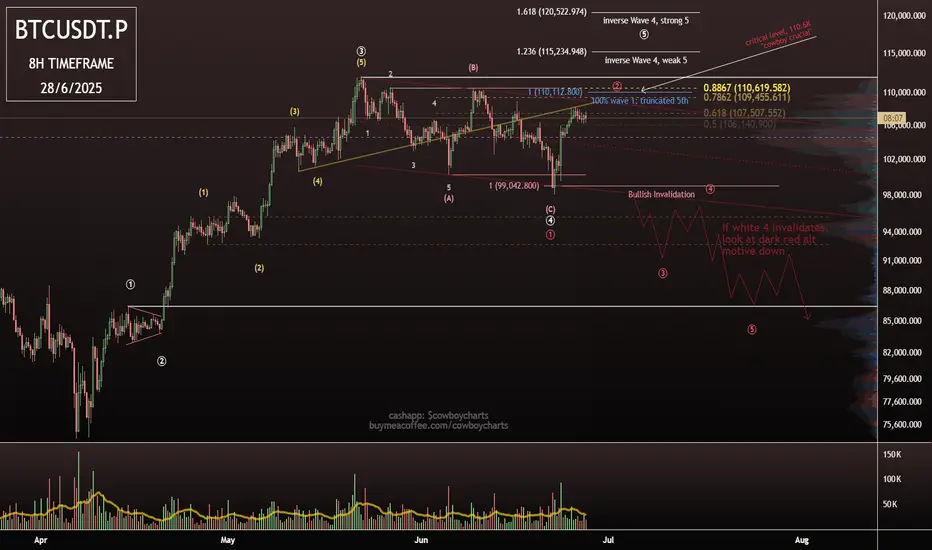
BTC - A New Oregon Trail or Fool's Gold?The ranch hand (chart) reckons Bitcoin hit a big wave‑3 peak, then swung into a corrective wave‑4 saddle.
Now it's circling the watering hole, teetering around a key resistance near $110k—the cowboy‑critical line in the sand.
If that line holds strong, expect another surge—an “inverse wave‑4, strong 5” push higher toward $115–120k.
But if it buckles, a darker scenario’s afoot: a red‑inked, five‑wave drop galloping down toward $85k.
Bottom line: keep your hat on—$110k is the frontier. Break above that, and the herd’s heading north; if not, saddle up for a ride downhill.
BYBIT:BTCUSDT.P
BITSTAMP:BTCUSD
Are we out of the woods? BTC has been trading above the golden pocket for three consecutive days. This should give us a technical target of at least 110k, where the next major resistance lies.
BTC next boom beginning I'm going to see boom in btc
Here’s the analysis of Bitcoin’s (BTC) next expected move in English, based on current market conditions and technical indicators:
---
### **1. Short-Term Outlook (Next 24-48 Hours)**
- Bitcoin is currently trading around **$107,400**, with **$108,000-$109,000** acting as a strong resistance zone.
- If BTC breaks above **$109,870** and closes above it, the next target could be **$114,950**.
- If the price fails to break resistance, a pullback to **$105,300** or **$103,900** (support levels) is possible.
- The **30-minute RSI is at 52.22** (neutral-bullish), and the MACD histogram is in positive territory.
---
### **2. Medium-Term Outlook (1 Week to 1 Month)**
- **Coincodex predicts**:
- **$116,914** (+8.98%) by July 2025.
- **$136,858** in the next 3 months.
- **DigitalCoinPrice forecasts**:
- Average price of **$221,961** by late 2025, with a potential high of **$235,354**.
---
### **3. Key Technical Indicators**
- **4-Hour Chart**:
- BTC is testing the **upper Bollinger Band ($108,672)**. A breakout could target **$114,956**.
- **Support Levels**:
- Immediate support: **$105,358** (EMA 100).
- Strong support: **$103,996**.
---
### **4. Market Sentiment**
- The **Fear & Greed Index** is currently at **74 (Greed)**, indicating bullish sentiment but also potential overbought conditions.
- **Volume**: Stable buying volume suggests sustained interest, but a drop could signal consolidation.
---
### **5. Potential Scenarios**
- **Bullish Case**: Break above **$109,870** → Rally toward **$114,950-$116,000**.
- **Bearish Case**: Rejection at resistance → Drop to **$105,300-$103,900**.
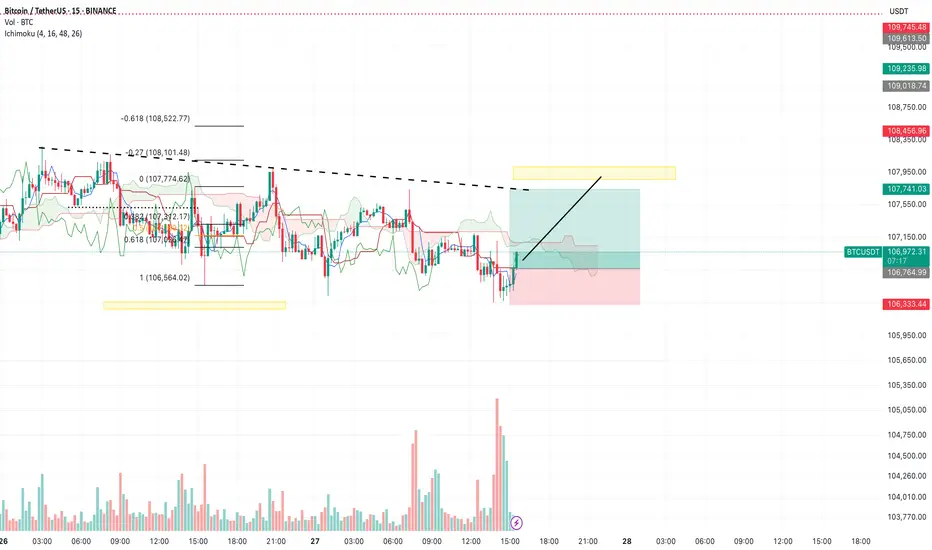
BTC/USDT – Intraday Plan (15m, Ichimoku) by RiscoraToday’s idea:
We’ve seen strong volume at the current support zone. My expectation is for a move upward towards the yellow block at 107,900, targeting liquidity that has accumulated above the dotted trendline.
This is my main scenario for today: a range-bound session with a liquidity sweep to the upside. Watching for reaction as price approaches the yellow zone.
#BTC #Crypto #Trading #Ichimoku #Riscora
BITCOIN - SHORT OPPORTUNITY AND LACK OF MOMENTUMBINANCE:BTCUSDT has been lacking momentum in the last few days. It looks to me that "Good News" is almost "No News" in regards to the Iran war or any crypto legislation. Summer is looking a lot like sideways movement, and due to the previous explosion in momentum and volume, I think the lack of it will bring the price down in the following days or weeks.
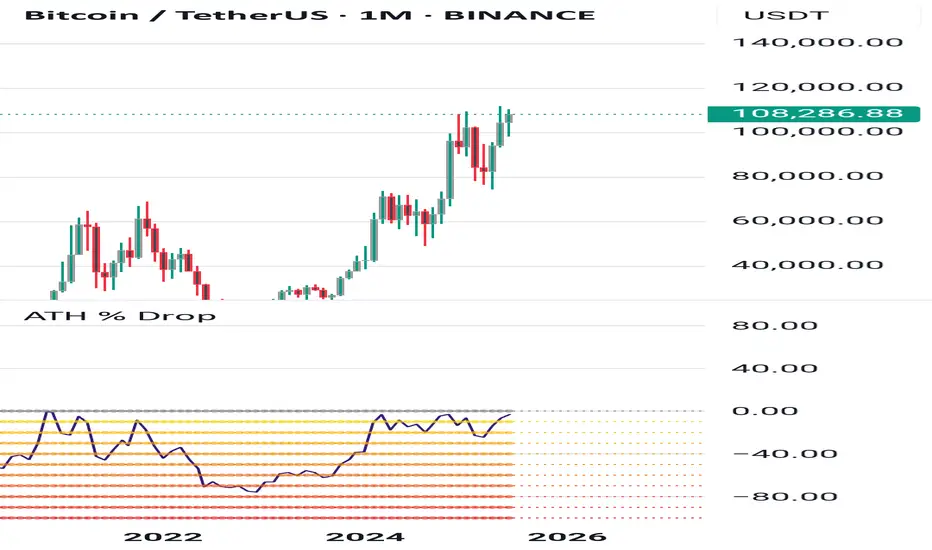
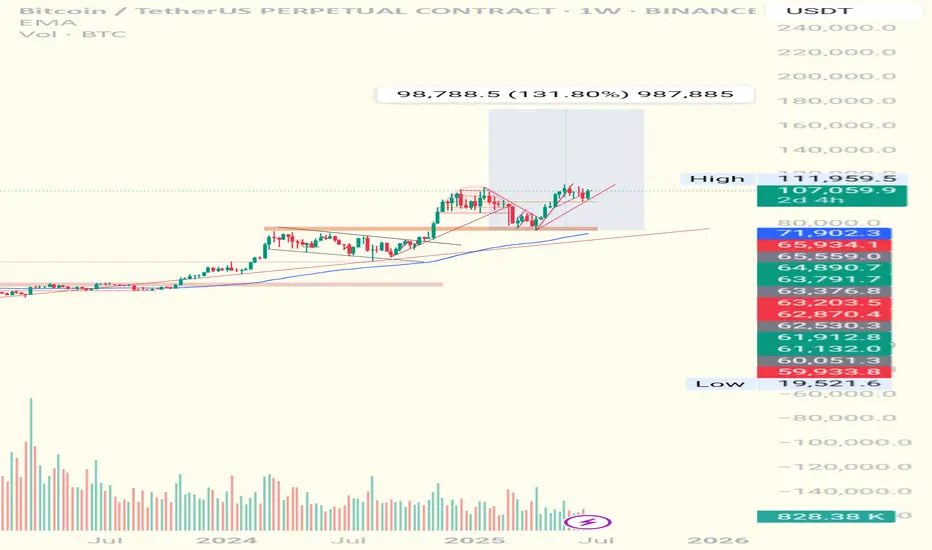
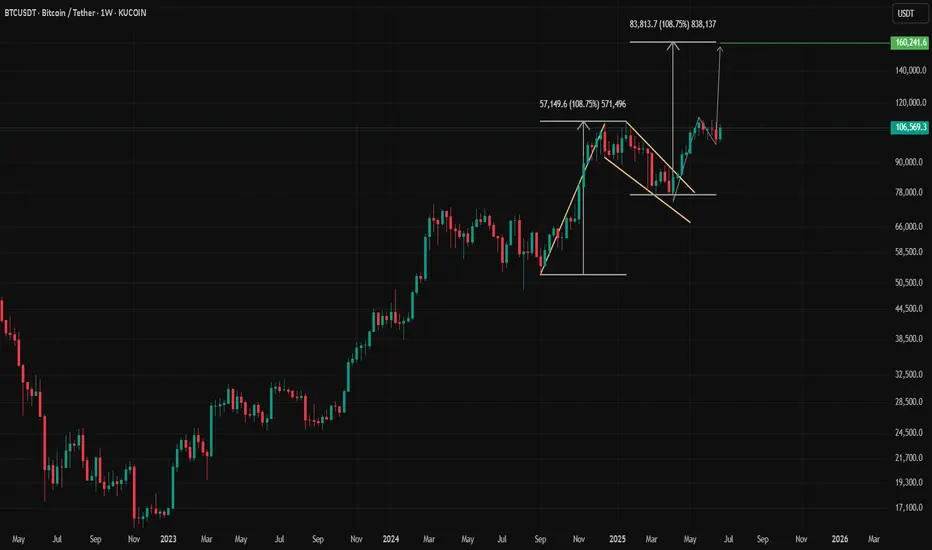
BTC 1W ideaLooks like Bitcoin is in the middle of the distribution which targets at $160k. Flag pattern.
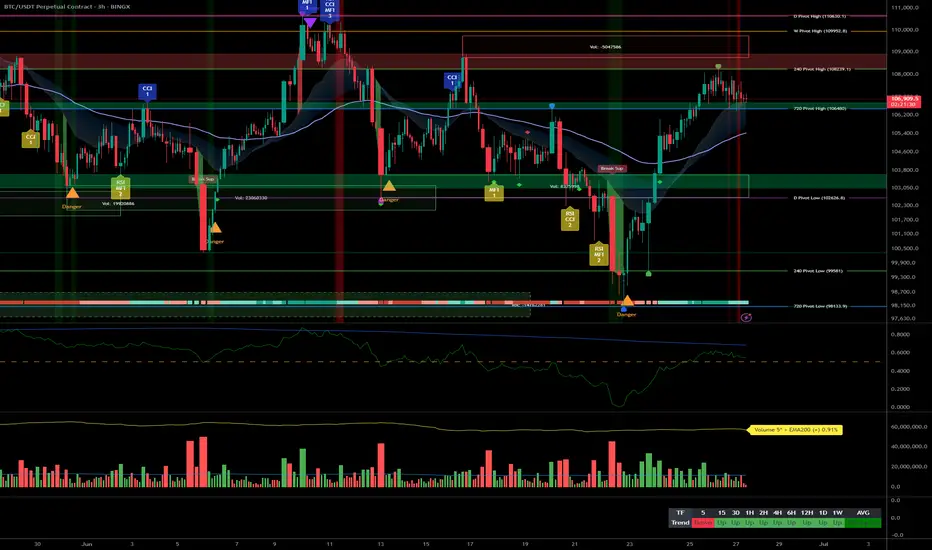
Bitcoin Controlled consolidation above 106,480 Technical Overview – Summary Points
➤ BTC trades in the 1st quartile of its yearly range (100k – 111k).
➤ Stacked resistance zone: 108,239 to 110,603 USDT → potential seller exhaustion.
➤ Key support at 106,480; defensive cluster 102,626–99,581.
➤ Risk On / Risk Off Indicator = Strong Buy; ISPD Divergence = Neutral.
➤ Normal volume, but lack of fresh capital → sustainability of rally questionable.
__________________________________________________________________________________
Strategic Summary
➤ HTF trend bullish above 106,480; breakout > 108,239 targets 109,950 / 110,600.
➤ Buy swing pullbacks on 106,480 or 104,600. Invalidation < 102,626 = drop to 99k.
➤ Tactical short scalps around 108,250–109,000.
➤ Core PCE = major catalyst (June 27).
➤ Watch spot volumes, funding, and Risk On / Risk Off signals.
__________________________________________________________________________________
Multi-Timeframe Analysis
➤ 1D : bullish bias > 106,480; danger < 102,626.
➤ 12H : bullish consolidation; confirmed breakout > 108,239.
➤ 6H : compression; buy dips 106,480 / 104,600.
➤ 4H : lateral-bullish; key support = 104,600.
➤ 2H : neutral-bullish; triggers = 107,800 / 106,000.
➤ 1H : bull flag; micro-divergence, prefer long > 106,950.
➤ 30 min : tight triangle; breakout at 107,200 / 106,650 = signal.
➤ 15 min : bearish < 106,950, expected bounce on 106,480.
__________________________________________________________________________________
Macro, News & On-Chain Analysis
➤ Macro backdrop: “Higher for longer” stance continues, no FOMC imminent.
➤ Core PCE June 27: upside surprise (2.7% YoY vs 2.6% expected) – USD supported, potential headwind for risk assets.
➤ Pacific Region: ongoing tensions in Taiwan Strait and South China Sea:
- Increased military activity: air incursions, naval maneuvers.
- High risk of escalation flagged by defense analysts & social feeds.
- Risk sentiment: volatile – sudden events could trigger risk-off.
➤ On-chain: Range 100–110k; weak spot volume; cautious leverage; no major sell-side imbalance.
__________________________________________________________________________________
Conclusion
➤ BTC maintains a controlled bullish bias > 106,480.
➤ Swing buy zones = 106,480 & 104,600; targets 109,950 / 110,600.
➤ Main risk: break < 102,626 = sell-off toward 99k.
➤ Monitor Core PCE and geopolitical risk in the Pacific region.
__________________________________________________________________________________
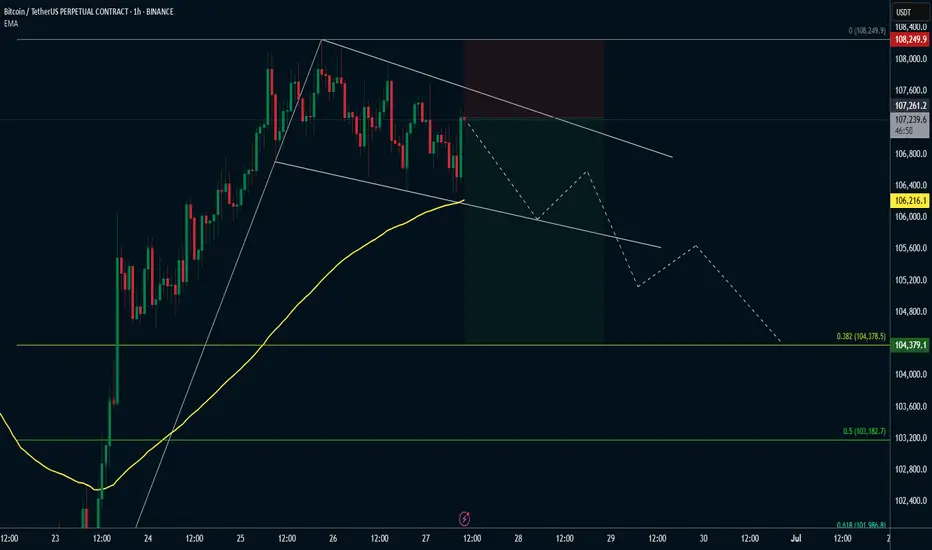
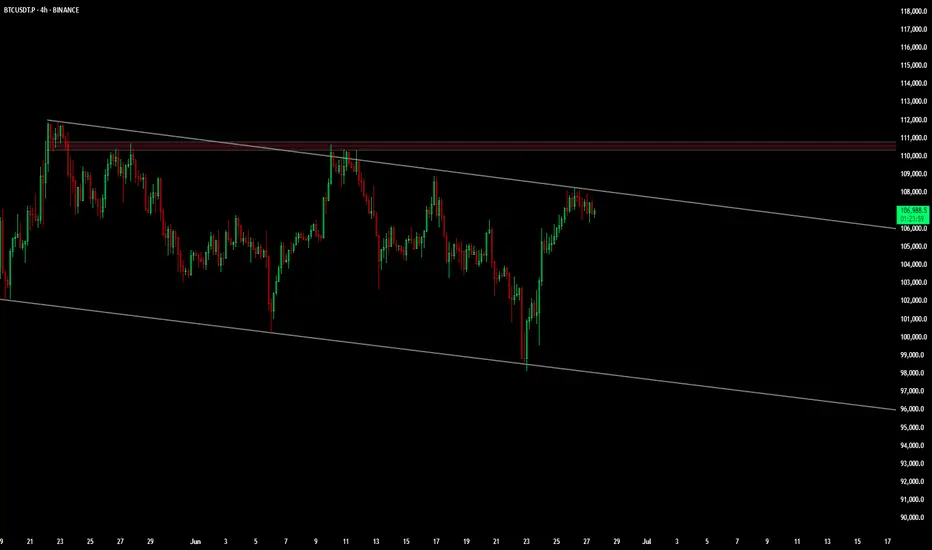
BTC 120K READY ???BTC 4H Chart Update 📉📈
Bitcoin is still trading inside a descending channel, but bulls are now testing the upper trendline for a potential breakout.
Price is consolidating just below $107K, showing strength after the recent bounce from the bottom of the channel.
🔹 Structure: Descending Channel
🔹 Current Resistance: $107K–$110K zone
🔹 Break & close above = bullish breakout confirmation
🔹 If breakout and close above 110k than this target possible
🔹 Target after breakout: $112K-120K+
⚠️ Rejection = pullback likely toward $103K–$104K support
📊 Breakout or breakdown — decision time is near!
#BTC #Bitcoin #Crypto #TechnicalAnalysis #BreakoutSetup
Called The Bottom GuysThem: "How did you call the start of the Rally?"
Me: ...
#crypto #bitcoin #trading #portfolio
Using the 6Hr CPR to take tradesUsing the 6Hr CPR to take trades on the 15 min TF. Combining with my PAR momentum indicator.

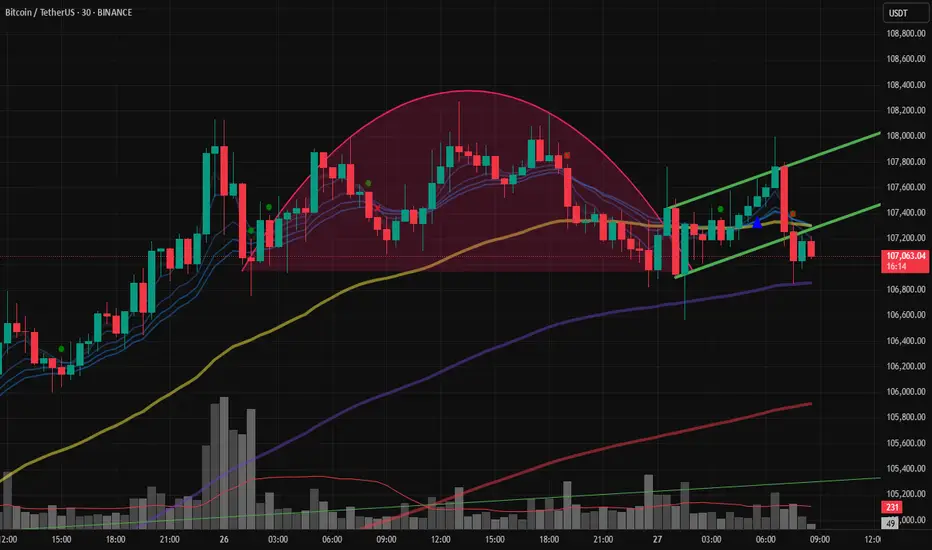
Cup and handle reversalA cup and handle is a technical chart pattern that resembles a cup and handle where the cup is in the shape of a "u" and the handle has a slight downward drift.
A cup and handle is considered a bullish signal extending an uptrend, and it is used to spot opportunities to go long.
Technical traders using this indicator should place a stop buy order slightly above the upper trendline of the handle part of the pattern.
The pattern was first described by William J. O'Neil in his 1988 classic book on technical analysis, How to Make Money in Stocks.