Markets Rally as Iran’s Strike Falls Short of Expectations🟢 Markets Rally as Iran’s Strike Falls Short of Expectations
One key point here is that global markets were bracing for a much more severe response from Iran toward the U.S. But when the actual attack turned out to be less intense than expected, risk assets — including crypto and stocks — started to climb, while oil prices dropped. Normally, heightened tensions in the Middle East would push oil prices higher, but this time, the opposite happened.
Another important factor is Bitcoin’s exchange outflows. As I’ve mentioned before, BTC leaving exchanges is a bullish sign — it means fewer coins are available to sell, which can fuel quick upward moves when a long trigger appears.
📍Wait for a clean long setup, and avoid emotional trades.
---
💬 Do you think the market is reacting rationally or emotionally right now? Drop your thoughts in the comments!
BTCUSDT.3L trade ideas
btc dirrectionnow days btc was bleeding much but to day was was recovering little as you see my last analyst it approaches the exact direction and I hope the coming days will go as I will insh Allah be ready for big bull run after it finish the last liquidity swept
A bearish trend is gradually taking shape.From a technical perspective, the complete breakdown of the box bottom, coupled with the MACD indicator about to fully crossing below the zero axis, both indicate that bullish momentum is weakening and a bearish trend is gradually forming. Short-term bulls need to take a temporary break and wait for the construction of a stabilizing platform. For bears, according to the current trend, they can lay out short positions on rallies. The ideal entry position is near the lower edge of the box, and they can try to lay out positions boldly after setting stop-losses.
On the news front, "Laote"'s policies change frequently, with extremely high uncertainty. The market needs global stability, and there has been no bull market in history built in a turbulent environment. Therefore, we need to treat market conditions cautiously, avoid blind and radical operations, and only by maintaining rationality can we respond to market changes.
you are currently struggling with losses,or are unsure which of the numerous trading strategies to follow,You have the option to join our VIP program. I will assist you and provide you with accurate trading signals, enabling you to navigate the financial markets with greater confidence and potentially achieve optimal trading results.
Trading Strategy:
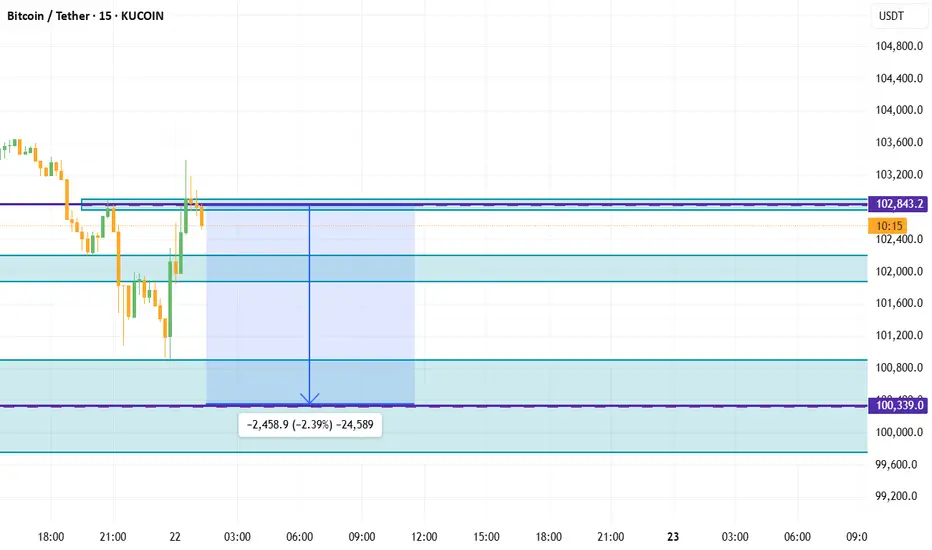
sell@102300-102800
TP:100000-100500
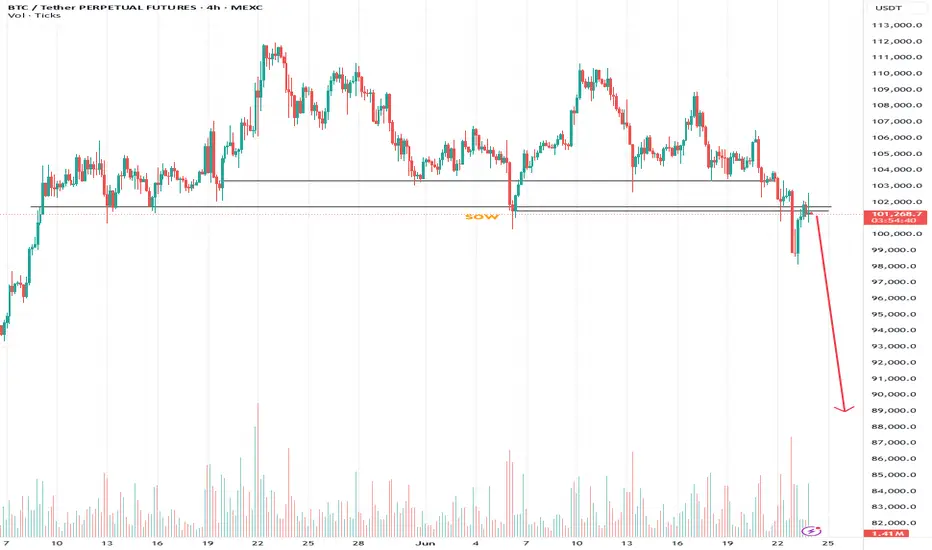
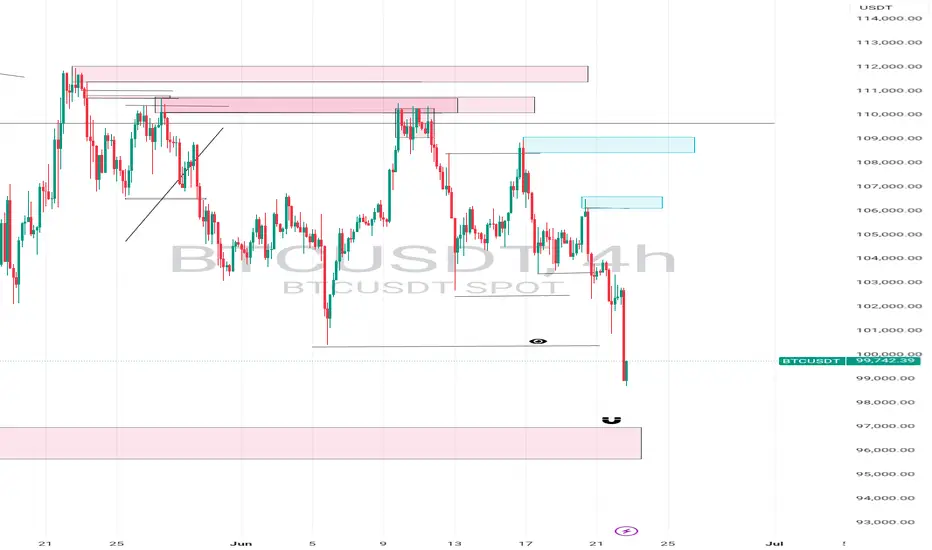
BTC comleted wykoff with retest of sowJudging by 4h analysis, BTC completed wykoff with retest of sow and is getting completely obliterated now. Get out while you can! X_X
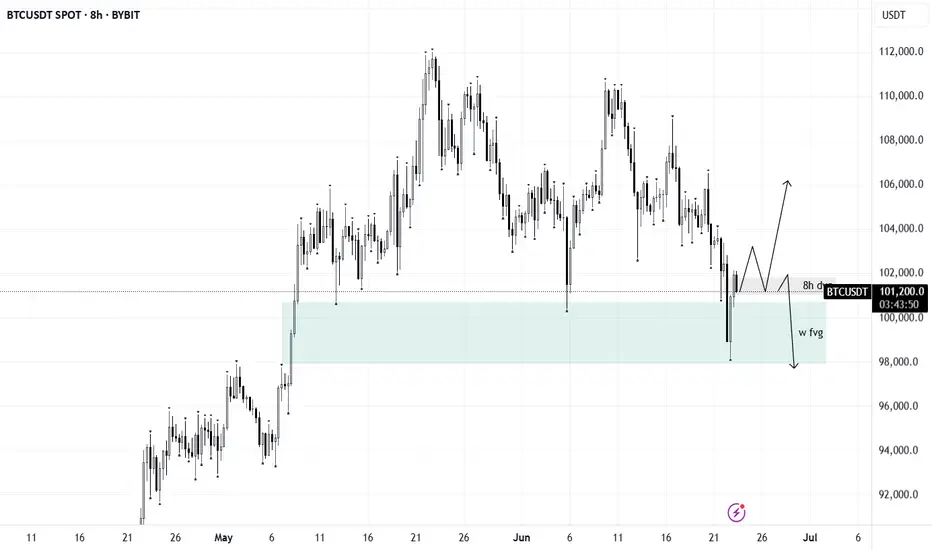
BTCBTC is currently trading within an 8H short FVG. For continued upside, a clean inversion of this zone is required.
Failure to flip this level may trigger a corrective move toward the $93K–$98K range. Monitor price action closely — confirmation is key.
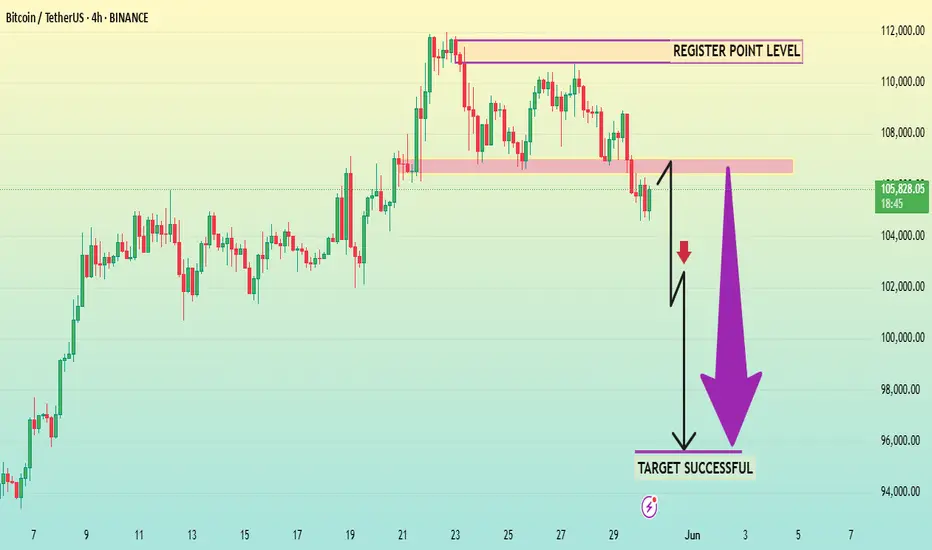
BTCUSD 4HThis chart presents a bearish setup for Bitcoin (BTC/USDT) on the 4-hour timeframe, shared by "Alpha_Gold_Trader." Here's the key breakdown:
---
Chart Breakdown
Current Price: Around $105,857
Resistance Zone (Register Point Level): ~$109,000 to ~$111,500
Support Zone (Breakout Level): ~$106,500 to ~$107,500 (pink box)
Bias: Bearish (implied by breakdown and downward projection)
Price Target: Around $95,000, labeled as "TARGET SUCCESSFUL"
---
Technical Implication
Price has broken below the support zone marked in pink.
A retest of broken support is anticipated before continuation down (common in breakout setups).
The setup suggests a short trade if price fails to reclaim the broken support and confirms rejection.
---
Trading Strategy Outline
Entry: Near $107,000 (on failed retest)
Stop Loss: Above $108,500 (back in the previous range)
Take Profit: ~$95,000 (target zone)
BTC outlook Just as analysed , Bitcoin delivered nicely , and still delivering, now we expect to see a full drop to 74k
BTC: Bias Map 22/06/25Previous Week:
BINANCE:BTCUSDT BINANCE:BTCUSDT.P
Bias:
Spot buyer within 93.5k–88k BTC zone. This is the key support region
Structure:
- Weekly fair value gap sits between 93.5k–88k
- Still trending lower, no reversal yet confirmed
- Weekly has swept previous ATH and rejected without displacement
Plan:
- Watch for Bitcoin to move into 93.5k–88k
- No trading Monday - sitting flat
- Iran’s retaliation risk still unpriced — major global risk looming
- Structure or weekly reaction will determine next steps
Macro:
- Global risk extremely elevated with increased escalation risk from a potential Iranian response
- Risk assets like crypto are broadly unattractive in this environment
- Capital preservation is still critical
A key issue I dislike about this structure is the similarities it shares with the 2021 bull run, where we swept previous ATH, failed to displace and then rejected and moved -77%
I do not think we will see a -77% move however but a scenario where this shares similar structure and we visit the 70-60s is without doubt a clear probability and one that must be acknowledged
This week will be absolutely critical to be patient and watch how the middle east situation evolves. We are heading into a potentially very dangerous and uncertain era so caution is critical

BTCUSDT – Critical Price Zone | High Probability for Price DiscoBitcoin is currently trading in a critical price zone, showing strong momentum and bullish structure. If the current trend holds, there is a high probability for a price discovery move toward the $121,000 level.
Bullish Scenario:
A sustained move above current resistance which is 110k can trigger a breakout.
Targeting $121K as the next key upside level.
Invalidation Level / Stop Loss:
A daily close below $105K will invalidate the bullish structure.
This would likely lead to a deeper correction toward the $95K–$98K support area.
trade Setup Summary:
Entry Zone: green box
Target: $121,000
Stop Loss: Daily close below $105,000
if strong daily close below 105 k will have last chance to buy btc below 0.1 Million dollar
DYOR

BTCI believe Bitcoin is heading toward the upside targets. There are two buying zones; we are currently at the first zone, with another buying zone below it. You can split your entry between these two zones."
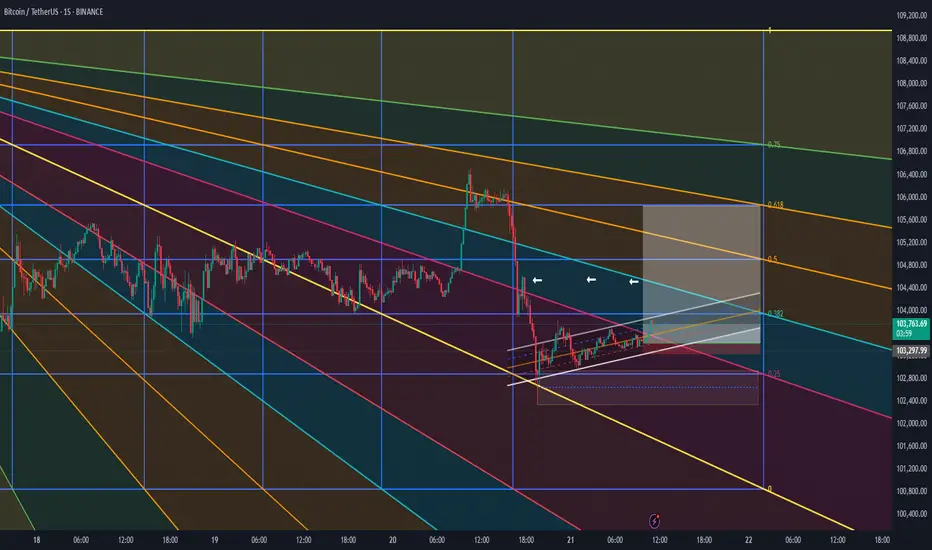
bitcoin update price broke the symmetrical triangle and moving up slow
but this false pump wont last long.
price just going to tap the fib level of 0.5 to 0.618 and might go a bit up just to trap longs.
i personally will enter short once we tap and reject 0.618.
thanks

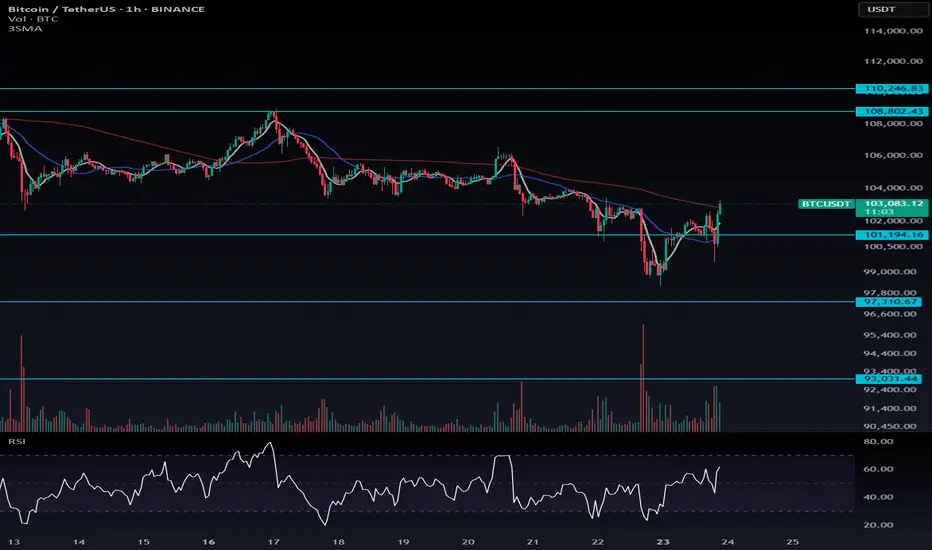
$BTC 50 EMA Analysis – Daily Timeframe Price is currently hoverCRYPTOCAP:BTC 50 EMA Analysis – Daily Timeframe
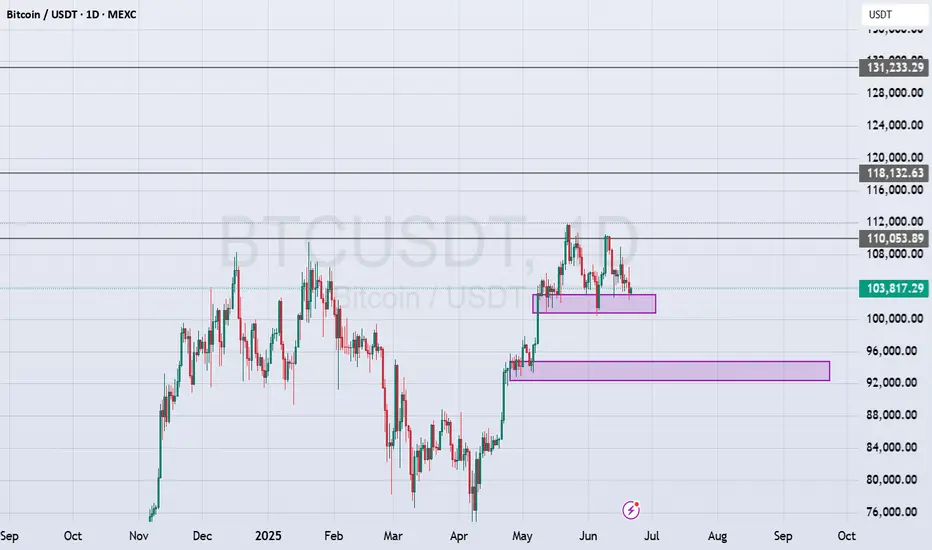
Price is currently hovering just above the 50 EMA (blue line), which sits around $103,164, while BTC trades slightly higher at $103,774. Historically, as shown by the chart, BTC has respected the 50 EMA as dynamic support in uptrends and resistance in downtrends. Recent touches on the 50 EMA have triggered bounces, indicating it's a strong technical level.
🔸 Key Support Zone at $103,000 – $102,000:
If BTC holds above this zone, continuation toward previous highs is likely.
🔸 Upside Target: $108,000 – $110,000
Should the 50 EMA act as a springboard again, BTC could retest recent highs.
🔸 Risk Level at $101,500:
A daily close below this level may invalidate the bullish structure and trigger a deeper correction.
🔸 Outlook:
Watch for confirmation of a bounce above the 50 EMA. Bullish entries can be considered on strong daily candles above the moving average with tight risk management.

BTCUSD its BTCUSD taking for buy and i will like to follow according to my setups for buy and i will explain once i see and finish loading this first image since 2020
btc short now you have a very clear view of whats gonna happen
101k is inevitable. And if 101 dosent hold, 98 will be our balance point where market will go for making lower high and if price action changes we can go for a new ATH, which i guess will be our final ATH before we drop for a fresh new bear cycle.
thanks
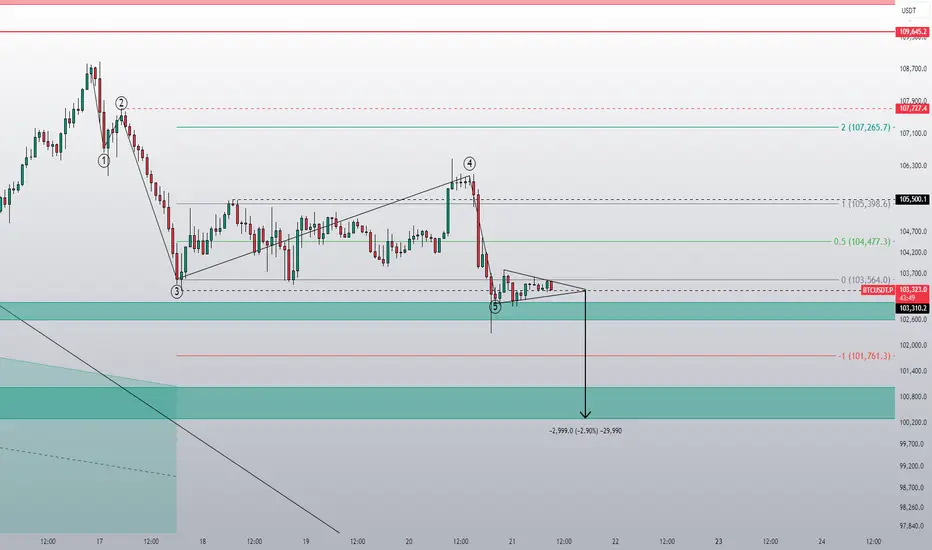
This is looking good!The liquidity at 103k has been taken and five waves have been completed. Now, we should be all set. In theory, at least.

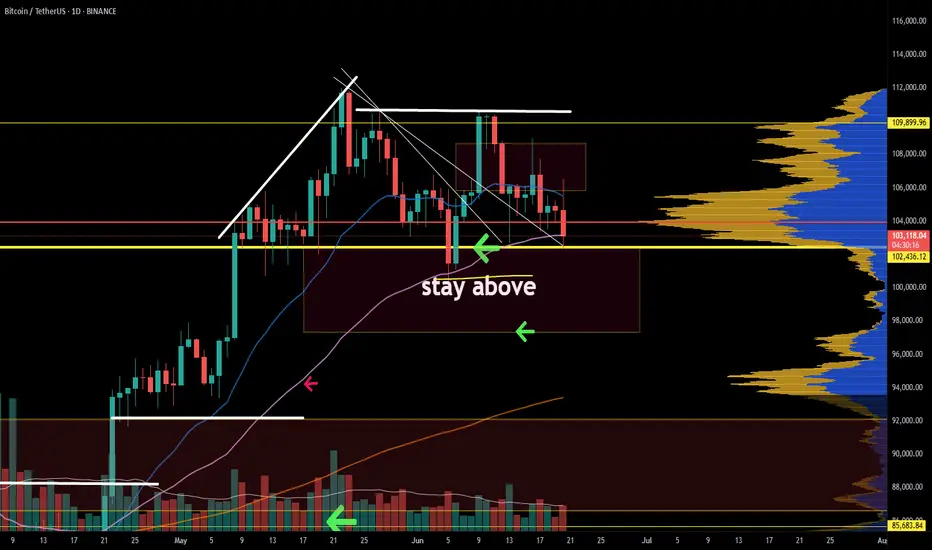
Bitcoin Holds Strong as Market Consolidates — No Bearish DivergeUpon analyzing CRYPTOCAP:BTC price structure across multiple timeframes, I don't see any bearish divergence at the moment. Instead, the chart continues to print a series of bullish formations, including inverse head and shoulders patterns, signaling continuation of the macro uptrend.
The current movement between $100,000 and $109,000 appears to be a classic case of a choppy or ranging market — in simpler terms, a bullish consolidation phase just below resistance. This kind of sideways price action, especially after a significant rally, often serves as a base for the next breakout leg.
Despite geopolitical tensions like the Iran-Israel conflict, Bitcoin remains remarkably resilient. If such macro-level risk had any real impact, BTC would likely have already broken below the $100K mark. Instead, the price is holding firm, which is another sign of strong bullish sentiment in the market.
The chart structure remains highly constructive — multiple bullish reversal and continuation patterns are playing out, and as long as BTC holds above the $98K–$100K support zone, the broader trend remains intact. This ongoing consolidation below all-time highs is a healthy sign of strength —

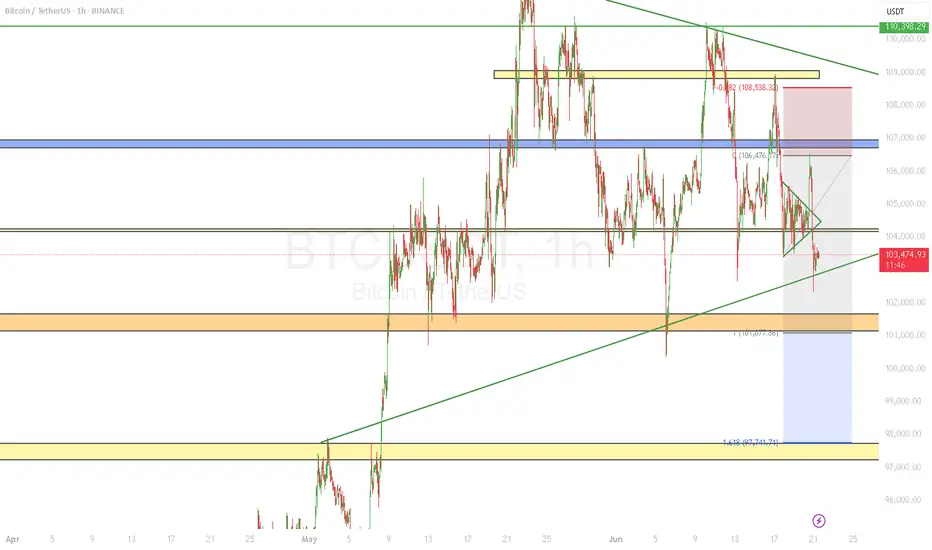
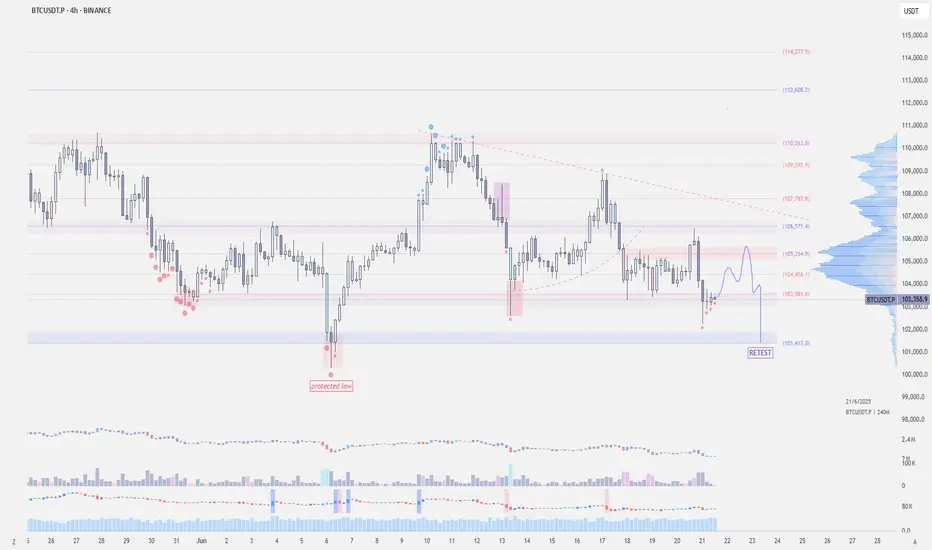
$BTC - Protected LowBINANCE:BTCUSDT | 1D
Price got strongly rejected at 106.5k
It deviated below the 4-hour mini-range. We now need to see a reclaim of 105–105.1k. If not, a retest of the value area low at 101.4k is likely.
100k remains to be the protected low, and it would be critical if we won't get a valid retest at 101.4k
local resistance: 105-105.5k
local support: 101.4k
protected low: 100k
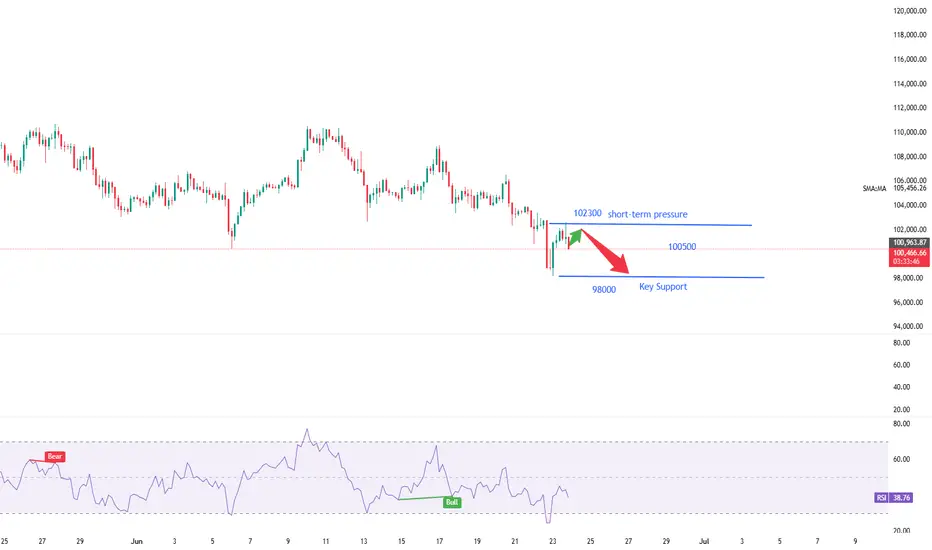
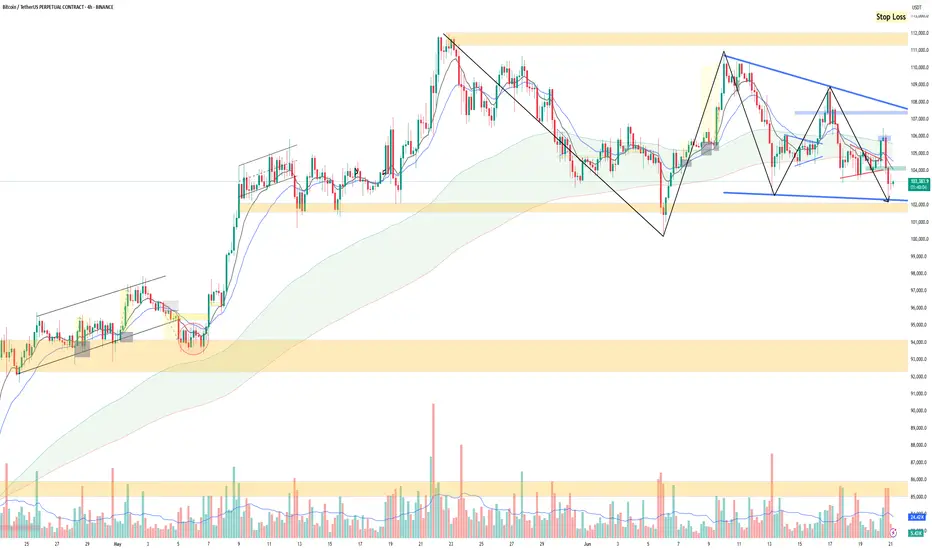
BTC Squeezed to the Edge – Will $102K Support Hold or Crack?Bitcoin is pressing into the apex of a descending triangle, anchored at $102K. Volume is drying up, EMAs are compressing, and liquidity pools sit just below. This structure rarely resolves quietly — a volatile breakout is imminent.
🔻 Bearish Case (Primary Bias):
Breakdown below $102K = short trigger
Targets: $98K → $94K
Stop: Above $106K
Confluence: Bearish pattern + volume dry-up + liquidity below
🟢 Bullish Reversal (Alternate):
Breakout above $107.5K = short squeeze likely
Flip bias only if trendline is reclaimed on volume
🎯 Final Take:
BTC is at a decision point. Don’t trade the bias — trade the breakout. Volatility is coming. Be ready.
📣 What’s your setup? Breakdown or fakeout rally? Share below!
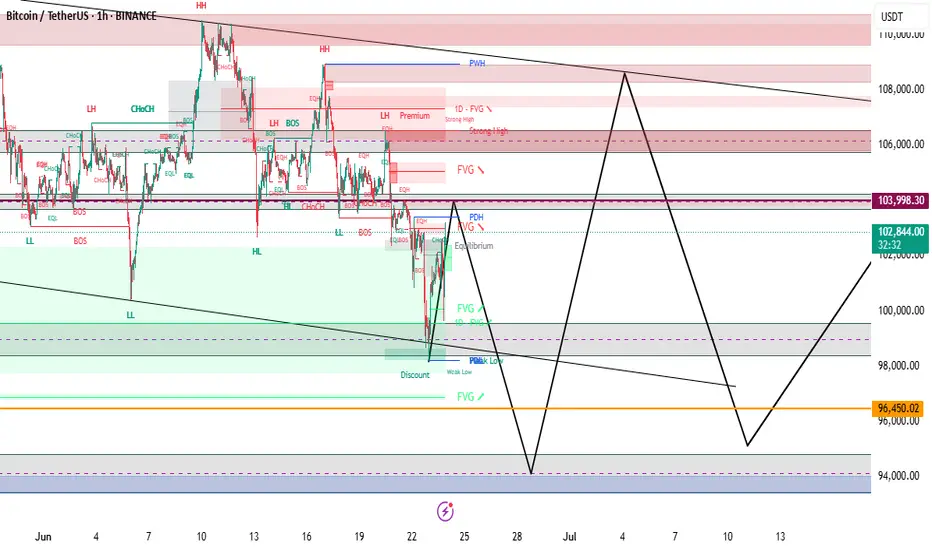
BTC has made the perfect market conditions for a trade. BTC setup is very clear. Why? Because the structure is clear. The current price is an inflection point; both bears and bulls are watching to make their next move. May the strongest of the two prevail. 95k or 110k?
Full TA: Link in the BIO
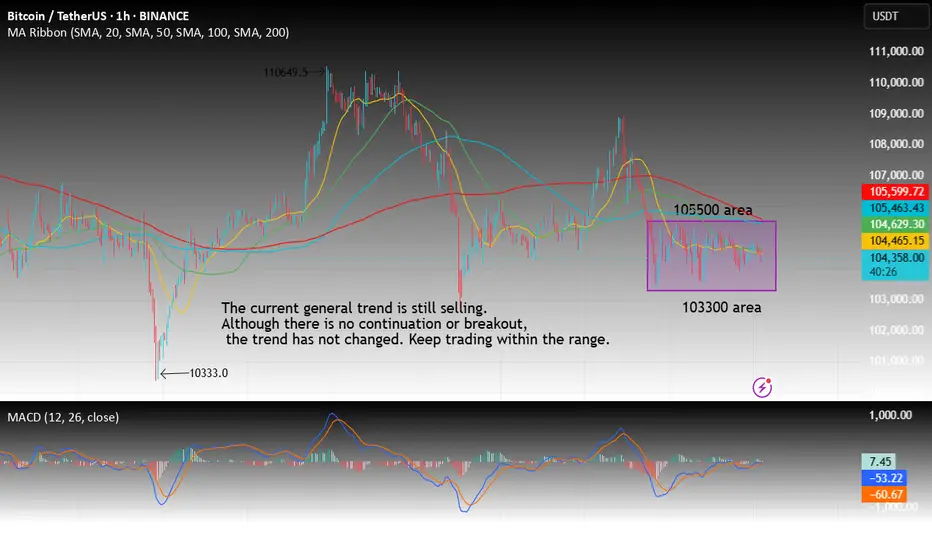
Btc seizes the opportunity to trade with the trendTechnical analysis of BTC contract on June 20:
Today, the large-cycle daily level closed with a small negative line yesterday, and the K-line pattern was a single positive line with a continuous negative line. The price was below the moving average, and the attached indicator was dead cross and running downward, but we should note that the overall volatility this week was not large, and the fluctuation was in a small range. So we should pay attention to keeping short-term trading and closing profits in time. Don't hesitate, drag, and don't think about a big rise or fall. After a large drop on Tuesday this week, the short-term hourly chart has entered a small range of fluctuations. There is no continuation or breakout, so we should just follow the trend. We have sold at the high point of 105,500 as a defense, and bought at 103,000 as a defense, for short-term trading.
$BTC Probable scenarios.I think the chart speaks for itself. Technical targets for both RSI and Price Actions are noted in the chart.
