BTC has made the perfect market conditions for a trade. BTC setup is very clear. Why? Because the structure is clear. The current price is an inflection point; both bears and bulls are watching to make their next move. May the strongest of the two prevail. 95k or 110k?
Full TA: Link in the BIO
BTCUSDT.3L trade ideas
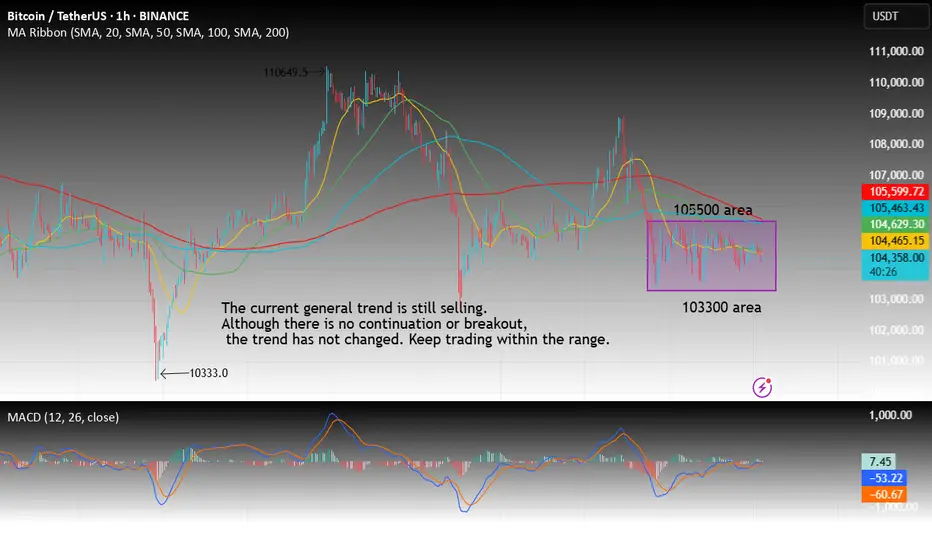
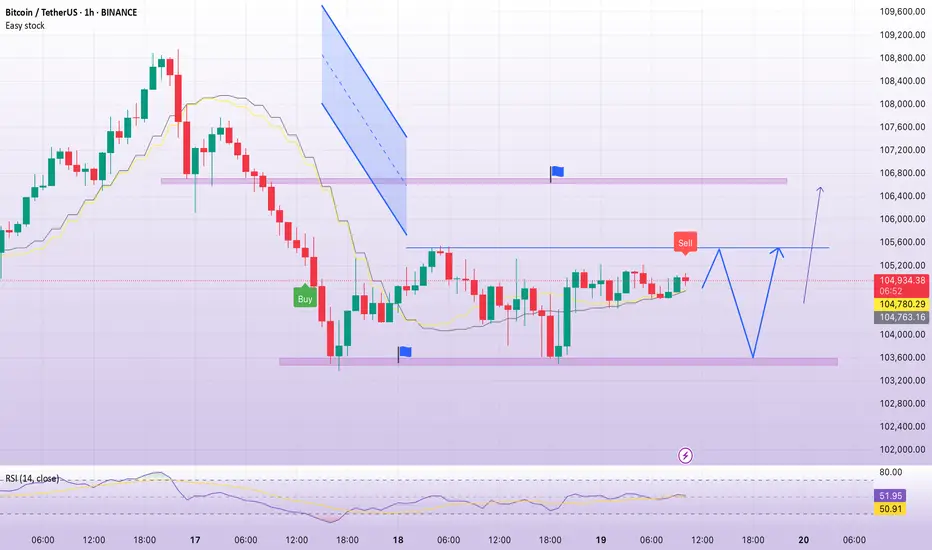
Btc seizes the opportunity to trade with the trendTechnical analysis of BTC contract on June 20:
Today, the large-cycle daily level closed with a small negative line yesterday, and the K-line pattern was a single positive line with a continuous negative line. The price was below the moving average, and the attached indicator was dead cross and running downward, but we should note that the overall volatility this week was not large, and the fluctuation was in a small range. So we should pay attention to keeping short-term trading and closing profits in time. Don't hesitate, drag, and don't think about a big rise or fall. After a large drop on Tuesday this week, the short-term hourly chart has entered a small range of fluctuations. There is no continuation or breakout, so we should just follow the trend. We have sold at the high point of 105,500 as a defense, and bought at 103,000 as a defense, for short-term trading.
$BTC Probable scenarios.I think the chart speaks for itself. Technical targets for both RSI and Price Actions are noted in the chart.

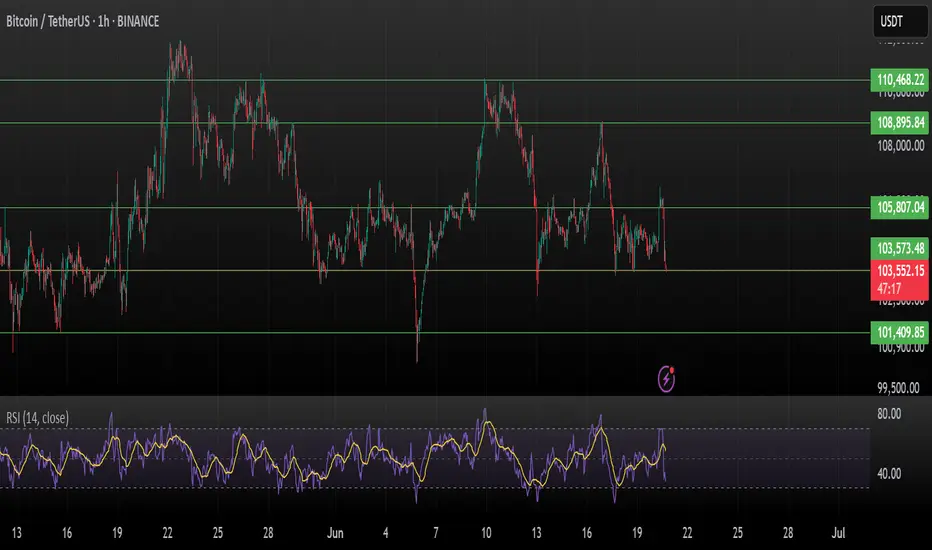
BTC Testing Crucial Support – Breakdown or Bounce ?Bitcoin is currently testing a critical support zone around $103,573 – a break below could trigger a sharper move toward $101,400.
Price rejected from ~$105.8K
Support holding... for now
RSI dropping fast – now near 34 (1H TF)
Weakening momentum visible
This level is the last line of defense for bulls. If it cracks, expect volatility.
Watch closely. Break = panic or buying opportunity?
DYOR. Not Financial Advice.
BTC- Bounce here or 93K incomingWhatever WTI does.. will determine what the Stock Market does.... which will determine what BTC does.. which will determine what all of Crypto does..
BTC/USDT Technical Analysis, 2025-06-18 09:45 UTC📘 BTC/USDT Scalping Setup – Whale-Assisted Dip Buy
This strategy is designed for high-precision, short-term long trades on BTC/USDT using the 15-minute chart. It targets oversold conditions with signs of reversal, confirmed by whale activity, volume spikes, and key support levels.
The edge comes from combining retail technicals (RSI, Stoch, MACD, candlestick patterns) with institutional confirmation (order flow, OBV, and large bids from whales).
✅ Key Strategy Components:
Oversold Technicals: RSI and Stochastic suggest price exhaustion.
Support Zone Alignment: Price is dipping near major support (pivot S1 or local low).
Reversal Candlestick: Clean bullish signals like Hammer or Engulfing show shift in sentiment.
Smart Money Confirmation:
Whale buyers (>5 BTC bids)
Bid dominance (>3%)
OBV rising = silent accumulation
Timing is Critical: Trades are only taken in the first 2 minutes of the 5-min candle with a volume burst.
🎯 Trade Management
Entry: On close of confirming candle (when all criteria align)
Take Profit: +1.2% (or ~1200 pts)
Stop Loss: -0.6% (or ~600 pts)
Risk/Reward: 1:2
📈 Why This Works
This is not just a basic RSI/Stochastic play — it’s a multi-confirmation strategy tuned for whale detection, volume acceleration, and institutional footprints. It’s ideal for high-volatility sessions and works best in range or retracement phases of a broader uptrend.
⚠️ Pro Tips
Avoid entries during extreme news volatility
Be disciplined – all filters must align (this is a precision setup)

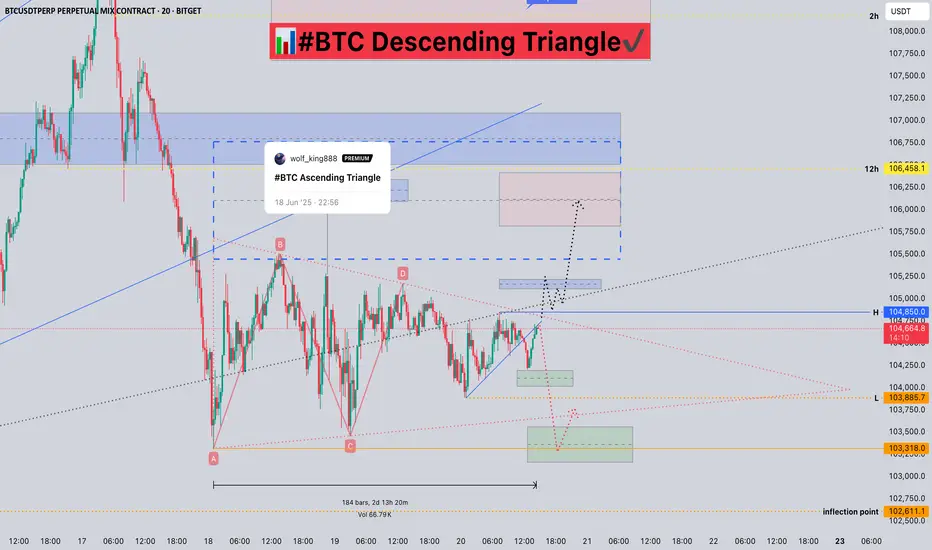
#BTC Descending Triangle📊#BTC Descending Triangle✔️
🧠From the perspective of the chart, we have been sideways here for about three days, and the price is gradually being squeezed to form a descending triangle. Generally, we regard this model as a model that continues the original trend force (the trend at the hour level is a downward trend).
➡️A similar model analysis was also made in the previous article. Because the closing price at the 4h level is already below the lower edge of the triangle, I think the probability of further decline will be higher, so please be cautious in chasing the rise!
⚠️Note that if we break through the H point and stabilize, it means that my view is wrong.
🤜If you like my analysis, please like 💖 and share 💬 BITGET:BTCUSDT.P
BTC is squeezing between descending resistance.📊 BTC/USDT – 1H Chart Analysis: The Calm Before the Storm?
Bitcoin is currently coiling within a symmetrical triangle on the 1-hour chart – a technical pattern that often signals a strong breakout is just around the corner. The market is compressing, and momentum is building.
🔍 Key Levels to Watch:
🔹 Symmetrical Triangle:
BTC is squeezing between descending resistance and ascending support. This equilibrium usually doesn’t last long – expect a sharp move soon.
🔹 Demand Zone ($$$ / BPR):
A solid floor is forming near the BPR (Bullish Price Range), signaling potential buyer interest and liquidity resting just below.
🔹 Fair Value Gap (FVG):
To the upside, BTC is facing a liquidity pocket (FVG) that could act as a magnet if bulls take control.
⚡ Potential Scenarios:
📈 Bullish Breakout: A break and close above the triangle could trigger a rally towards the $105K–$106K zone. Watch for volume to confirm!
📉 Bearish Breakdown: Losing the lower trendline support might send BTC into a deeper correction toward previous demand zones.
🧠 Final Thoughts:
We're approaching a critical inflection point. The triangle is narrowing, and Wednesday, June 25 could be the date the market decides. Both bulls and bears should prepare for volatility.
🚨 As always: This is not financial advice.
🧠 DYOR – Do Your Own Research.
Manage risk. Trade smart. Stay sharp. 💹

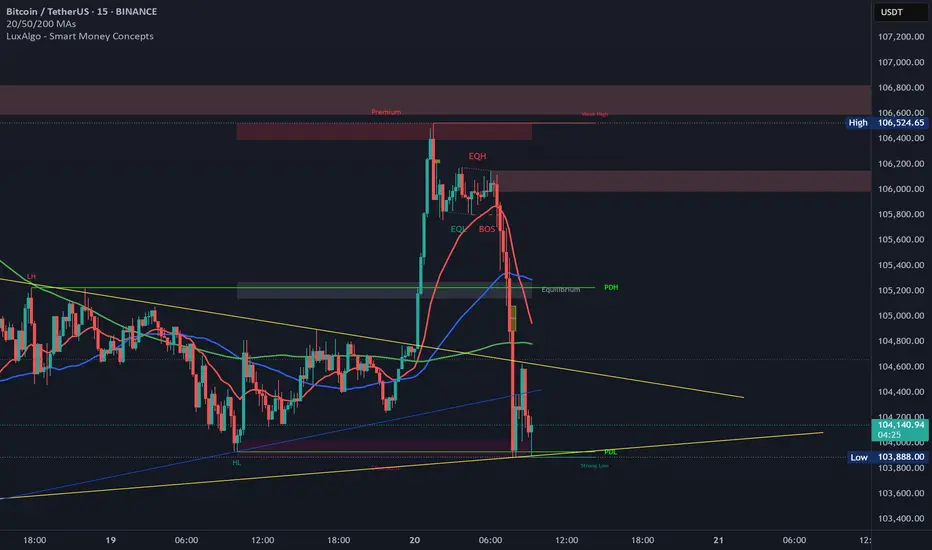
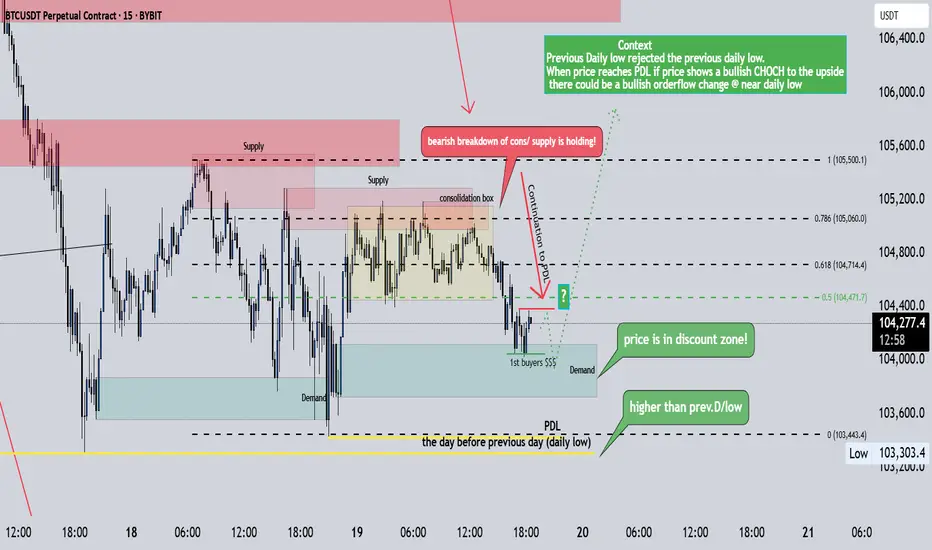
Upon reaching PDL price
Previous Day rejected the previous day's low.
When price reaches PDL if price shows a bullish CHOCH to the upside
there could be a bullish orderflow change @ near previous day low's
Could be a good long entry towards previous day high

ABC or 12345Just a little deeper to finish the wave count and we're all set. If it stays an ABC, it could mean an expanded flat correction, which wouldn't be good since it would mean we'd go deeper later.

BTC RESPECTING THIS BOXESLast time we had great btc trade
This time play this boxes with good risk management
Possible outcome for $BTCBitcoin Price Analysis: Signs Pointing to a Potential Downtrend
The chart above illustrates a detailed analysis of BTCUSDT (Bitcoin paired with USDT) using Elliott Wave theory and key support/resistance levels. After what appears to be a completed 5-wave bullish cycle, the technical outlook suggests that Bitcoin may be poised for a significant downside correction.
Completion of the Elliott Wave Structure
The chart marks the completion of five distinct waves:
Wave (1) initiated the bullish trend.
Wave (2) represented the first significant pullback.
Wave (3) delivered a strong upward surge, surpassing previous highs.
Wave (4) brought another retracement, finding support near a previous resistance zone.
Wave (5) capped off the structure, reaching above the $100,000 mark before exhibiting signs of exhaustion.
According to Elliott Wave theory, a 5-wave impulse is typically followed by a corrective ABC pattern. The chart suggests that this correction is now underway.
But I think it is trying to create a double top pattern.
Key Levels to Watch
Highlighted on the chart are several crucial horizontal zones:
Near-term resistance: Around $109,600 – $112,000. Bitcoin struggled to maintain momentum above this area and has since started declining.
First major support zone: Around $75,000 – $80,000. This was a former resistance zone during Wave (3) and may now act as support during the early stages of the correction.
Critical support levels: Marked at $54,019, $50,000, and $46,877.5. A break below these levels would indicate a deeper corrective move, potentially aligning with the projected path shown on the chart.
Trendline Break and Bearish Outlook
The yellow upward trendline that supported the entire rally is at risk of being decisively broken. The chart projection shows Bitcoin slicing through this trendline, signaling a shift from a bullish to bearish market structure. If this occurs, it could lead to accelerated selling pressure as confidence in the uptrend erodes.
Projected Price Path
The white arrows in the image depict a scenario where Bitcoin could fall to around $54,000 and possibly as low as the $46,000 region if key supports give way. This represents a significant correction, but one that aligns with historical post-impulse patterns seen in previous Bitcoin cycles.
Conclusion
While Bitcoin has enjoyed an impressive rally culminating above the $100,000 level, technical indicators on this chart point to the increasing likelihood of a sustained downward correction. Traders and investors should monitor the key support levels closely and be prepared for heightened volatility as the market seeks a new equilibrium following this extended bull run.


Bitcoin Ready For Fall Check my levels Hello trader's
Here is the chart level of bitcoin for selling...
So if you want to Know about intrday levels
Comment...

BTC/USD – Price Rejected at ATH | Key Support in PlaY Bitcoin recently reached a new all-time high at $111,942, but the daily candle closed lower around $109,550, signaling a potential rejection.
On the 1D timeframe, we are now watching the $100,725 level closely. A confirmed break below this support would be a strong signal to consider short positions.
Until then, BTC may consolidate or attempt another push higher. Patience is key here — wait for confirmation.
📌 Key levels:
• Resistance: $111,942 (ATH)
• Support: $100,725 (critical break level)
🧠 Trade safe, manage risk, and follow for more analysis.

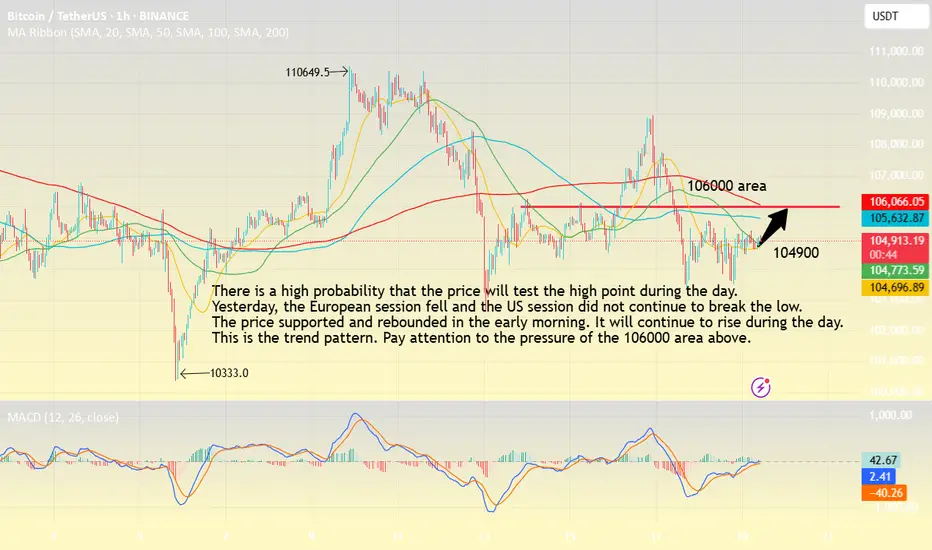
BTC-----Buy around 104900, target 106000 areaTechnical analysis of BTC contract on June 19:
Today, the large-cycle daily level closed with a small positive line yesterday, the K-line pattern was a single positive line with continuous negative lines, the price was below the moving average, and the attached indicator was dead cross. The general trend of the decline was still relatively obvious, but in trading, we should pay more attention to the rhythm of the price range in the shock, so the operation should be decisive, not greedy, and do a good job of risk control; the short-cycle hourly chart yesterday's intraday support was corrected upward, the European session fell but did not continue to break down, the price support rebounded in the early morning, the current K-line pattern was a single positive line with continuous positive lines, and the attached indicator was golden cross, so it is highly likely to break through yesterday's high of 105500 area within the day.
Today's BTC short-term contract trading strategy:
Buy at the current price of 104900 area, stop loss at 104000 area, and target 106000 area;
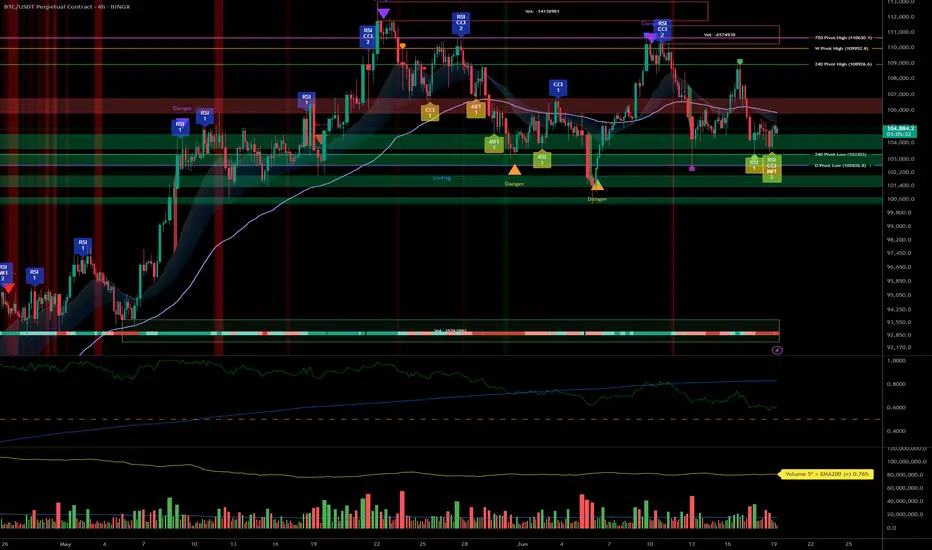
BTC – Bullish bias under review: 102k/103k supports in focus__________________________________________________________________________________
Technical Overview – Summary Points
__________________________________________________________________________________
Momentum : Dominant on all major timeframes (1D, 12H, 6H, 4H). Risk On / Risk Off Indicator signals STRONG BUY except on 15min (neutral).
Support/Resistance : Structurally key pivot zone 102k–106k; major supports 102k/103k. Potential breakout above 106k (swing target 109k).
Volumes : Normal across all timeframes. No excess signals, no accumulation/capitulation peaks.
Multi-TF Behaviors : Horizontal consolidation with bullish dominance. Short-term bearish divergence on 2H–15min, micro-TF in correction only, no panic.
__________________________________________________________________________________
Strategic Summary
__________________________________________________________________________________
Global Bias : Solid bullish structure as long as 102k/103k hold. “Risk On” maintained by sector outperformance.
Opportunities : Entries on pullback/main base 103k–104k; breakouts to watch above 106k.
Risk Zones : Clear invalidation <102k, potential rapid flush to 97k–88k; keep strict stop-loss below 102.5k.
Macro Catalysts : FOMC, Fed projections, Middle East geopolitics keep volatility high, but no shock. Price action leads near-term strategy.
Action Plan : Swing buy on confirmed support, dynamic hedge post-news, monitor volumes/closures on key pivots.
__________________________________________________________________________________
Multi-Timeframe Analysis
__________________________________________________________________________________
1D : Bullish momentum, major supports intact (102k/105k). Risk On / Risk Off Indicator = STRONG BUY, stable volume, no excess. Healthy structure for long swings.
12H : Positive bias, range 102.6k–106k. Risk On / Risk Off Indicator = STRONG BUY.
6H : Presumed accumulation 103k–106k, momentum still strong. No volume weakness.
4H : Range oscillation, structural support test at 103k. Sector outperformance, neutral volume.
2H : First sign of short-term weakness. Divergent with higher TFs but no panic.
1H : Technical rebound towards 104.8k possible as long as 103k support holds.
30min : Short-term trend remains bearish (trend 30min = down). Correction/purge ongoing.
15min : Neutral momentum, supports being tested. No panic or melt-down observed.
Summary : Strong bullish confluence on higher TFs, temporary divergence on micro-TFs. “Range with bullish bias” scenario as long as 102k/103k holds the structure.
__________________________________________________________________________________
Macro and Fundamental Analysis
__________________________________________________________________________________
FED/FOMC (June 18) : Rates unchanged, “data dependent” guidance. Raised volatility but no risk-off shift.
Market Sentiment : BTC technical structure holds, moderate post-FOMC volatility.
S&P500 : Above all key moving averages. Sector momentum (software, uranium, semis) remains dominant.
Energy Level : Weak oil = little macro pressure against BTC.
Geopolitics : Israel–Iran escalation / US posture reinforced. High FX/oil volatility but BTC resilient (>102k), no panic on record.
Economic Calendar : Closely watching BoE & SNB, but low BTC impact odds.
Implications : Post-news phase = ideal for range trading, no rupture event expected within 48h.
__________________________________________________________________________________
Strategic synthesis & R/R guidance
__________________________________________________________________________________
Long on pullback 103–104k, swing targets 106/109k. Optimal R/R (>2.5) if stop 102.5k (D Pivot Low).
Invalidation area : Clean close <102k or heavy downside volume (capitulation via ISPD/volumes).
Risk Management : Dynamic stops, partial hedge post-FOMC during macro volatility.
Conclusion : Bullish structure preserved. Range trading scenario dominant, no extreme signals or panic. Actions: support watch, technical buy on confirmed pullback.
BTC continues to accumulate above 103,500Plan BTC today: 19 June 2025
Related Information:!!!
Bitcoin (BTC) price edges slightly higher, trading near $104,700 at the time of writing on Thursday, after stabilizing above a key level — the 50-day Exponential Moving Average (EMA) at $103,100. A breach below this level could trigger a sharp fall in BTC. Risk aversion could intensify, as reports indicate that US officials are preparing for a strike on Iran in the coming days. Despite this risk-off sentiment in global markets, institutional demand remains strong, with US spot Bitcoin Exchange Traded Funds (ETFs) seeing positive inflows for eight consecutive days
personal opinion:!!!
btc continues to accumulate above 103,500, the market is no longer sensitive to interest rate information yesterday
Important price zone to consider :!!!
support zone : 103.500 \ 101.000
Sustainable trading to beat the market
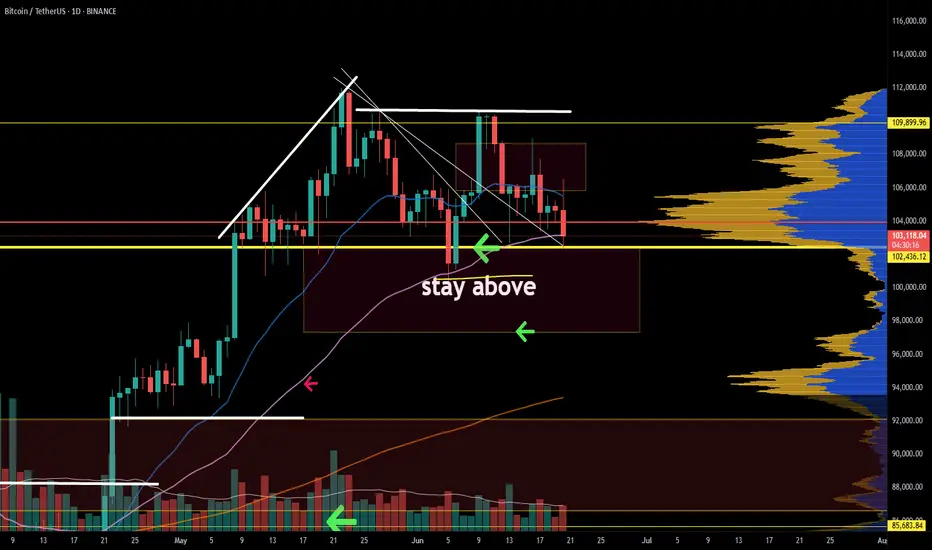
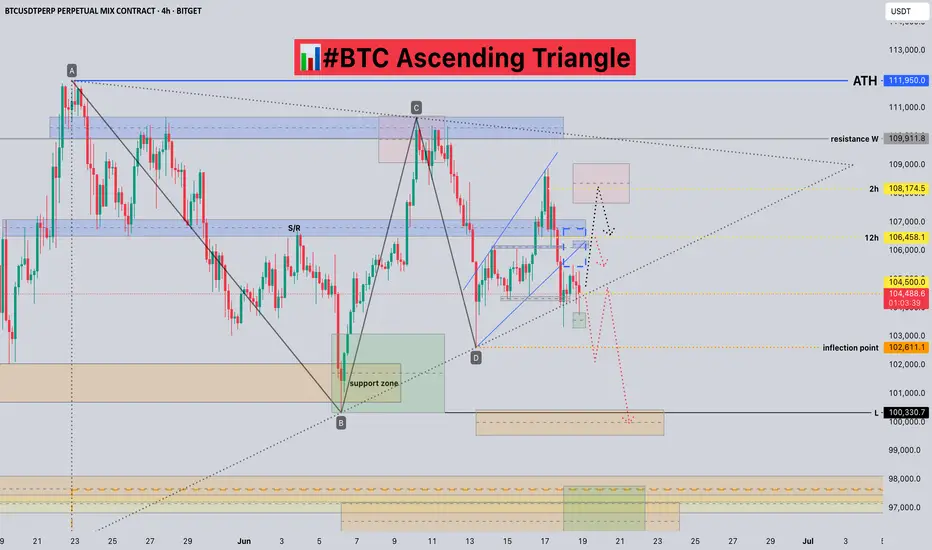
#BTC Ascending Triangle📊#BTC Ascending Triangle
🧠From a structural perspective, the daily upward trend has ended, which means that the correction expectation at the daily level has always existed, so we need to be alert to this possibility and do a good job of risk management. At present, there is no short structure, so if you want to participate in short trading, you need to look for opportunities in the heavy resistance area (106500-108200).
➡️From a graphical perspective, we have been sideways for nearly a month, and the price is gradually being squeezed to form an ascending triangle. At present, the price shows signs of stabilization at the lower edge of the triangle, and we need to be alert to the risk of rebound. Only when the closing price at the 4h level is lower than the lower edge of the triangle or the price falls below the inflection point of 102611, can we think that the market direction has chosen to go down.
⚠️Note that there will be a Fed interest rate decision and geopolitical negotiations in the Middle East today, and the market may fluctuate violently, so be sure to do a good job of risk management.
Let's take a look👀
🤜If you like my analysis, please like💖 and share💬 BITGET:BTCUSDT.P
Volume spikes on down moves add to selling pressure.📉 BTCUSDT – 1H Chart Technical Outlook
🔍 Structure Insight:
Bitcoin is currently trading within a descending channel, forming lower highs and lower lows, indicating persistent bearish pressure. Price action appears compressed between key trendlines, hinting at an imminent breakout.
---
🔻 Scenario 1: Bearish Breakdown (Primary Bias)
If BTC fails to hold above the lower boundary of the range, a decisive break below could trigger a sharp move toward the 103,650–103,000 demand zone. The structure supports continuation to the downside if the price rejects resistance again.
🧊 Bearish Confluence:
Price is unable to break above dynamic resistance.
Momentum remains weak near the mid-range.
Volume spikes on down moves add to selling pressure.
---
🔼 Scenario 2: Bullish Breakout (Alternative View)
A breakout above the descending trendline and confirmation candle could flip bias short-term bullish. This would target the 105,400+ region as the next liquidity area.
⚡ Bullish Signs to Watch:
Break and retest above trendline resistance.
Bullish engulfing or breakout candle with volume.
---
🔍 Key Levels to Monitor
Support: 103,650 / 103,000
Resistance: 105,000 / 105,400
Breakout Zones: Watch for clean breaks and retests outside the wedge pattern.
---
📌 Conclusion:
BTC is coiling within a tightening range. The breakout direction will likely dictate the next short-term trend. Maintain flexibility — breakout confirmation is key before positioning.
🚨 Not financial advice — always DYOR before trading!

Bitcoin buy ideaBitcoin (BTCUSD) had a challenging week of consolidation, but it remains stable above $100,000 despite losing some weekly gains. On the 4-hour chart, demand is holding above $102,000. With the Fed maintaining interest rates at 4.50%, if Bitcoin consolidates above $102,000-$103,000, we could see short-to-mid-term growth towards $106,000-$110,000.

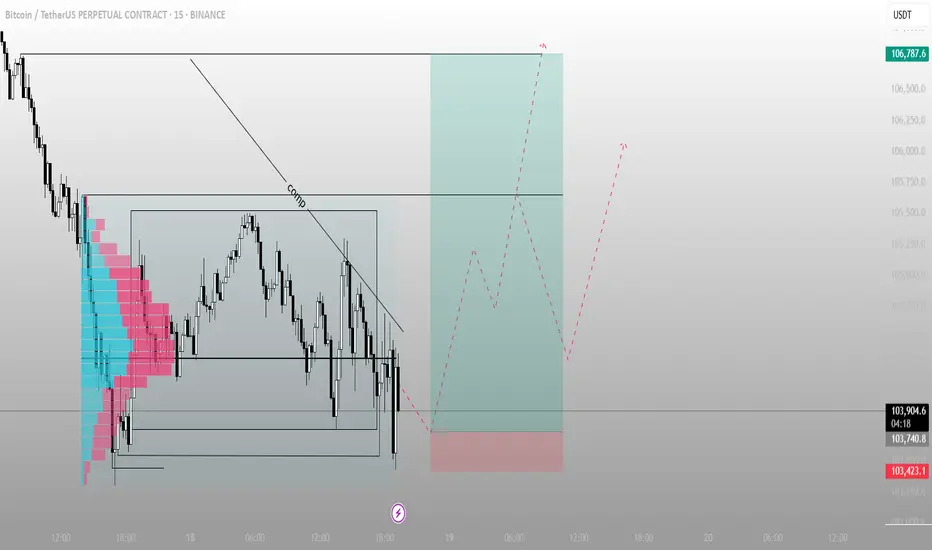
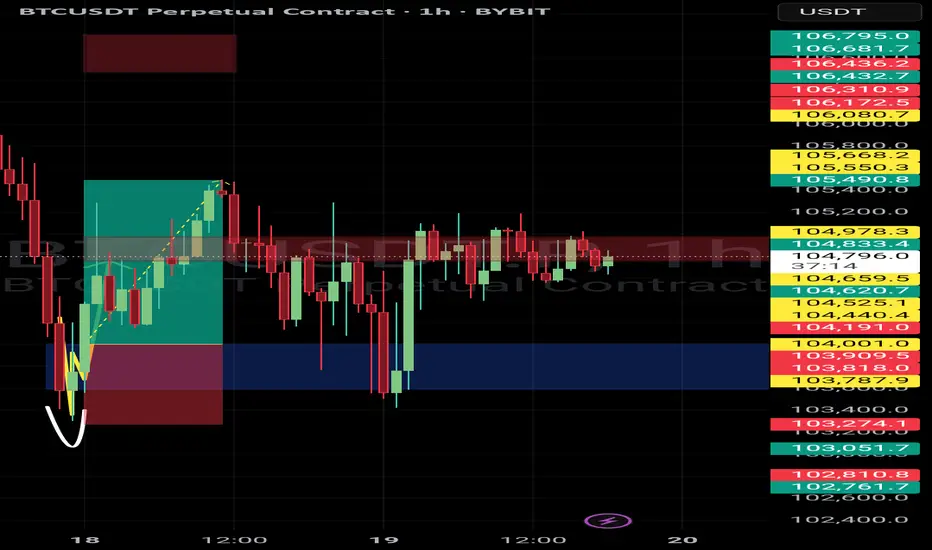
BTC – Stop Hunt at the Edge of ValueThis is what a liquidity raid looks like.
Price just swept the bottom of the range, tapped into the low-volume zone (as seen on the volume profile), and reclaimed — classic sign of a trap sprung.
Key points:
The downtrend line labeled “comp” = compression — bulls forced to capitulate into a thin zone
High probability deviation with stop run and reclaim — this fuels the next move up
The green box shows risk-defined entry off the sweep low
Targeting the prior high: 106,787
Volume imbalance filled = no inefficiency above — price can now move cleanly
Execution mindset:
Trap spring → retrace into structure → expansion
Risk is clear, liquidity is engineered, structure remains
Late shorts just became the fuel.
Watch the reclaim of the box top. If that flips support, we ride momentum.
📈 For more setups like this — including pre-breakout traps — check the description in the profile.