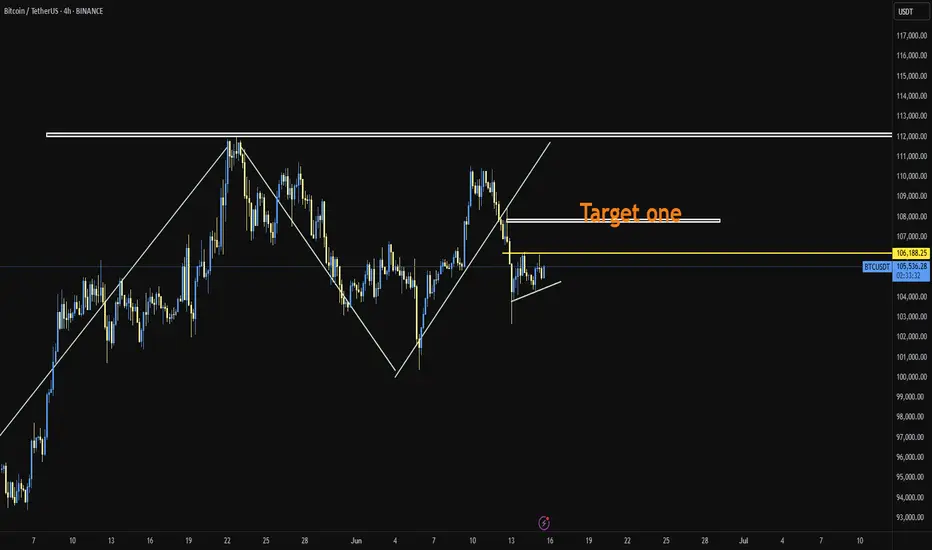
BTC/USDTWhenever Bitcoin goes above 106k, we can enter a long position at the target I specified on the chart. What do you think? Tell me.
BTCUSDT.3L trade ideas
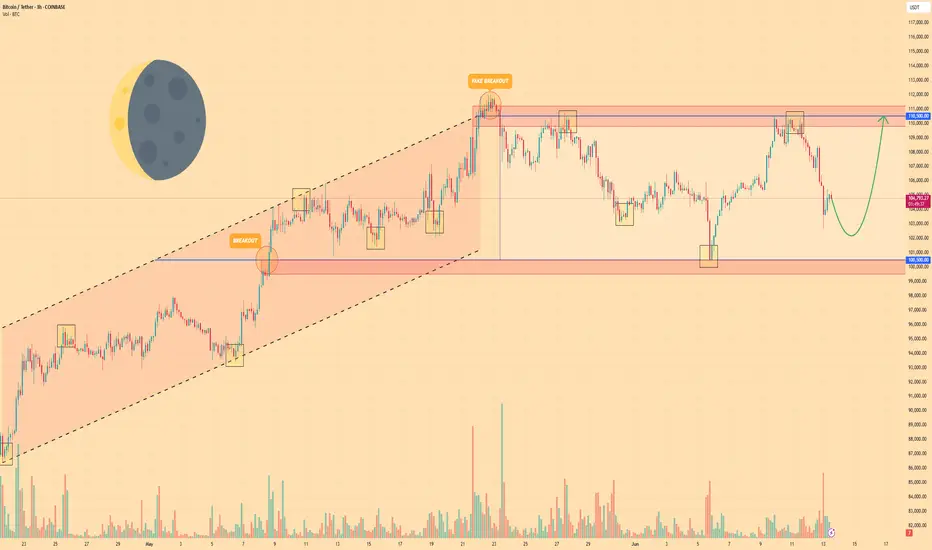
BITCOIN - Price can fall a little and start to move upHi guys, this is my overview for BTCUSDT, feel free to check it and write your feedback in comments👊
Price entered to rising channel, where at once bounced from support line and rose a little, and then corrected.
Next, price continued to move up and soon reached $100500 level, after which broke it and rose to resistance line.
After this movement, BTC corrected and continued to grow in rising channel and later reached $110500 level.
Bitcoin exited from rising channel, made a fake breakout of resistance level, and started to trades inside flat.
In flat, price tried to grow but failed and fell to support level and then grew back again, after which started to decline.
Now, I expect that BTC can repeat as move before, it falls a little and then grows to $110500 resistance level.
If this post is useful to you, you can support me with like/boost and advice in comments❤️
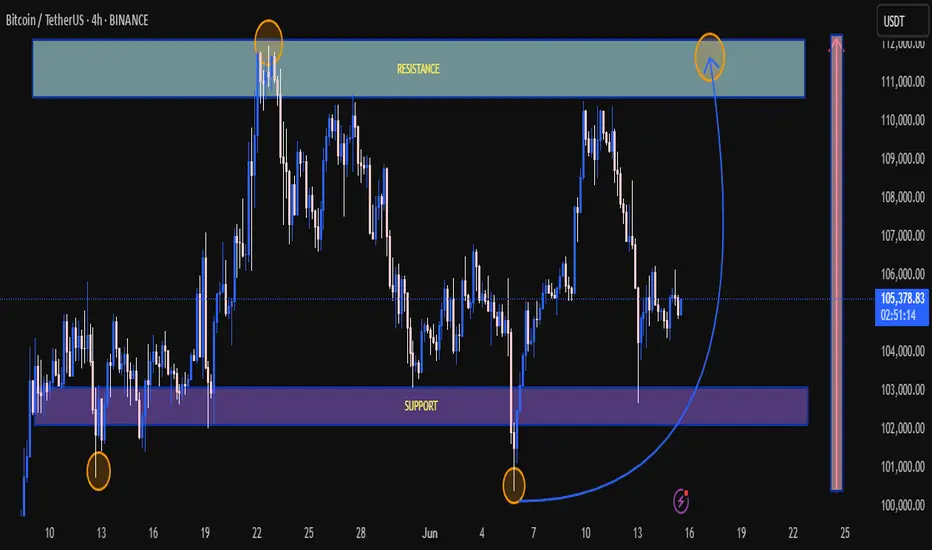
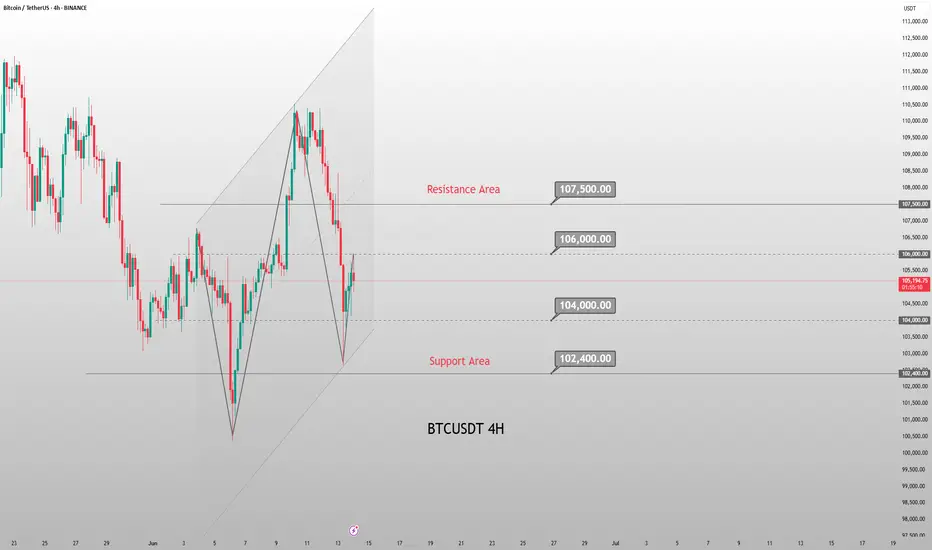
Technical Chart Analysis – BTC/USDT (4H Timeframe)📊 Current Price: ~105,108 USDT
---
🔵 Support Zone (Highlighted in Purple)
Zone Range: ~102,500 – 103,800 USDT
💡 Historical Significance:
This zone has acted as a strong support multiple times (📍June 13 & June 4), marking clear demand and buyer interest.
🛡️ Buyers stepped in strongly, causing sharp price reversals from this level.
---
🔴 Resistance Zone (Highlighted in Blue)
Zone Range: ~109,500 – 111,000 USDT
🔼 Marked with multiple failed breakout attempts (📍May 21 and projected again around June 18-20).
⛔️ Sellers dominate this zone, causing price rejection each time it was tested.
---
🔁 Rounded Bottom Formation (Cup Pattern?) ☕️
⚙️ A smooth rounded recovery pattern is forming, indicating accumulation and potential bullish continuation.
📈 If price sustains and retests the resistance again with momentum, we may see a breakout attempt.
---
🧭 Key Takeaways
Indicator Insight
🟣 Support Well-defined, historically respected zone. Good risk/reward for long entries.
🔵 Resistance Strong sell pressure zone. Needs breakout for bullish confirmation.
☕ Pattern Rounded bottom = bullish setup if volume supports the breakout.
📆 Watch Zone June 17–20 – potential resistance retest.
🔔 Risk Area Failure to hold mid-range (~105K) could lead to a retest of support.
---
🚀 Bullish Scenario
✅ Break and close above 111,000 USDT with volume.
📍 Target: 113,500–115,000 USDT 📈
🐻 Bearish Scenario
❌ Rejection at resistance again.
📍 Retest of support zone ~103,000 USDT or below.
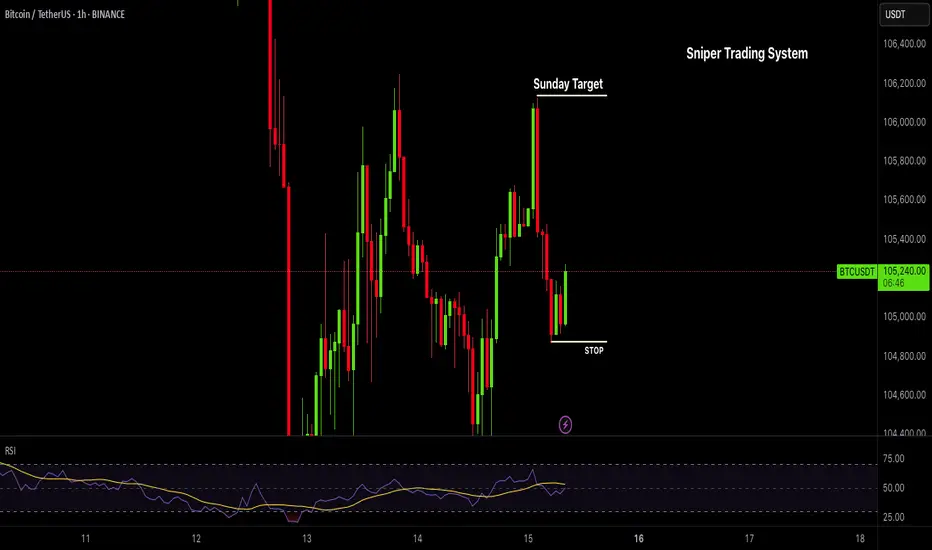
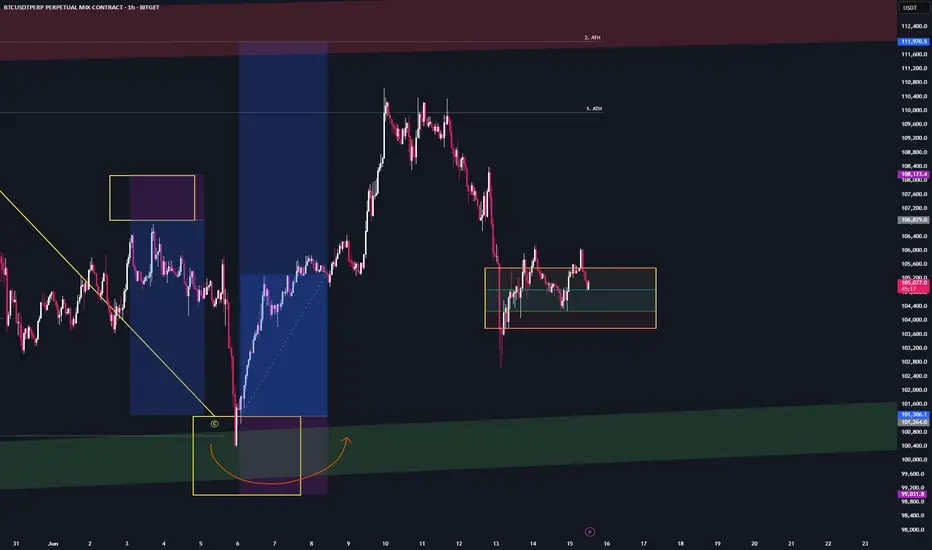
BTC Buy Setup | Sniper Trading System - Reverse Play🚨 BTC Buy Setup | Sniper Trading System™️ Reverse Play Activated
What you’re looking at isn’t luck — it’s Sniper-level execution.
This BTC reversal trade was triggered by my Sniper Trading System™️, which identifies institutional-level liquidity traps, dealer ranges, and timing zones with precision.
🧠 Setup Highlights:
— Liquidity sweep below key support
— RSI confirming reversal from the Fade Zone
— Dealer Range low respected
— Reversal candle + structure shift = high-probability sniper entry
📍 Chart:
This is powered by my Jesus Saves™️ + Fade Reversal Combo, built into the Sniper Trading System Suite™️.
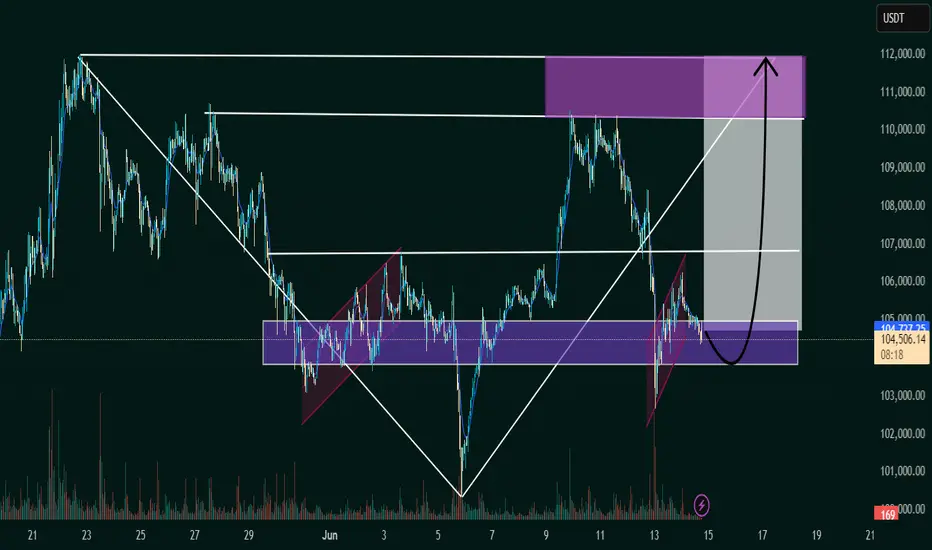
BTC/USDT Bullish Reversal Zone AnalysisSupport Zone:
The horizontal purple box (~104,000 USDT area) has acted as a strong support/resistance flip zone multiple times.
Falling Wedge Breakout:
The price action broke out of a falling wedge pattern earlier, confirming bullish momentum.
Flag Formation (Current):
A smaller bullish flag/pennant appears to be forming, and a breakout above could trigger a strong upward move.
Projected Move:
The black arrow indicates a potential bounce from this support zone, with the price targeting the 111,000–112,000 USDT zone (highlighted in the top purple box).
Volume Spike:
Notable volume spike near the bottom supports the idea of accumulation and possible reversal.
📈 Conclusion:
If the support zone holds and price breaks above the minor flag, a bullish continuation is likely toward the 111,000–112,000 resistance area. Traders should watch for confirmation of a breakout and volume increase for validation.
BTC - Short-Term market updateWe’re currently moving sideways between the ATH and $100K.
We’ve tapped into the short-term trend reversal zone and are now consolidating around it.
The next move will come — whether it breaks up or down.
What matters most now is the $100K Higher low.
As long as we stay above it, the structure remains bullish.
If we break below, momentum will shift accordingly.
I’m not taking any positions right now — just observing,
while the geopolitical noise plays out.
The most important thing in phases like this are to
stay calm, focused, and filter out the noise.
BTCUSDT Trend Analysis and Trading RecommendationsToday's overall BTC market rebounded after hitting a low of 102,614 in the early trading session, with Bitcoin's price maintaining a slow upward trend throughout the day. The intraday high reached 105,912 but encountered resistance. As the weekend approaches, historical market data shows limited volatility during weekends, so range-bound fluctuations are expected for the weekend.
From the current overall market rhythm, the price has rebounded slightly today after the previous decline. The hourly chart shows consecutive upward candles, though the price movement remains relatively slow. As time progresses, the price is expected to sustain an upward trend after pullbacks, and breaking through the short-term resistance level is only a matter of time. In terms of short-term structure and pattern, despite slight resistance and minor pullbacks, the downward momentum has weakened. We can still focus on long positions at lower levels, paying attention to the 106,000 resistance level.
BTCUSD
buy@104000-104500
tp:106000-107000
Investment itself is not the source of risk; it is only when investment behavior escapes rational control that risks lie in wait. In the trading process, always bear in mind that restraining impulsiveness is the primary criterion for success. I share trading signals daily, and all signals have been accurate without error for a full month. Regardless of your past profits or losses, with my assistance, you have the hope to achieve a breakthrough in your investment.
Will History repeat itself for BTC?Why Bitcoin Could Fall
Historical pattern?
-Bitcoin seems to be replicating the old crash from 60k.
Regulatory or policy uncertainties
-Future regulation remains uncertain; unexpected rulings or crackdowns could reduce institutional appetite and lead to pullbacks.
Dependence on economic sentiment
-If global liquidity tightens or equities falter, Bitcoin could behave like a high-risk asset and decline sharply
Current War situation
-The effecs of the Iran-Israel war will affect BTC as USD is seen as a risk-off asset (so if USD goes up, then BTC goes down)
-Disclaimer: This analysis is for informational and educational purposes only and does not constitute financial advice, investment recommendation, or an offer to buy or sell any securities. Stock prices, valuations, and performance metrics are subject to change and may be outdated. Always conduct your own due diligence and consult with a licensed financial advisor before making investment decisions. The information presented may contain inaccuracies and should not be solely relied upon for financial decisions. I am not personally liable for your own losses, this is not financial advise.

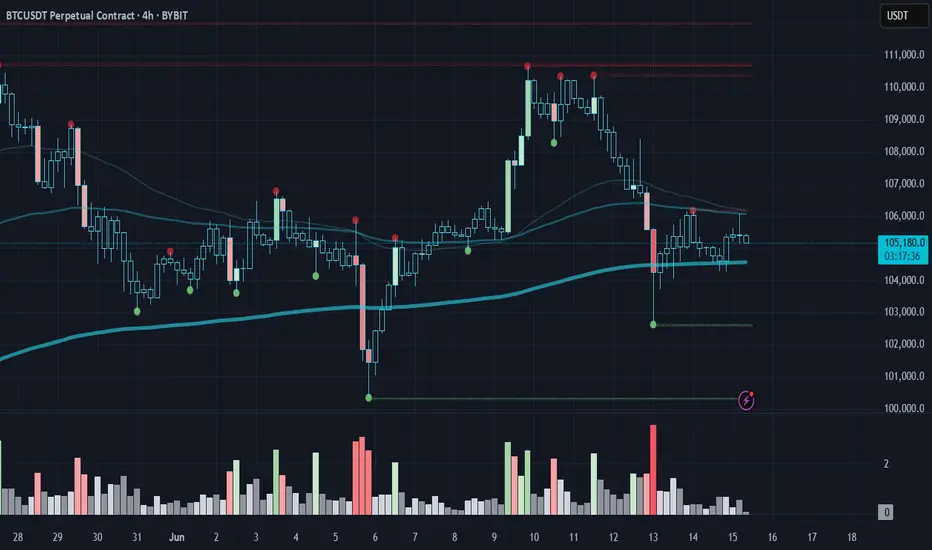
Bitcoin is holding the 200 EMA on H4 despite everything...Despite war news and heavy sell volume, BTC held the 200 EMA on H4.
Low-volume weekend = low liquidity, yet bears still couldn’t break it.
🧠 Classic Effort vs. Result: big effort, weak result = hidden strength.
🎯 If it holds: $106.5K → $108.2K → $110K in play.
Structure intact. Bulls stealthily in control.
BTC BITCOIN Bitcoin buy level on the green structure to watch will be on the 100k and my next buy watch zone will be 97-98k .
Growing institutional participation, including the launch and approval of Bitcoin ETFs is increasing liquidity and legitimizing BTC as an investment asset.
Macroeconomic Environment , Persistent low real interest rates by central banks and concerns about inflation support demand for Bitcoin as a store of value.
Geopolitical uncertainties and currency debasement fears boost Bitcoin’s appeal as a digital gold.
Bitcoin’s network security, hash rate, and active addresses remain robust, underpinning confidence in its decentralized infrastructure.
Continued development in scaling solutions and layer-2 technologies enhances usability.
Increasing regulatory clarity worldwide, including clearer frameworks for crypto exchanges and custodians, reduces uncertainty and encourages adoption.
However, regulatory risks remains a factor that can cause short-term volatility.
#bitcoin #btc

There is another Bearish BPR zone below the current price.BTC/USDT Market Update – Clear, Detailed, and Easy to Understand (Even for Beginners)
Let’s take a look at what’s happening with Bitcoin (BTC/USDT) right now explained in a way that even someone new to trading can follow along and understand.
Recently, Bitcoin hit a new high it was climbing up steadily. But then, due to negative global news related to war, the market took a hit and started dropping sharply.
Currently, BTC is trading at a (BPR) this is a technical area that often acts as a strong resistance zone, where the price tends to face rejection and reverse.
👉 Right now, Bitcoin is struggling to move higher and appears to be getting rejected from this BPR level.
But here’s where it gets more interesting:
🔻 There is another Bearish BPR zone below the current price, and the market has already touched that zone once before bouncing upward.
So what's the current situation?
📍 If Bitcoin is able to break above the current Bearish BPR (the level where it’s trading now) — it would be a bullish sign, and the market may start rising again.
📍 However, if BTC fails to break this resistance level, then we could see another strong move to the downside, possibly heading back to lower support zones.
🚨 Key Takeaway:
This level — the one BTC is currently interacting with — is very important.
📌 Traders should keep a close eye on it.
📌 Let the market reveal its direction before making any decisions.
Remember:
⚠️ This is not financial advice. Always Do Your Own Research (DYOR).

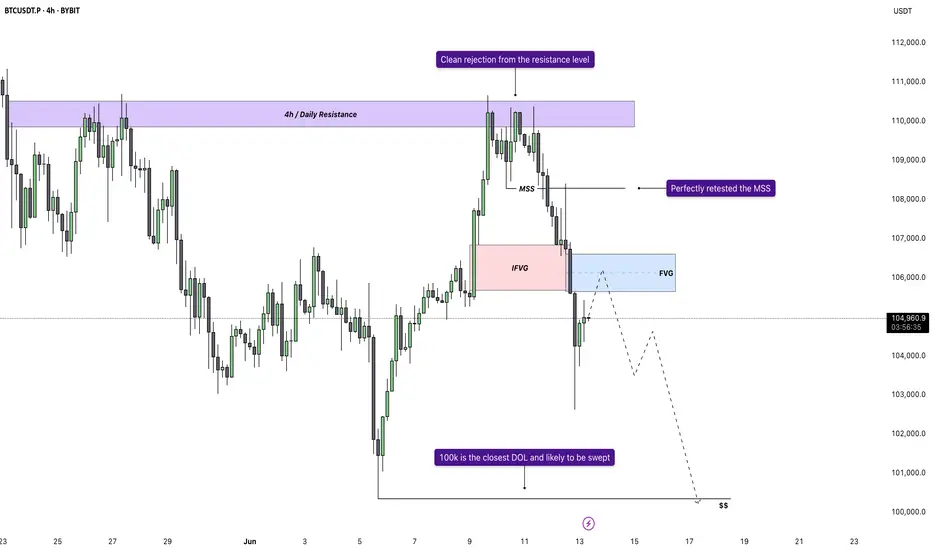
Bitcoin - Bears vs Bulls: $100k next?Price recently tapped into a well-defined 4H and daily resistance zone and was met with an immediate rejection. That rejection wasn’t just a reaction, it led to a confirmed market structure shift as price broke the previous low. This transition from higher highs to a lower low signals the first sign of bearish control, flipping the short-term bias and setting the tone for a move lower.
Retest of MSS and Inversion Fair Value Gap
After the break in structure, price retraced directly into the origin of the move, retesting the same zone where the shift occurred. A previously bullish 4H gap has now flipped into resistance, rejecting price perfectly. This inversion, where a bullish imbalance turns into a bearish reaction zone, confirms the change in direction and strengthens the downside narrative.
New FVG as Entry Opportunity
The latest bearish impulse created a clean new fair value gap just above current price. A retest of this gap would offer a high-probability continuation setup, as it aligns with both recent structure and order flow. This zone becomes the critical level for bears to defend, and unless price reclaims it, the expectation remains for continuation toward lower liquidity.
Liquidity Outlook and Bearish Target
Below current price, a large pool of liquidity is sitting just above a major psychological round number. That level hasn’t been swept yet and is a likely downside magnet. With no meaningful support between the current FVG and that draw on liquidity, price is likely to reach for it next. This fits the typical sequence following a market structure shift: rejection, shift, retest, continuation, and liquidity sweep.
Momentum and Contextual Confluence
Zooming out slightly, the current move fits within broader bearish momentum that has been developing across timeframes. There’s no sign of strong bullish absorption, and each push higher has been met with efficient selling. This isn’t a chaotic breakdown, but a controlled sequence of lower highs and lower lows, supported by clean structural shifts and consistent rejection zones.
Conclusion
The chart tells a clear story. A clean rejection from a key resistance zone led to a confirmed bearish structure shift, followed by a textbook retest and fresh fair value gap. As long as price remains below that gap, the setup favors continuation lower, with the nearest liquidity pool being the most likely draw. This remains a high-probability bearish scenario until proven otherwise by a shift back above invalidation levels.
___________________________________
Thanks for your support!
If you found this idea helpful or learned something new, drop a like 👍 and leave a comment, I’d love to hear your thoughts! 🚀
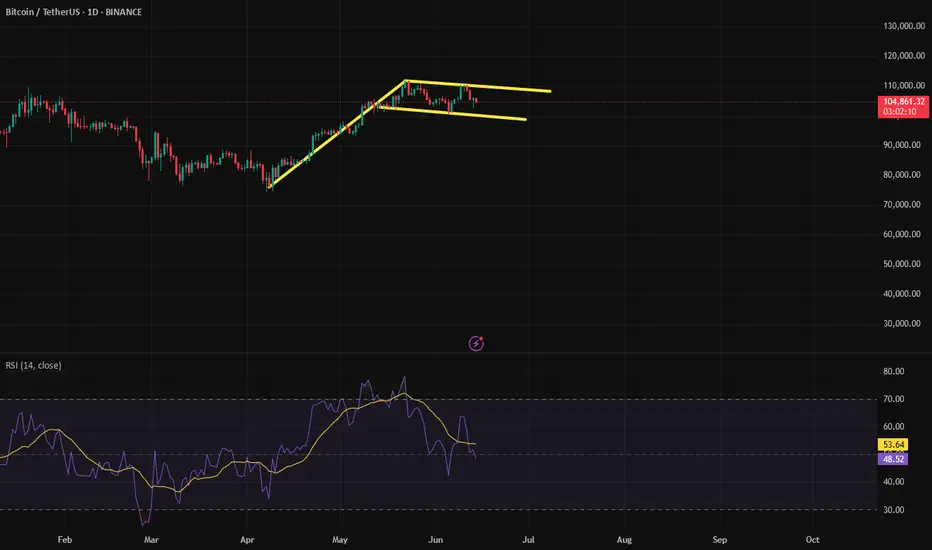
Is BTC already reversing?Bitcoin broke out above its downtrend line. A retest may happen, but the trend is broken.


Using double PAR to perfect entriesUsing double PAR to perfect entries - This is a crash course but can be more involved for continuation trades

$BTC has seen neither wars nor crises nor antics.CRYPTOCAP:BTC has seen neither wars nor crises nor antics. But it is still here and still rising. What do you see in this chart? I do not recommend investing in the rise. I may be wrong about buying with what I wrote, but I am bullish flag technology in this chart. 100k 99k needles can be thrown but it will go up after closing the day under it.
Bitcoin Breaks 20-Jan 2025 Peak Price, New ATH Next (+Altcoins)Look at this, Bitcoin closed the day exactly above the 20-Jan 2025 high. This day Bitcoin peaked at $110,265, the all-time high before May; yesterday, 9-June 2025, Bitcoin peaked at $110,577.4 but closed at $110,270, five dollars higher. Is this a bearish or bullish signal? What to expect!
Good evening my fellow Cryptocurrency trader, I hope you are having a wonderful day.
This week starts with a bang, a big bang, with Bitcoin doing great. The question immediately arises and I will answer, Will Bitcoin continue growing? Or, will Bitcoin produce a retrace?
I can tell you with 100% certainty that Bitcoin will continue to grow. I can support this statement with data from the charts.
We have hundreds and hundreds of altcoins going bullish, strongly bullish, some coming out of a new all-time low. If Bitcoin was set to crash, these altcoins wouldn't be gaining in bullish momentum, they would be diving deep much lower in order to create new lows. But this isn't what is happening this week, last week and today, no! What we are seeing now is huge growth across the altcoins market and this confirms what Bitcoin will do next.
Needless to say, as Bitcoin trades near its all-time high this is extremely bullish.
If a new all-time high is hit but the action moves lower, say 10-15% lower and remains there, this is bearish and points to lower prices. If the action remains very close to resistance, as it is now, this is ultra-bullish. It is simple do you agree?
Because when there is an incoming drop many people in the know start to sell, so the action never stays at resistance there is always a strong rejection with high bearish volume.
On the other hand, when resistance is challenged and continues to be hit over and over, or the action stays very close, it simply means that people are buying, holding and ready for growth. Bitcoin will continue moving higher mark my words. It is very easy because this has been confirmed long ago.
The bottom was hit 7-April and we are now experiencing long-term growth. As Bitcoin continues to trade near its all-time high, the altcoins will blow up.
When Bitcoin grows 20-30%, some altcoins can grow 100-200%. When Bitcoin grows 50%, some altcoins can grow 300-500%. This is the 2025 bull market.
Thank you for reading.
Give me a boost if you trade and profits from the altcoins market.
Namaste.
P.S. Leave a comment with your favorite altcoins, I will consider the pair for a few full analysis.

BTC SHORT BEFORE ATHLooking to first short BTC toward the weak low we created during Friday's Asia session. Price left it exposed clean liquidity. If we get the right confirmations.The fake BOS that will take place if we move higher just adds more conviction to my play in the case we do first push towards the daily BPR.
This move would clear the path, set the stage, and potentially give us the entry conditions we want for the higher timeframe play. Where we will be looking for longs towards ATH.
For the HFTF view and what comes after, check the other chart I posted earlier same blueprint, just higher up the ladder.

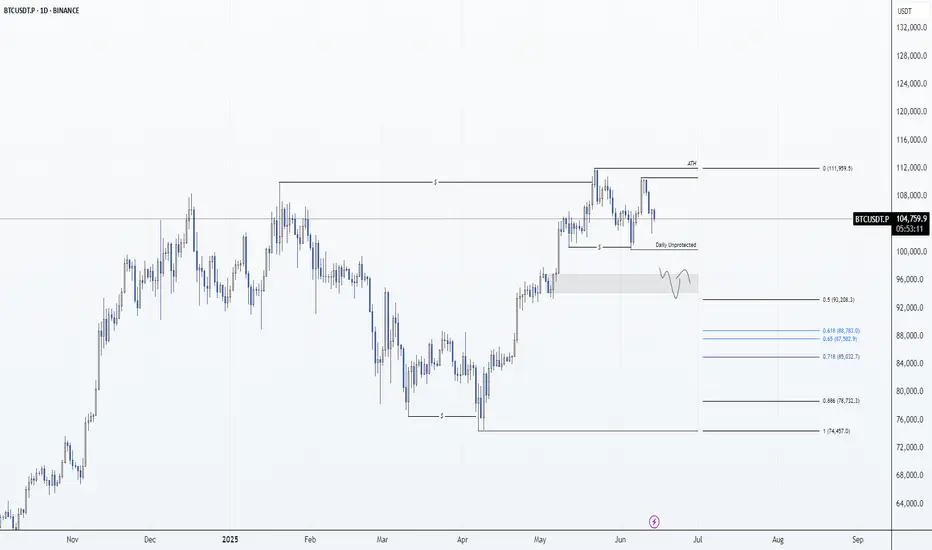
BTC: Daily Timeframe 14/06/25Spot buyer again ~ $93k aka 0.5 retrace of the weekly leg
Higher timeframes swept (ATH) with confirmed deviation.
Expecting a corrective to continue healthy trend before more bullish continuation
If we set a lower high on the weekly, that’ll flip my bias and a far deeper corrective leg would be likely.
Right now long term BTC is the only crypto coin I hold as long term conviction remains unchanged its direction is up and to the right for many years to come.
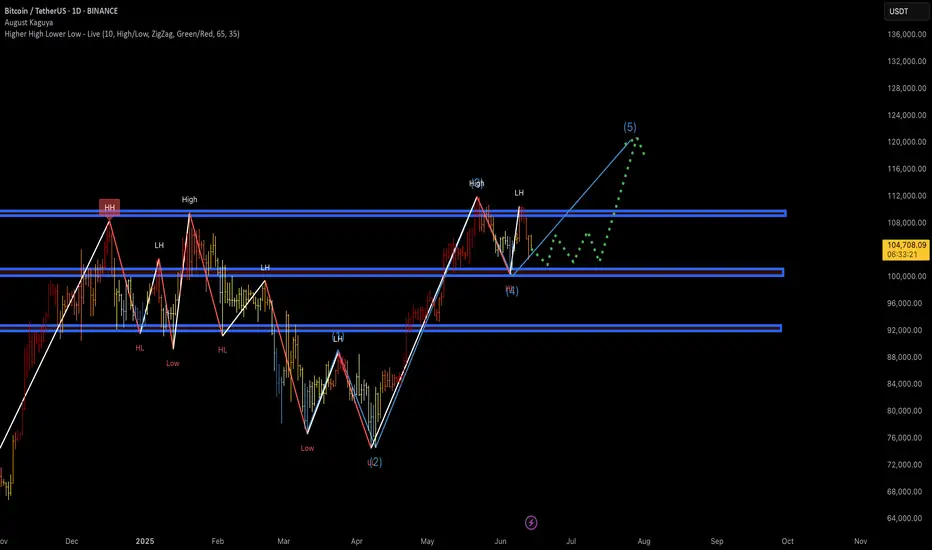
Wave (4) Correction Completed? Wave (5) ImminentBitcoin appears to be completing an Elliott Wave structure, currently sitting around the (4) pullback area with signs of a potential continuation into wave (5) to new local highs. The recent LH and bounce from demand could mark the beginning of the impulsive move.
Key Observations:
✅ Elliott Waves Count (1–2–3–4–5) in Play
Wave (3) completed near ~$113K
Wave (4) correction retraced into the ~$98K support zone
Structure looks corrective (ABC style), typical for wave 4
Wave (5) projection aims towards ~$120K+ based on symmetry
✅ Market Structure
Higher High (HH) → Higher Low (HL) pattern intact
Price respected a key demand zone and bounced
Green dotted line shows potential consolidation → breakout behavior
✅ Support Zones
~$98K = key demand + previous HL
~$92K = macro structure support
Holding these levels = bullish continuation scenario likely
✅ Resistance Ahead
~$113K = recent local high
Break and close above this = wave (5) confirmed
Final TP area ~$120K–124K based on Fibonacci extensions and wave symmetry
🎯 Trade Plan (Idea)
Entry: On confirmation above $106K
Targets:
TP1: $113K (retest)
TP2: $120K
TP3: $124K
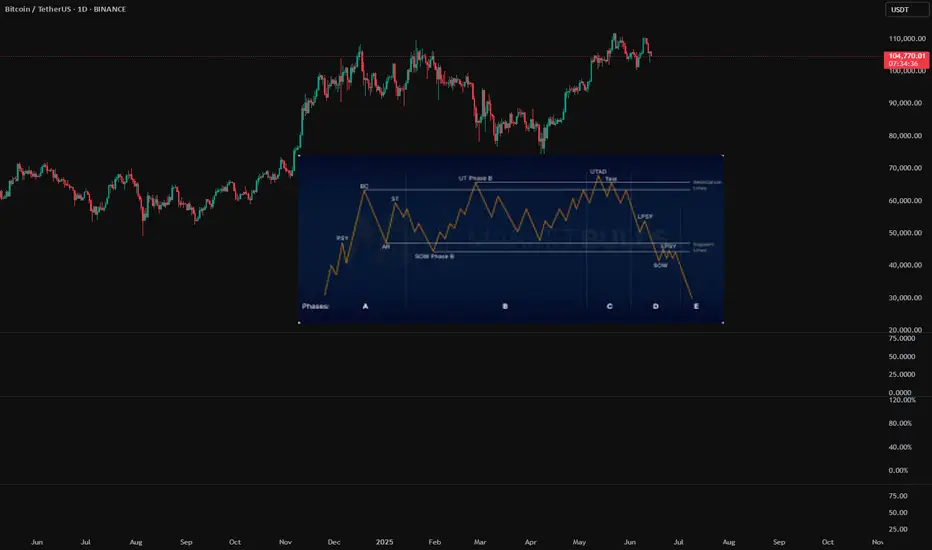
Is BTC in a Wycoff Distribution?BTC has failed to breakout from $110k and hold. I am starting to notice a possible Wycoff distribution pattern on bigger and smaller timeframes. I am a long term bull on BTC so don't meant to sound like a bear but it is starting to show signs of weakness. Anything can happen and the market is always right. Stay safe!
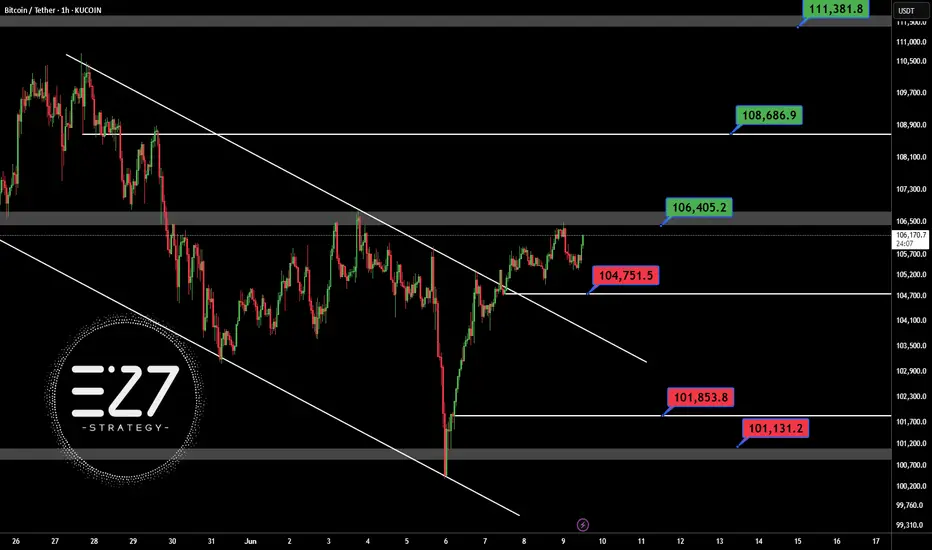
BTCUSDTSafe for open long position in BINANCE:BTCUSDT abow 106.400$ in H1 time frame.
First support: 104.750$
Best support: 101.850 - 101.131 $
First resistance: 106.400$
Best target this chart: 108.700 - 111.381$
Contol money management
One more drop?I assume the correction is not quite over yet. One more drop for BTC would make perfect sense.
