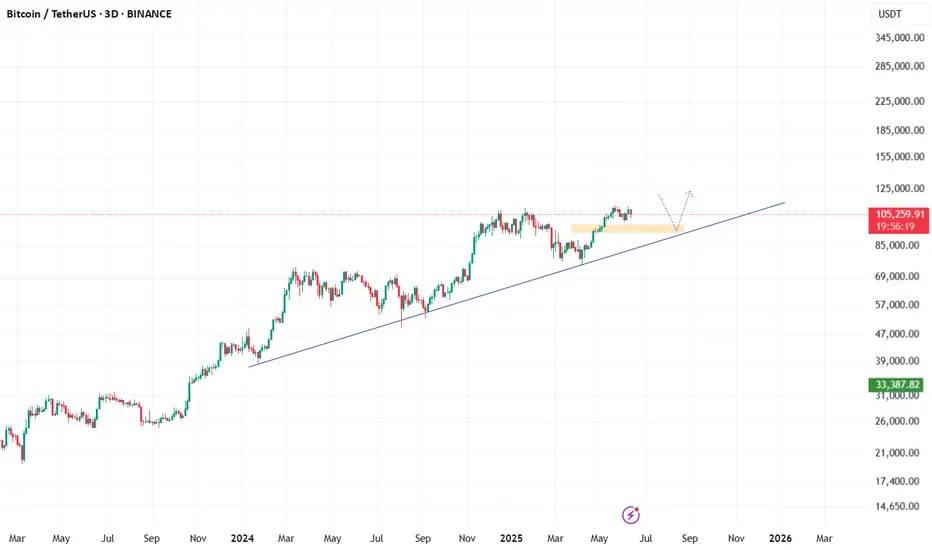
#BITCOIN: Accumulated Volume, Time For $150,000Bitcoin has accumulated nicely, but we don’t expect the price to distribute strongly towards $150k. We have set two targets: 125k and a swing target at 150k. Remember to have a confirmation before entering.
Good luck and trade safely,
Team Setupsfx_
BTCUSDT.3L trade ideas

Global M2 & BitcoinThe Bitcoin chart holds an open secret — and it’s still called: LIQUIDITY. 💥
Forget the media noise.
The current chart shows that global M2 liquidity (with a 12-week lead) continues to drive Bitcoin’s price almost entirely.
No magic. No coincidence.
Macro beats opinion.
If 89% of price movements can be explained by liquidity flows,
then the rest... is just background noise.

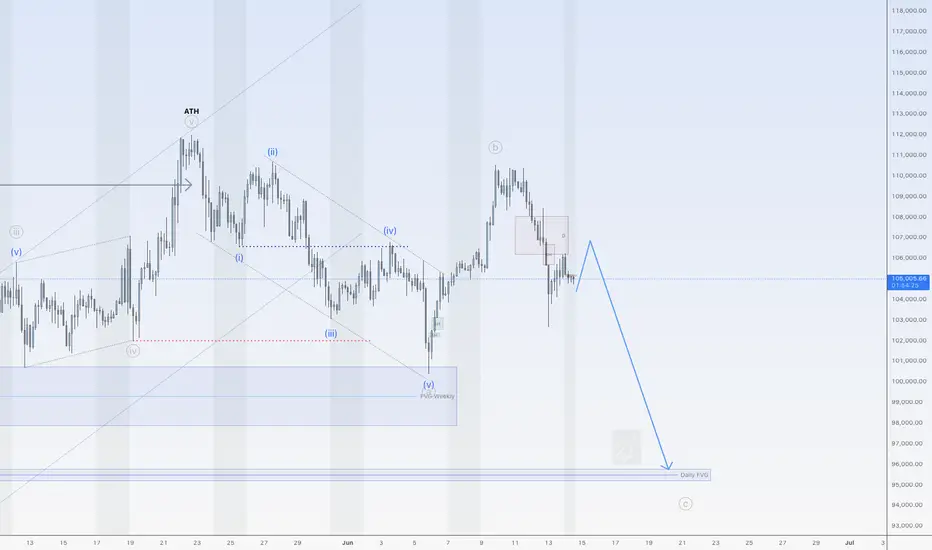
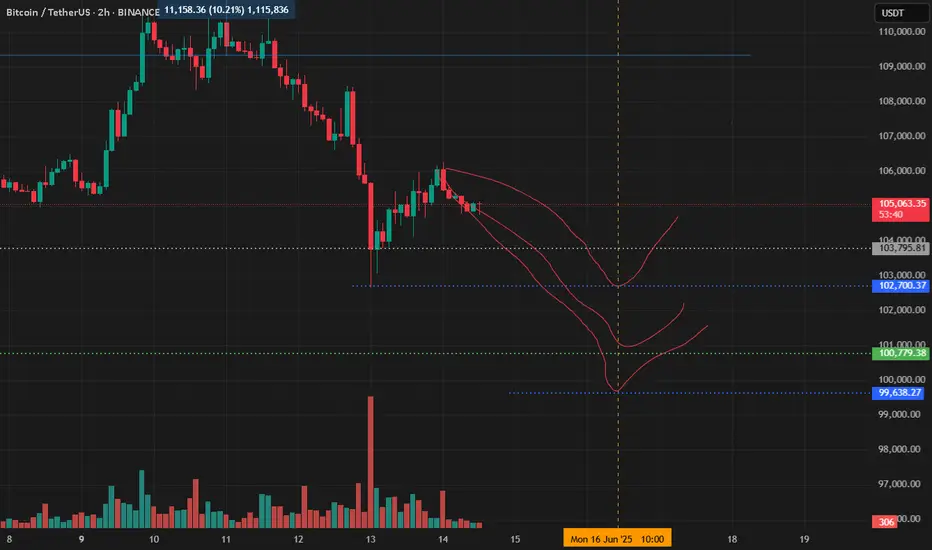
Bitcoin could drop to 95KHi traders,
Last week Bitcoin followed my outlook exactly.
Price went up a little higher to finish wave B (grey) and after that it started the next wave down.
Now we could see a small correction up and after that down again.
Let's see what the market does and react.
Trade idea: Wait for the correction up to finish to trade shorts.
If you want to learn more about trading FVG's with wave analysis, please make sure to follow me.
This shared post is only my point of view on what could be the next move in this pair based on my analysis.
Don't be emotional, just trade your plan!
Eduwave
btcCertainly! Here's a 3-paragraph explanation about the current state of the crypto world in English:
---
The cryptocurrency world in 2025 continues to evolve rapidly, with increasing adoption across financial, technological, and governmental sectors. Major cryptocurrencies like Bitcoin and Ethereum remain dominant players, but newer blockchains such as Solana, Avalanche, and Layer 2 networks like Arbitrum are gaining ground due to their scalability and lower transaction costs. Institutional interest has also grown, with several banks and investment firms offering crypto-related products, including ETFs and custody services.
Regulation has become a central theme in the crypto space. Governments around the world are creating clearer frameworks to manage digital assets, aiming to protect investors while still fostering innovation. The United States, European Union, and parts of Asia have introduced stricter guidelines around Know Your Customer (KYC), anti-money laundering (AML), and crypto taxation. While this has added compliance burdens for projects and users, it has also brought more legitimacy to the market.
Meanwhile, decentralized finance (DeFi), non-fungible tokens (NFTs), and blockchain gaming remain strong sectors, though they have matured compared to the initial hype. AI integration, tokenized real-world assets (RWAs), and cross-chain interoperability are current trends shaping the next phase of crypto innovation. Despite some market volatility, the overall sentiment in 2025 is one of cautious optimism, with developers and investors focusing on utility, security, and long-term sustainability.
---
Let me know if you'd like a version with simpler vocabulary or expanded to more paragraphs.
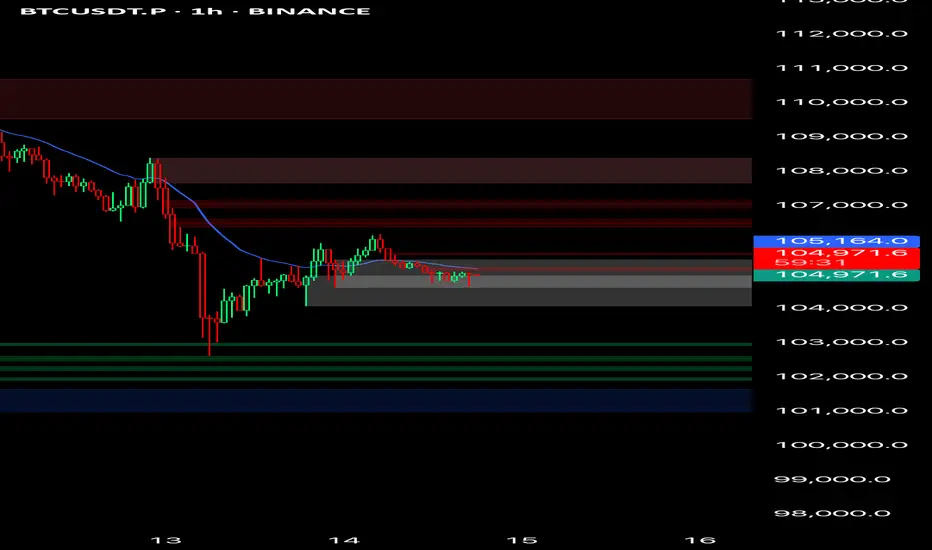
Bitcoin Sentiment Slips Below Neutral As Price Hovers Near $105KBitcoin sentiment drops to 46.1% as market shows hesitation despite price rebound.
Trading volume remains flat, weakening support for BTC’s move above $105K.
Sentiment must exceed 60% with rising open interest to avoid retest of $102K support level.
According to the latest Advanced Sentiment Index data, Bitcoin sentiment has weakened despite the asset making a small recovery. As of June 13, the index recorded a reading of 46.1%, falling below the neutral 50% mark. This shift indicates a cautious market environment where investors remain hesitant to drive further gains without stronger confirmation signals. While Bitcoin has rebounded from recent lows, sentiment metrics and trading volume suggest limited conviction behind the price move.
According to the Bitcoin Advanced Sentiment Index, the current reading has fallen to approximately 46% just below the neutral 50% threshold. The chart shows that after bullish sentiment peaked above 80% in early June, the index has gradually declined; despite the recent TELEGRAM /(@TradeWithARZ) June 14, 2025
Data from the Advanced Sentiment Index shows that market optimism peaked above 80% in early June but has steadily declined since. The chart, tracking activity from May 16 to June 13, shows that sentiment dropped below 20% on multiple occasions, including June 5 and June 13, both aligning with short-term declines in Bitcoin’s price. Although the asset has since bounced back from those levels, investor confidence remains subdued.
The bell curve model used in the chart emphasizes that the majority of sentiment readings have clustered between 40% and 65%, showing a lack of extreme bullish or bearish positions. This distribution suggests uncertainty, as traders hesitate to take strong directional bets.
Recent price action within the $103,000 -$105,000 area has, however, not been accompanied by new volume inflow as net buy volume and volume delta show almost no change. The stagnation of these indicators suggests that the market participants did not support the rise to a sufficient degree.
Price Volatility Contains Within Narrow Range
According to CoinMarketCap, Bitcoin was trading at $104,950.96 at the time of writing, reflecting a 0.31% decrease over the past 24 hours. The price surged above $106,000 but faced resistance and returned to a tighter trading band. A major dip occurred around 6 PM on June 13, followed by a rebound during the early hours of June 14. Despite these fluctuations, the asset has not broken out of its recent consolidation pattern.
Source: CoinMarketCap
The volume-to-market cap ratio over the last 24 hours is 2.38%, which indicates moderate trade. The total circulating supply of bitcoin has now grown to 19.87 million BTC and is getting ever closer to the protocol-imposed limit of 21 million. Despite the stability seen in price action, analysts are monitoring bigger signs before calling a directional change.
According to analysts, the sentiment index needs to exceed 6065 percent to validate a sustainable uptrend. An increase in open interest and net taker volume is unlikely to achieve that level. In the absence of those conditions, the market is vulnerable to retesting lower support areas between $102,000 and $103,000.
STOP LOSS LESSONI want to share my opinion about stop-losses.
I don’t use them, because very often the stop gets triggered — and then the price moves in the right direction, but you're no longer in the trade.
I do it differently: I set a take-profit, but no stop-loss.
Let’s say I have $1000, and I enter a short with $100.
The price would have to increase 10 times to get me liquidated.
A 2–3% drawdown is acceptable, especially in an overbought market.
So why would I use a stop?
Trade with small amounts — and everything will be fine.
You won’t lose money.
If you're looking for excitement, go to a casino — the odds are better there.
In trading, you need to be careful and stay calm.
From my experience, technical analysis often doesn't work.
Thanks for your attention.
#stoploss
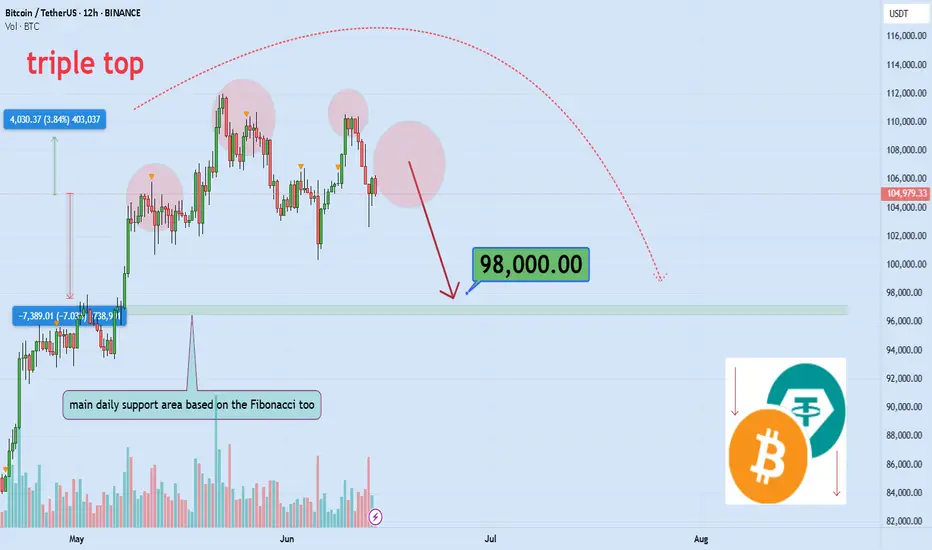
Iran-Israel Political Tension & End of Crypto marketDo geopolitical tensions truly cause markets to crash or pump?
In a world where financial safety is more fragile than ever, how do traders react?
This analysis dives deep into how pro traders think and act during critical moments.
Hello✌
Spend 3 minutes ⏰ reading this educational material.
🎯 Analytical Insight on Bitcoin:
Bitcoin is experiencing a fear-driven shock amid escalating geopolitical tensions, triggering potential downside volatility toward the $98K level 📉. Despite this risk-off sentiment, the broader market structure remains intact, and I maintain a bullish bias. A recovery from key support zones could pave the way for a renewed breakout above $100K in the mid-term .
Now , let's dive into the educational section,
🧠 Fear, Safety or Opportunity? Trading Psychology in Crisis 🧨
Markets don’t move based on headlines—they move based on how the crowd feels about those headlines. Political tension triggers emotional responses, especially panic selling.
However, experienced traders spot opportunities while others flee.
In such moments, two emotional extremes dominate:
🔸 Fear of losing capital (FUD)
🔸 Greed to seize a rare opportunity (FOMO)
Both are dangerous if uncontrolled. Tools like RSI and Fear & Greed Index (via external APIs) can provide rough estimates of market sentiment and potential turning points.
📊 Practical TradingView Tools for Analyzing Crisis-Driven Markets 🔍
When global tension spikes, the markets reflect collective emotion like a mirror. During uncertain times, smart traders rely on tools that turn raw data into sharp insights. TradingView provides several features that become extremely useful in times of high uncertainty:
1. Crypto Volatility Index Proxy (using ATR + Bollinger Bands)
These indicators help detect when the market is driven more by fear than logic. They show increasing volatility levels as tensions rise.
2. Sentiment Indicators – Funding Rate & Long/Short Ratios
These metrics, pulled from major exchanges, show whether traders are overly bullish or bearish. A sudden imbalance usually hints at insider expectations or fast-breaking news.
3. DXY and Gold (XAUUSD) Side-by-Side with BTC
Analyzing Bitcoin’s performance alongside USD and gold gives insight into whether investors are going risk-off or seeking crypto as a hedge.
4. Volume-Based Indicators – OBV & Volume Profile
While headlines can lie, volume doesn’t. These tools highlight areas of serious buying/selling interest and help identify where smart money enters or exits.
5. Multi-Chart Layout Feature
TradingView allows you to analyze multiple assets together—BTC, gold, oil, and stock indices like S&P 500—on one screen. Perfect for understanding macro capital flow during geopolitical events.
💣 Interconnected Markets During Regional Conflict 🌍
Crypto often acts like a risk-on asset during global crises. If traditional markets fall, Bitcoin may follow—unless it’s being viewed as a safe haven.
That’s why watching DXY, gold, and oil charts alongside BTC is crucial.
Understanding these correlations using TradingView’s comparison features gives you a better sense of where capital is flowing during uncertain times.
⏳ What Traders Should Focus on in Crisis Mode 💼
1. Focus on chart confirmations, not news hype.
2. Use multi-dimensional analysis with TradingView.
3. Prioritize risk management more than ever.
4. Cash is a position. Sometimes the best move is no move.
5. Always have a backup scenario—no analysis is guaranteed.
📌 Final advice:
When headlines play with your nerves, data becomes your best ally.
With the right tools and a disciplined mindset, traders can navigate even the stormiest markets with confidence.
The market rewards the calm, not the reckless.
✨ Need a little love!
We put so much love and time into bringing you useful content & your support truly keeps us going. don’t be shy—drop a comment below. We’d love to hear from you! 💛
Big thanks,
Mad Whale 🐋
📜Please remember to do your own research before making any investment decisions. Also, don’t forget to check the disclaimer at the bottom of each post for more details.
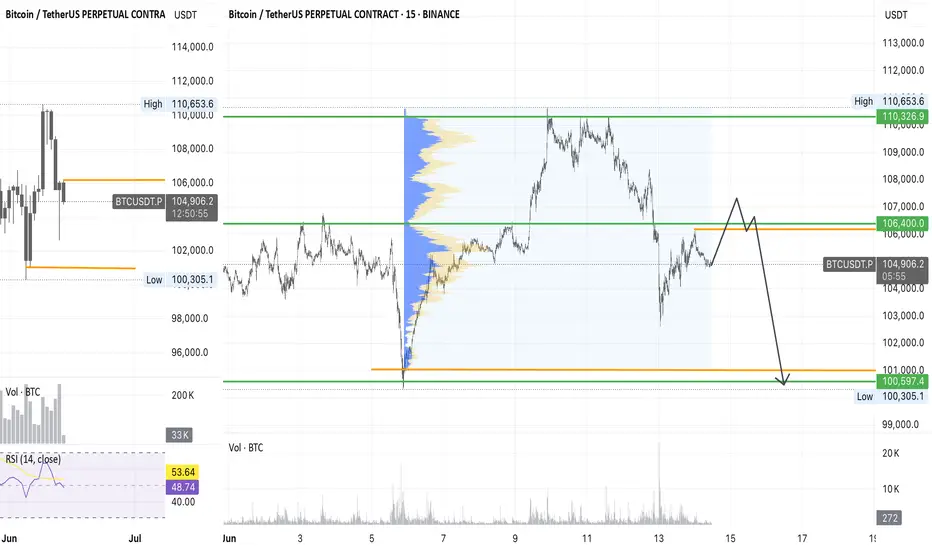
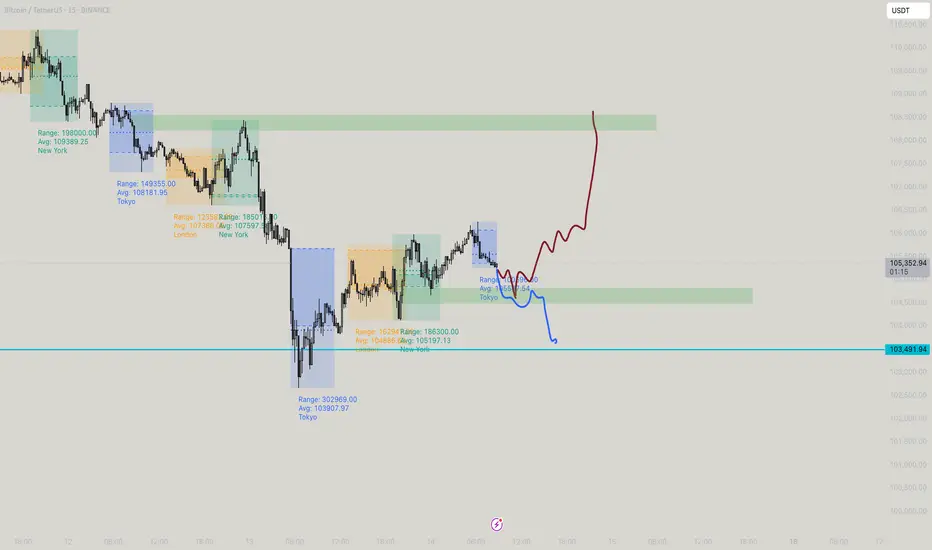
SHORT BTC✅ Short Setup Summary – BTCUSDT (15m chart)
🧭 1. Context
Volume Profile shows clear value area and Point of Control (POC) between ~104,000–106,000
Price is expected to retrace to supply at 106,400 (previous HVN & resistance)
Trade plan: Short from 106,400 → down to 100,600 zone
📌 Trade Idea Breakdown
🔄 Trade Direction: Short
🟩 Short Entry Zone: ~106,400
🟥 Stop Loss: Above the recent swing high (~107,000+)
🎯 Take Profit (TP): 100,600–100,300 (previous demand/liquidity zone)
📏 Checklist-Based Analysis
✅ 1. Market Structure
Current short-term structure is bearish (lower highs, lower lows)
Plan to enter at pullback into resistance, in-line with the trend
📘 Rule: Always trade with MS unless you have a trap or reversal
✔️ Structure: Bearish → short pullback is valid
⚠️ 2. Key Level (106,400)
Acts as supply zone / resistance
Also lines up with previous POC / volume cluster
High probability reaction area
📘 Rule: Trade from areas where volume or liquidity previously reacted
🔻 3. Entry Confirmation
Watch for:
Trap wick (SFP) or
Bearish engulfing / 3-bar reversal
On M15 or M5 before entry
📘 Rule: Do not enter blindly — wait for confirmation
📊 4. Volume Check
Monitor if volume increases during the test of 106,400
Preferably with aggressive sellers stepping in
📘 Rule: Volume spike + rejection wick = institutional activity
🛡 5. Risk Management
Component Value / Zone
Entry ~106,400
SL Above 107,000 (last clean high)
TP 100,600 – 100,300
R:R Target at least 1:3
📋 Execution Rules Summary
Step Status
Market structure bearish ✅
Supply zone identified ✅
Entry confirmation seen? 🔲 Wait
Volume reaction checked? 🔲 Wait
SL/TP based on structure ✅
🧠 Final Thoughts
This is a solid short setup plan with the trend.
You’re selling from a liquidity cluster + resistance + supply area — a confluence zone.
Just ensure you:
Wait for trap confirmation or bearish price action
Don’t jump in early — let price show weakness first
Watch for volume spike confirming rejection at 106,400
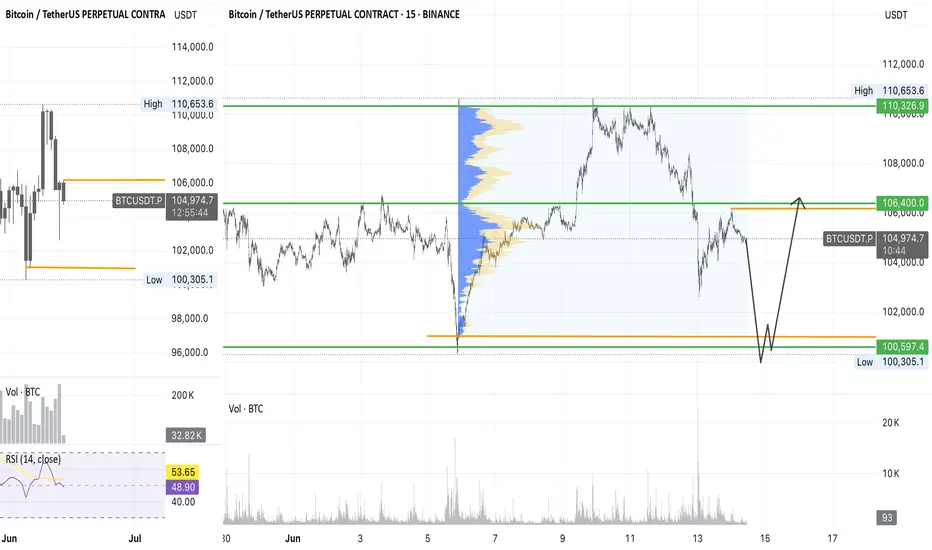
LONG BTC✅ Long Setup Summary (BTCUSDT)
🧭 1. Daily Timeframe Context (D1)
Price is approaching a key low zone at 100,300 – 100,600
This is a previous liquidity area, often where large players hunt stop-losses
Expecting a trap or reversal if price sweeps below and quickly recovers
📌 Rule: Always check the Daily chart to:
Understand current trend bias
Identify if price is at support/resistance
Spot any trap or reversal signals (e.g., engulfing, pin bar, 3-bar reversal)
📐 2. Market Structure (M15–H1)
Short-term structure is currently bearish (lower highs, lower lows)
Trade idea is a counter-trend long, so confirmation is critical
📌 Rule:
Confirm market structure on M15/H1 before entry
Counter-trend trades must have trap confirmation to reduce risk
🔻 3. Trap / SFP Confirmation (Key Entry Condition)
Watch for price to break below 100,300 (previous low) and reject sharply
Look for a swing failure pattern (SFP) or false breakout wick
Entry is valid only if price closes back above the trap zone
📌 Rule:
Never enter just because price is at support
Only enter after trap wick + bullish candle confirmation
📊 4. Volume Confirmation
Look for a spike in volume at the trap wick
Confirms real interest and activity from institutional participants
📌 Rule:
A proper reversal setup includes price trap + volume confirmation
Avoid setups with low or flat volume during the move
🎯 5. Entry Plan
Component Details
Buy Zone 100,300 – 100,600
Entry After confirmation: trap wick + bullish candle
Stop Loss Below the trap wick (example: 99,800)
Take Profit 106,400 (prior resistance / supply zone)
R:R Ratio Minimum 1:3, depending on execution
📌 Rule:
SL must be based on trap invalidation, not random distance
TP should be at the next key structure, not a fixed pip target
✅ Execution Checklist
Step Check
Daily bias aligns or neutral? ✅
Market Structure reviewed? ✅
Trap / SFP occurred? 🔲
Volume spike confirmed? 🔲
Bullish PA confirmation? 🔲
SL placed correctly? ✅
TP set at logical structure? ✅
📌 Summary
This is a high-probability counter-trend long setup from a key liquidity zone.
Success depends entirely on:
A clean trap/SFP wick
Volume spike at the low
Bullish price action confirmation
Without these, avoid entering.
Stick to the rules, and let the market come to you — don’t force the trade.
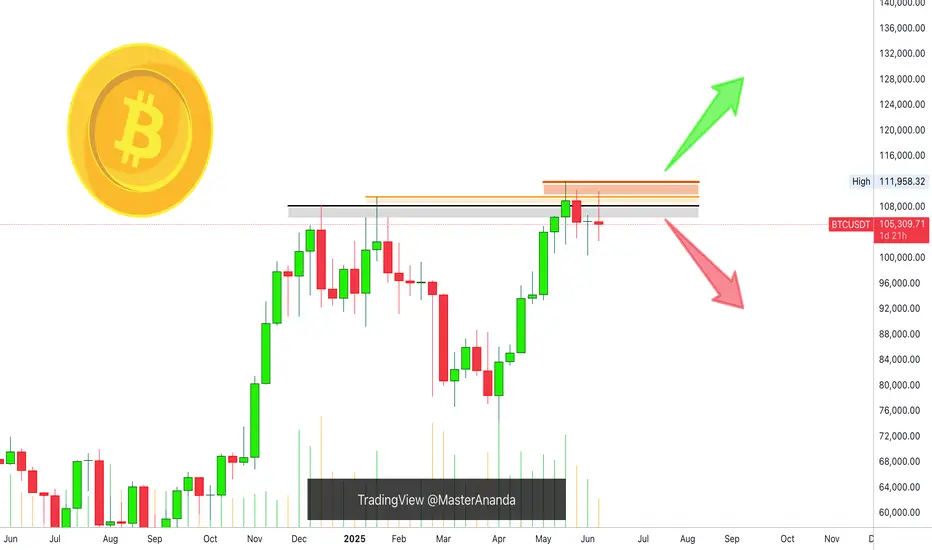
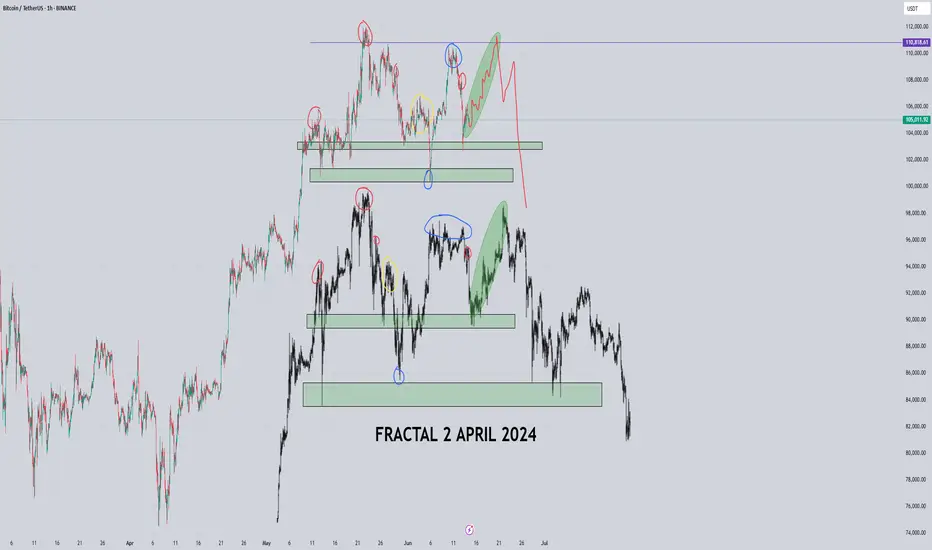
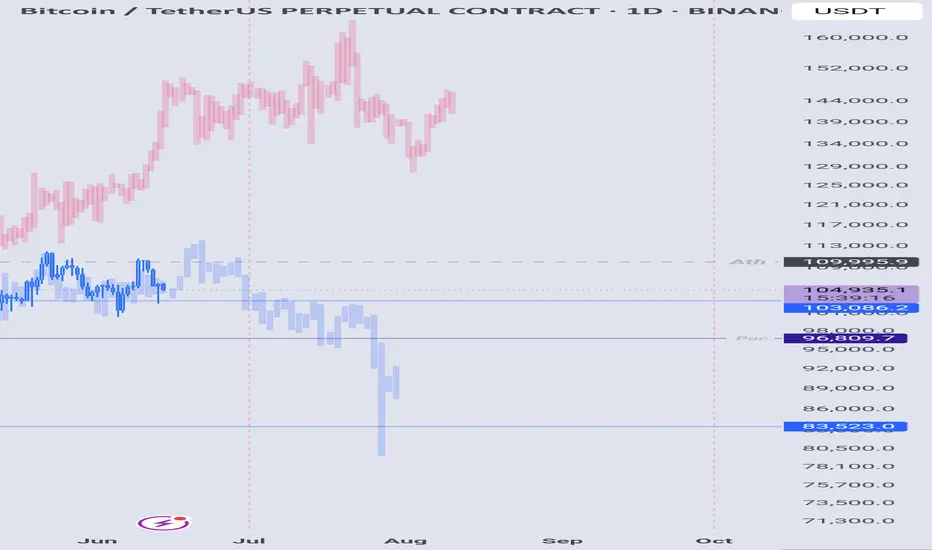
BTC - FRACTAL!!!!I found a fractal, the price should rise to the range of 110888, and then there will be a sharp decline, a squeeze will form, with the price supposedly rising and crossing over, but in reality, the price will be pushed down sharply to a range below $90k. I have an idea related to this, I called it the dragon's wings pattern. At one point, I simply realized that the chart repeats what has already happened, and this is exactly what needs to be analyzed. I think the price will go exactly as I have drawn it. All the best and stay disciplined!
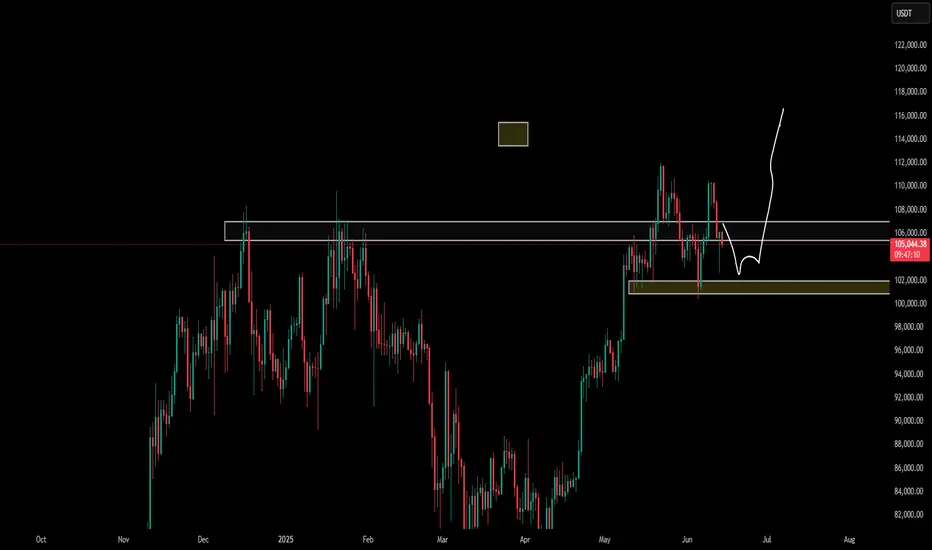
btc dirrection bitcoin collapse is coming be your tension at any time now the market is going up trend to correct or to touch the last double touch of the upper trend in order to finished structure then it come down till 95k to 90k

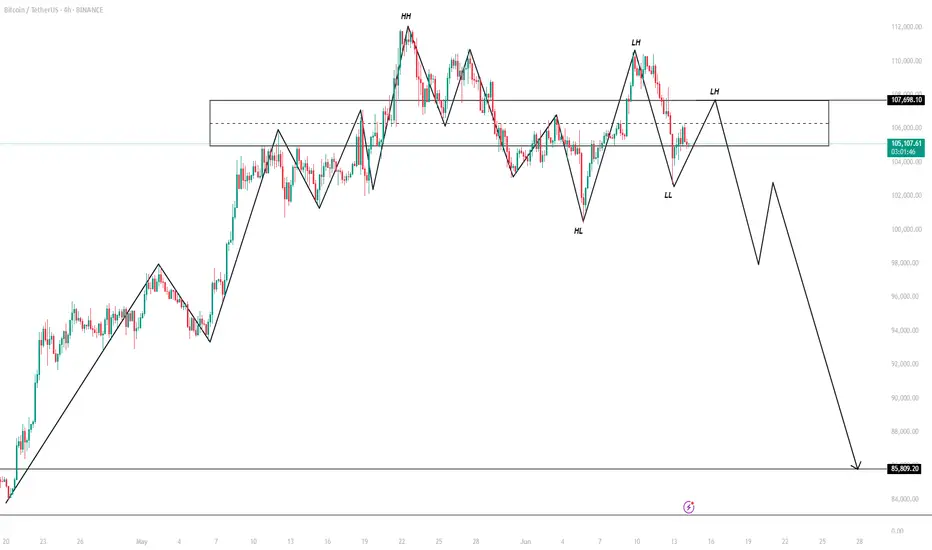
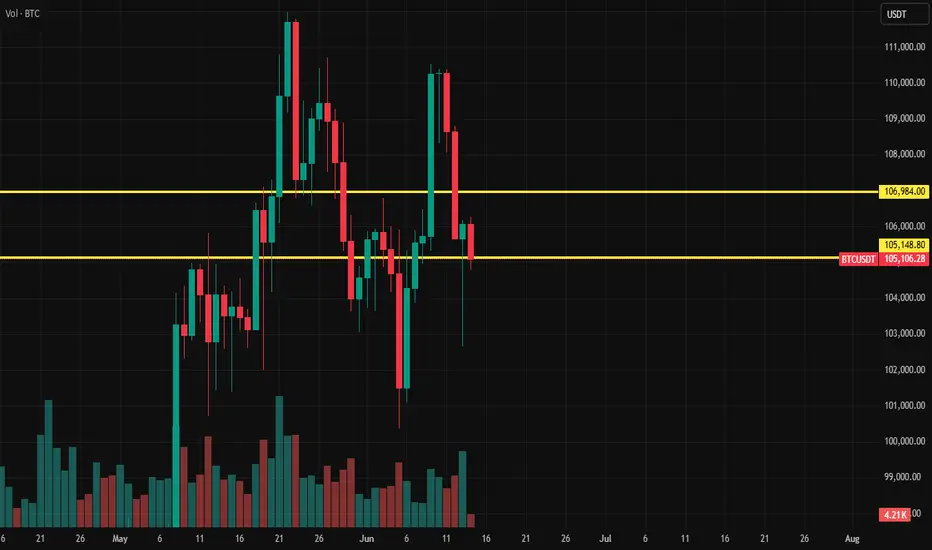
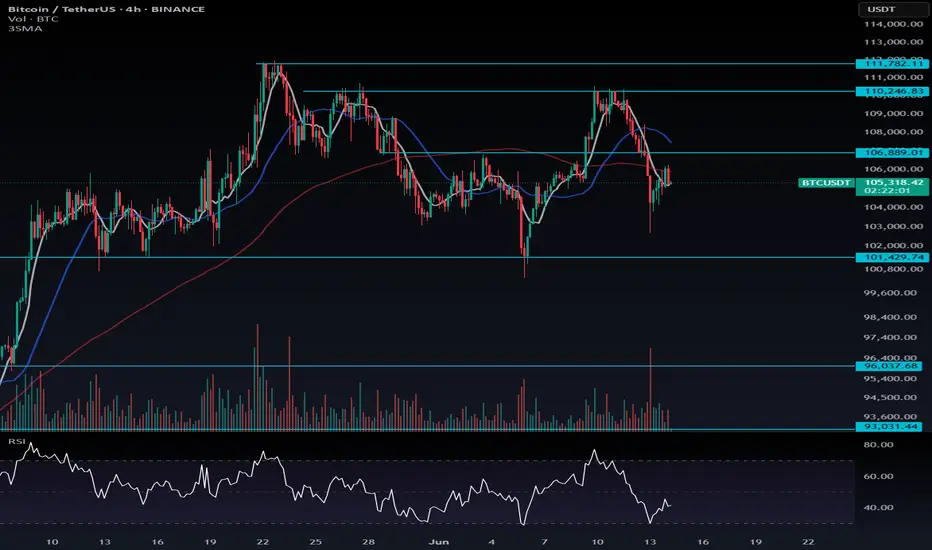
BTC AT DEEP CORRECTION Price failed to break and hold above 111,000, forming a double top or potential lower high structure. Strong bearish drop from 111,000 to 103,500, showing momentum shift to the downside. Likely stop-hunt or liquidity grab below prior lows , Next move will depend on whether it breaks above 107k (bullish) or drops below 103k (bearish).
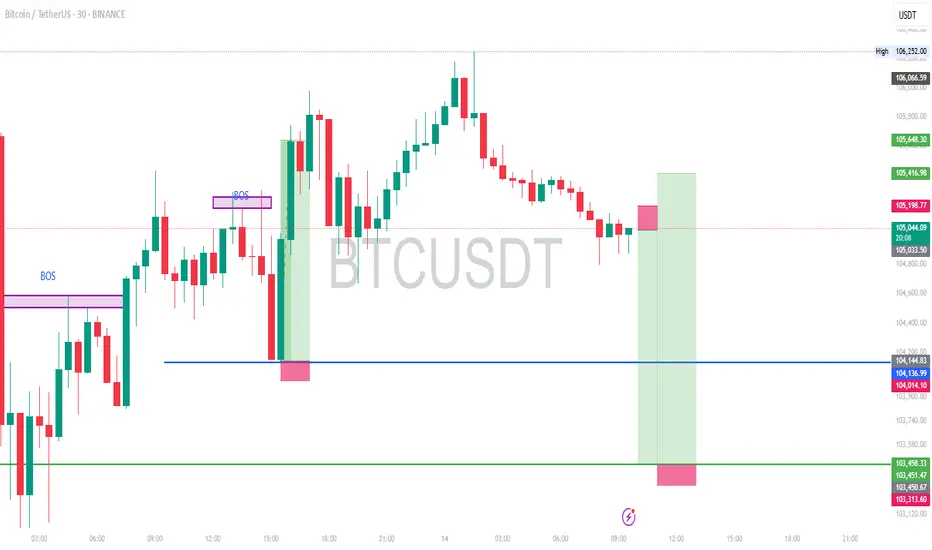
Bull Trap or Just the Beginning? All Eyes on 103kOnce we cleared the 109k ATH, I began tracking this new structure (in blue). Considering the current macroeconomic backdrop, it’s starting to make a lot more sense.
There’s plenty of noise about this being the biggest bull run in recent times, but looking at the chart, FVGs left behind, lack of volume commitment, and inefficient price action… are we actually gearing up for one of the largest bear markets we’ve seen instead?
You really don’t want to see a weekly close below 103k.
Bitcoin long 97kPlanning on a push below 100k over the next few days, I'll be looking for possible entry around 96 - 98k if LTF shows good support.
The monthly open is at 100k so Id expect to see some rejection at that level, there's also a monthly FVG around 97k which price could revisit.
My target will be the BTC highs, areas of interest marked on the chart.

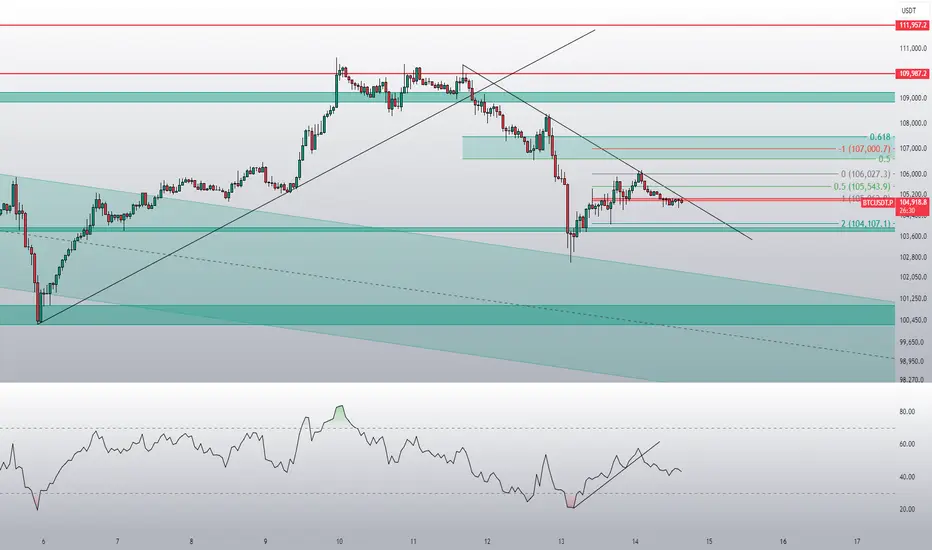
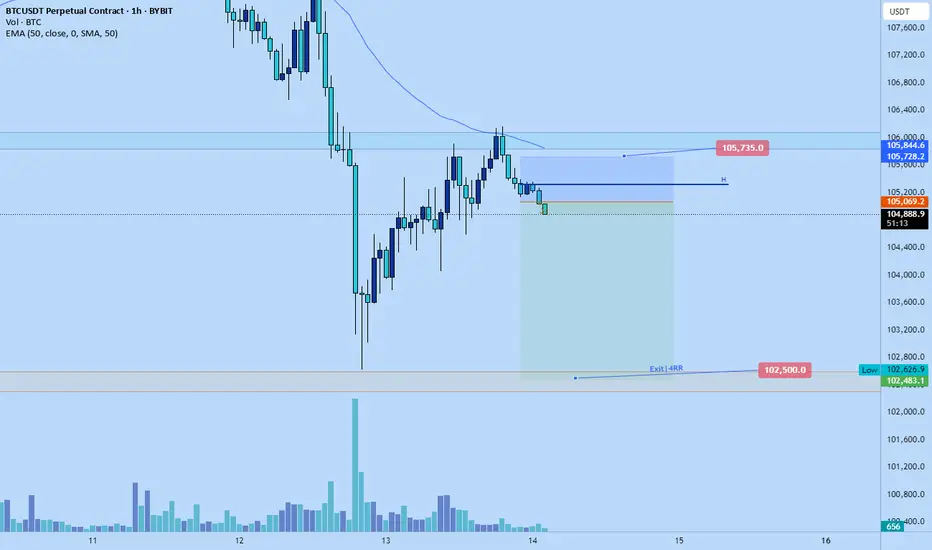
Bitcoin dump to 102500 ...maybe loweerJust recently opened a short position on bitcoin. Aiming for 102500 tp.
Its very evident the market wants to fall.
Getting roughly 4RR from this given plays out.
Stop: $105735
Market is aiming for new lows according to my DTT analysis.
Sidelined Due to Geopolitical Tensions in the Middle East🛑 Sidelined Due to Geopolitical Tensions in the Middle East
Due to the rising geopolitical tensions and the ongoing conflict in the Middle East, I’ve decided to stay out of the market for now. War-related news often triggers short-term volatility, driven more by fear and uncertainty than technical or fundamental analysis. I prefer to wait until the market stabilizes and the emotional reactions fade, allowing for more reliable trade setups.
BTC USDTBitcoin has three months to go in a sideways manner and test the 90,000-89,000 area, even if quickly, then the currency season begins between 116,000-119,000.
BTC - Where it is heading to? Owing to the recent war scenario's the market has taken a slump, seeing pattern its a bearish stance where a pull back down is emminent (means to fall down as drawn in blue) but as its retracing all the move after its fall, expecting a sweep moves to the top as mentioned. till 108k
Bitcoin Weekly: Bullish & Bearish ScenariosThis is the definitive analysis based on the weekly timeframe. Depending on how the weekly session closes the market trend will be defined. Bitcoin is both bearish and bullish. Let me explain.
» If Bitcoin can move and close weekly above $110,000, market conditions are considered bullish and we can expect higher prices.
» If Bitcoin moves and closes weekly below $100,000, market conditions are considered bearish and we can expect lower prices.
» Any trading between $100,000 and $110,000 can be considered consolidation. Since the main move is an advance starting 7-April, the consolidation has a bullish bias; makes sense?
It is a bullish bias but a bullish continuation is not confirmed. Bitcoin peaked the 19-May week, a new all-time high. Then it produced a lower high this week. This implies bearish potential and bearish pressure.
» If this week closes above last weeks high, around $107,000, we can say the bulls are gaining ground.
» If this week closes at the open or lower, say $105,000 or lower, then the bears are gaining the upper-hand a lower low becomes more likely.
It has not been decided, anything goes. Anything can happen because Bitcoin will not die, trading won't end if prices move below 100K. This would simply lead to a bounce and a recovery later down the road.
It also works in reverse, if Bitcoin moves higher, nothing happens, the market will continue to be and exist, it will continue to grow and evolve.
Right now we are mixed, this is a decision point. The action is determined by the price, depending on what prices we get we can know what comes next. Since the week is yet to close, we remain in doubt but the bearish bias has the upper-hand short-term.
Short-term bearish potential is strong based on the ath, triple-top and lower high.
Mid-term the market is in a bullish trend facing resistance. The wave from 7-April through present day.
Retraces and corrections are normal.
Long-term Bitcoin is bullish, because it has been growing since November 2022.
Thank you for reading.
👉 If you would like to see an update when the week closes hit boost!
Namaste.