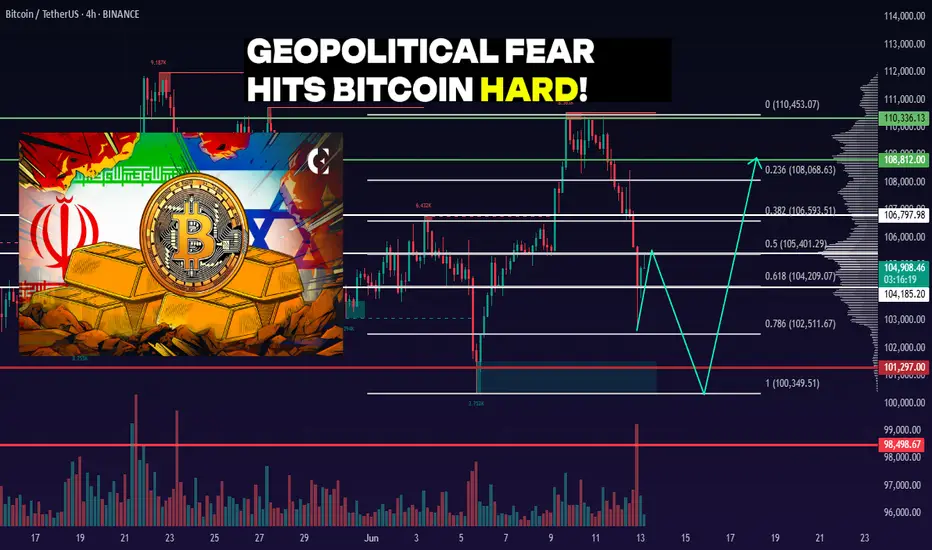
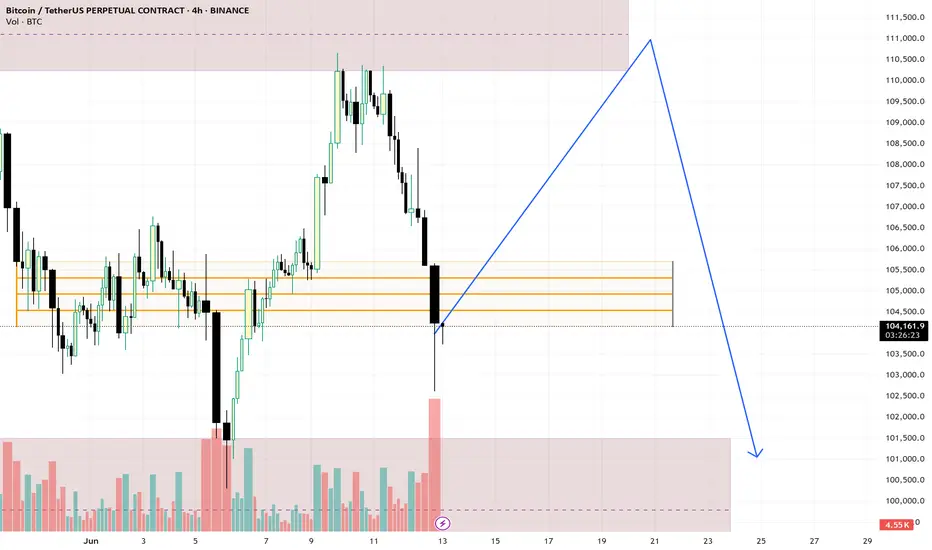
BTC 4H. $104K or Bust — Critical BTC Moment! 06/13/25BINANCE:BTCUSDT remains in a sideways range between $110,336 – $101,297. The main trading volume is concentrated around $103,907.
Recently, the price reached the upper boundary of the range at $110,336 and sharply declined from there — confirming the strength of resistance. The drop was intensified by negative geopolitical news (Israel–Iran tensions).
As a result, BTC retraced into the $104,185 – $101,297 demand zone — a potential area where buyers might step in again.
Personally, I expect one more dip into the $104,185 – $101,297 range to test the strength of buyers.
⚠️ If negative news continues, a breakdown below $100,349 and a new local low is possible.
DYOR.
BTCUSDT.3L trade ideas
Markets Crash: Gold Soars, Crypto Dips!Israel’s strikes on Iran shook markets—Bitcoin and stocks tanked, gold soared. What’s next? Let’s unpack the best trading moves for this chaos!
Hey traders, Skeptic here!👋 Yesterday’s Israeli strikes on Iran’s military and nuclear sites, plus high-profile casualties, sent markets into a tailspin. If your positions got stopped out today, don’t sweat it—that’s normal in this mess. Today, I’m breaking down the most likely scenarios for financial markets, especially stocks and crypto, with no FOMO, no hype, just reason. Stick with me to navigate this storm!
📉Right now, markets are screaming risk-off . Stocks like the S&P 500, indices, and crypto like Bitcoin are bleeding as buyers have zero confidence. Everyone’s piling into safe-haven assets like gold, the Japanese yen, and the Swiss franc. Last night’s news triggered sharp drops in Bitcoin and SPX500, while gold’s rallying hard. This is classic flight-to-safety behavior, and it’s why your stops might’ve been hit. Let’s dive into the geopolitical scenarios driving this and then get to the charts.
📍First, the big picture.
Scenario one: Iran retaliates for Israel’s strikes, and we’re stuck in a tit-for-tat escalation for weeks. Markets stay risk-off, stocks and crypto keep sliding, and safe havens like gold thrive.
Scenario two: The US-Iran nuclear talks on Sunday, June 15th, lead to a deal, tensions cool, and markets stabilize. If those talks fail, I’m not optimistic— recent US inflation relief, might’ve pushed the Federal Reserve toward rate cuts to boost markets. Without de-escalation, rate cuts won’t save risky assets, and we’re looking at muted growth for crypto and stocks.
But if a deal happens, markets could rip—Bitcoin might hit $130K short-term and even $170K as the bull run’s ceiling. For now, uncertainty rules, so let’s see what the charts say.
👀 Let’s start with Bitcoin on the daily.
The first major support is $100K-$101K. If we lose that, we’re looking at a 3-4 month time-based correction . I know some of you see Bitcoin’s dip and think it’s a bargain, but hold up—if tensions escalate, breaking $100K-$101K is almost guaranteed. We could slide to $95K (0.382 Fibonacci retracement) or even $86K (0.618 retracement). No buying until Tuesday’s clarity—too risky. Shorting? Also a bad idea. After this sharp drop, where do you put your stop-loss? An 8% stop is the minimum, which trashes your risk-reward ratio. Best move? Sit tight, no positions, and wait for the dust to settle.
📈 Gold’s the star in this risk-off market.
On the 4-hour, as we said in last week’s watchlist, it broke the descending channel’s ceiling at 3333.86 and pulled back. Using our trick of cloning the prior channel and placing it above, it’s reacting perfectly at the new channel’s midline. A break above 3434.35 could push us to the channel ceiling at 3550.13 . Personally, I’d wait for more ranging here before going long—stops are too wide right now for a clean entry. If you caught our 3340 long trigger from the watchlist, you’re sitting pretty— just hold . Gold’s got more upside potential, but if you’re not in, don’t FOMO. Wait for a better setup.
🎯 Our EUR/USD long trigger from last week’s watchlist at 1.14555 was a winner
if you took it, you hit your risk-reward target and likely locked in profits. Nice work! The new long trigger is a break above 1.16142 resistance. No short triggers here, just like gold. With both major and secondary trends screaming uptrend, shorting against the flow is nonsense. I’d wait for key levels to break and confirm a bearish shift before even thinking about shorts. Trade with the trend, always.
📝our plan: Gold longs above 3434.35 target 3550.13; hold 3340 entries or wait for a range. EUR/USD longs above 1.16142, no shorts. Risk max 1% per trade, set alerts, and stay patient—geopolitical chaos means no FOMO moves.
I hope for a day with no wars, where we can focus on what matters—building value and humanity.🤍
That’s today’s breakdown, traders!
If this helped, smash that Boost button and Follow for more no-hype analysis. Drop a comment—what’s your next move? Want a coin or market analyzed? This is Skeptic, stay safe, protect your capital, and see you next time! <3
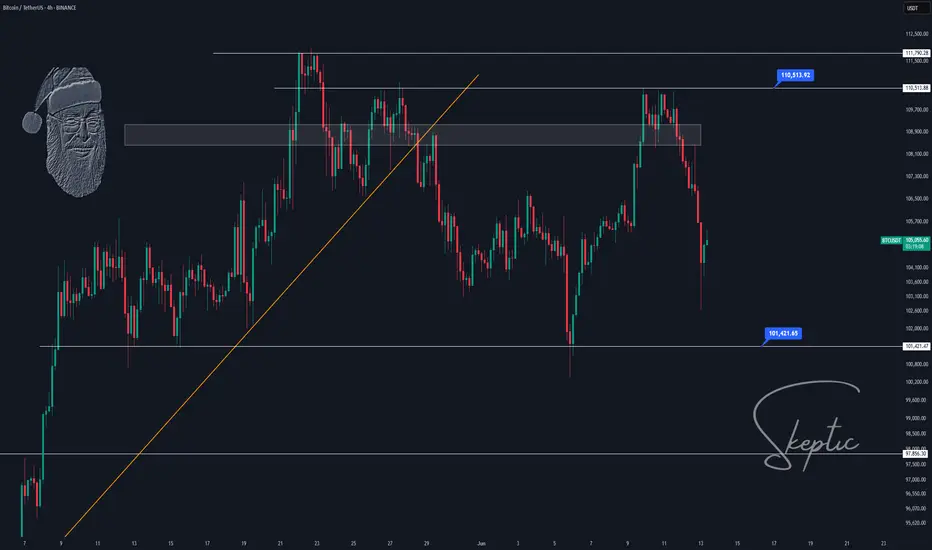
DeGRAM | BTCUSD correction from the 110k level📊 Technical Analysis
● Price has reclaimed the rising-channel median at ≈106.8 k and immediately made a higher-high on expanding volume; hourly RSI also pierced its two-week bear trend, flagging fresh upside energy.
● An ascending triangle is forming between 107 k support and a 109.5 k ceiling; its measured move coincides with the red supply/upper rail at 111.6-112 k.
💡 Fundamental Analysis
● Softer US PPI (-0.1 % m/m) dragged real 2-yr yields to one-month lows, easing dollar pressure, while spot-ETF desks soaked up another ≈4 600 BTC this week, signalling renewed institutional demand.
✨ Summary
Stay long above 107 k; triangle break over 109.5 k unlocks 111.6 k then 115 k. Long view invalidated on a 4 h close beneath 103 k.
-------------------
Share your opinion in the comments and support the idea with a like. Thanks for your support!

Bitcoin just gave a masterclass on Effort vs. Result.War news? Massive sell volume? No breakdown.
✅ Held and reclaimed the 200 EMA
✅ Price stayed elevated despite heavy effort to push it down
This is bullish divergence in action:
Big effort, little result = strength.
🎯 If this holds: $71.8K → $73.6K → $75K are in play.
Bears failed. Structure stands. Follow price, not panic.

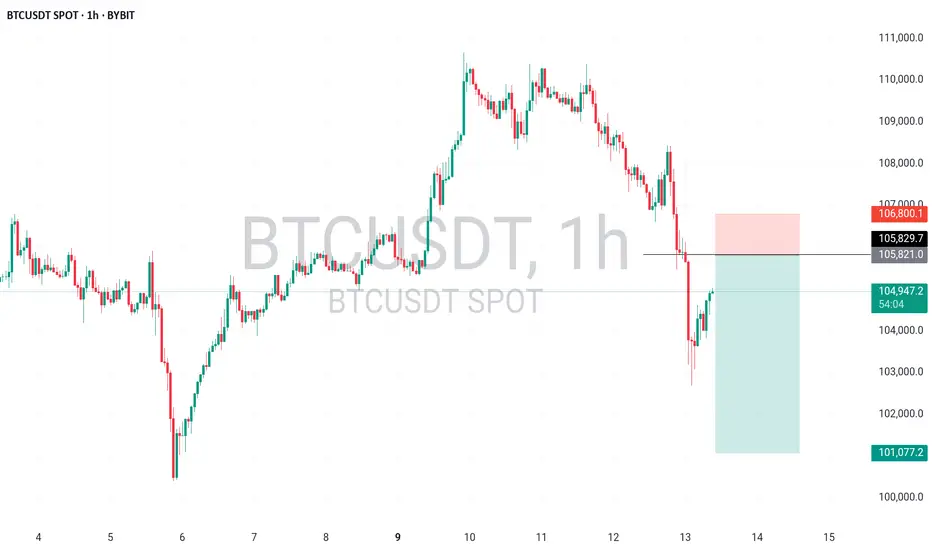
BTCUSDT ShortBTCUSDT – Watching 105.8K–106.5K Supply Zone
Price currently retracing after a strong dump from 108K. I'm eyeing the 105.8K–106.5K zone for a potential short — previous order block + premium zone for smart money selloff. If price rejects there, I’ll target 103.5K and possibly 101K. SL above 106.8K.
Structure still bearish until proven otherwise.
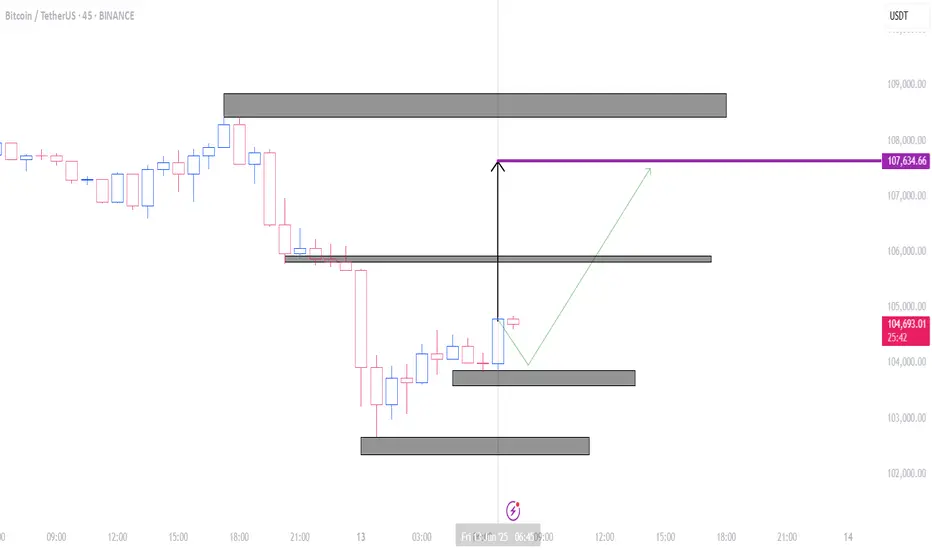
btc movement in 45minAfter the formation of strong bullish candles, in my opinion, an upward movement can be expected. The targets are shown on the chart.
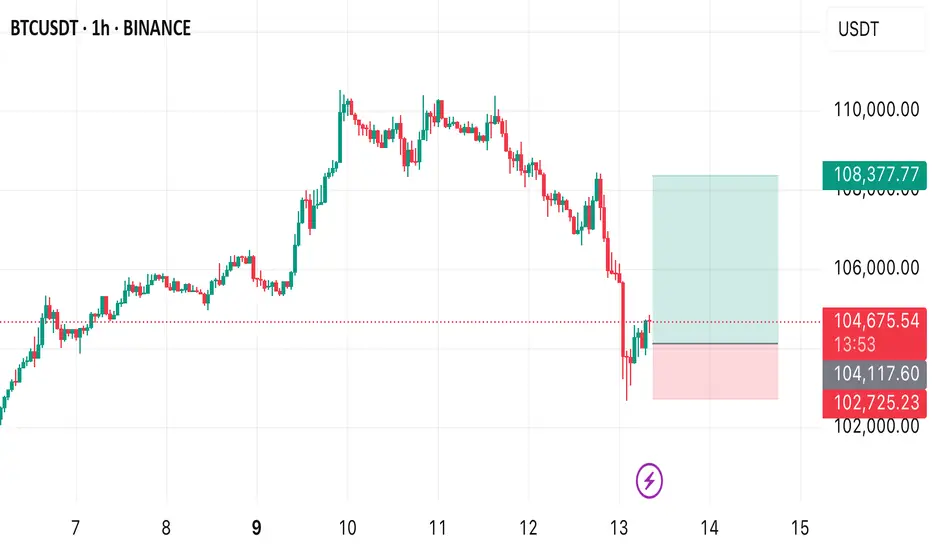
A BUY OPPORTUNITY ON BTCUSDPrice currently trade at 104,730.33 In today’s analysis, I anticipate a buy opportunity to emerge from the current market price. I expect price to rise up to 108,377.77
A buy opportunity is envisaged.
Signs of manipulation or ‘trapping’ behavior!Bitcoin (BTC) is currently approaching a key support level on the chart. This support zone is an area where price has historically shown a tendency to hold or bounce back upward due to increased buying interest. At this stage, there is a possibility that BTC could initiate a bullish move or a price pump from this level. However, it’s important to be cautious, as the market could also exhibit signs of manipulation or ‘trapping’ behavior.
In such scenarios, what often happens is that before making an actual upward move, the market might perform a ‘fake move’—this means it could temporarily dip below the support level or show some downward pressure to shake out weak hands or trigger stop-losses. This false breakdown creates panic and uncertainty, only for the price to reverse and then begin moving upward shortly afterward.
If the support holds and buyers step in with enough strength, BTC could gain bullish momentum and head toward the upper liquidity areas. These zones typically have a high concentration of pending orders (such as stop-losses or take-profits), which can attract the price like a magnet. This liquidity often sits just above recent highs or resistance levels, and reaching this area could result in further volatility.
However, traders are strongly advised to remain vigilant and not rely solely on assumptions. The crypto market is highly unpredictable, and price action can be deceptive. Always perform your own in-depth analysis, consider various technical and fundamental factors, and manage your risk wisely.
This is not financial advice please Do Your Own Research (DYOR) before making any trading decisions.
BTC - setupWe’ve just broken through the trend reversal zone.
My buy order got triggered, which means my $BTCV position — initially opened at $101.000 — has now been scaled up.
My stop-loss is set just below the 0.786 level, around $102.000
LFG 🚀
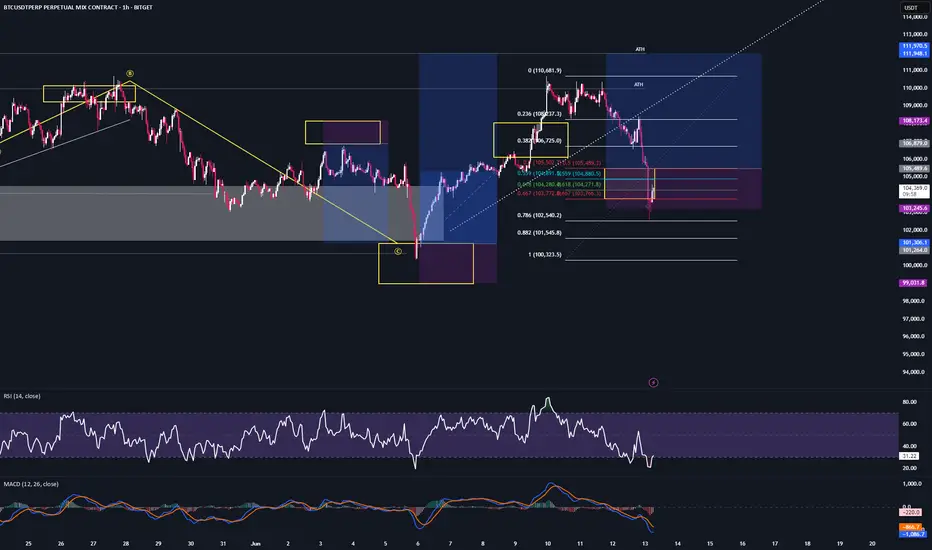
BTC Short-term selling pressure due to war news💎 BTC PLAN UPDATE (June 13)
NOTABLE NEWS ABOUT BTC:
Prices of Bitcoin (BTC), Ethereum (ETH), and Ripple (XRP) slipped as rising geopolitical tensions between Israel and Iran sparked a wave of risk aversion across crypto markets. As uncertainty deepens, the three largest cryptocurrencies by market capitalization are on track to close the week in the red, with current price action signaling the potential for a deeper correction.
Bitcoin bears regain control
After failing to reclaim its all-time high of $111,980 earlier in the week, Bitcoin lost upward momentum and began a steady pullback, slipping below key support at $106,406 on Thursday. As of Friday, BTC continues its downward trajectory, hovering near the 50-day Exponential Moving Average (EMA) at $102,447.
TECHNICAL ANALYSIS PERSPECTIVE:
We successfully identified the peak at the 110K resistance level. As predicted, BTC dropped $7,000 following disappointing CPI and PPI reports. Currently, the price has fallen back into a descending channel pattern and is expected to decline further.
Bitcoin’s upward trend is under threat as funding rates become more constrained.
Earlier this week, Bitcoin hovered near its all-time high of $111,980, but market sentiment remained alarmingly cautious—likely due to uncertainty in the macroeconomic environment.
The path of least resistance is gradually shifting downward, especially as the Relative Strength Index (RSI) falls to the midline at 50 from a recent high of 64 on the daily chart. Traders will look for bearish confirmation signals from the Moving Average Convergence Divergence (MACD) indicator—signaled when the blue MACD line crosses below the red signal line.
Watch for long positions around the 100K price area, with a target back to 103K. If the price breaks below the 100K support level, we should avoid holding onto a bullish bias.
At this time, whether you’re a newcomer or experienced trader, it’s advisable to spend time practicing and reinforcing technical analysis knowledge. Explore educational posts on the channel to build a stronger foundation and avoid potential losses.
==> This analysis is for reference only. Wishing all investors successful trades!
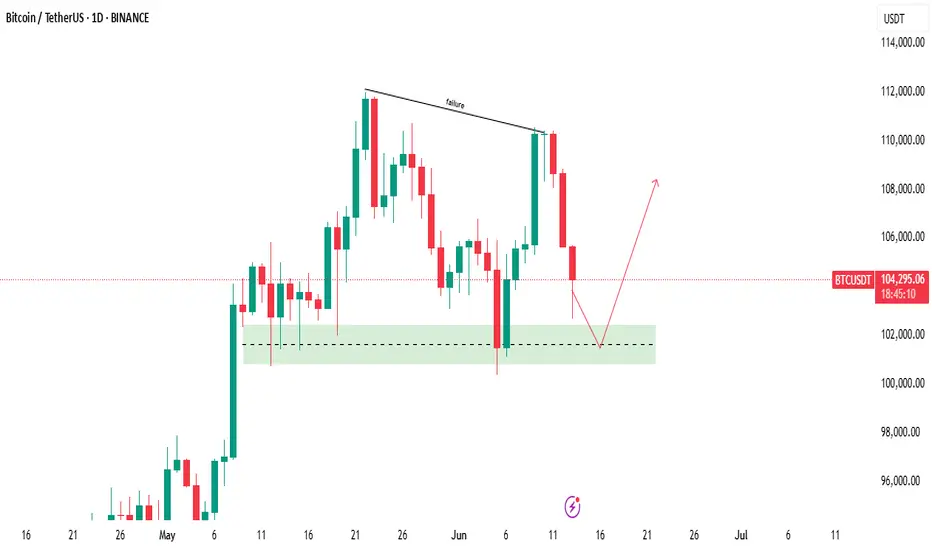
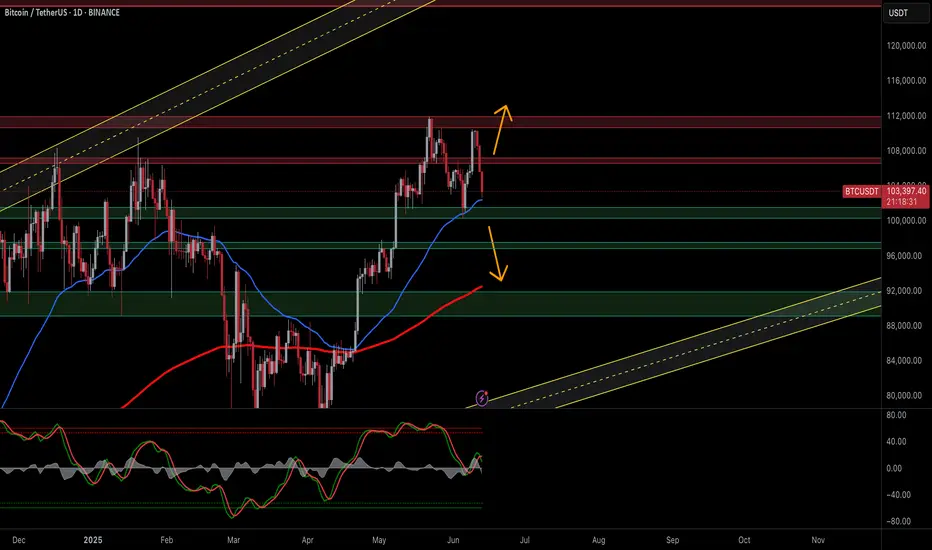
$BTC/USDT 1D Quick Analysis$BTC/USDT 1D Quick Analysis
Bitcoin is under pressure after rejecting the $112K–$113K resistance zone. It’s now testing key demand at
$ 101,000–$ 104,000.
If bulls defend this zone, a short-term bounce toward $ 107,000–$ 109,000 is possible.
But if $101K breaks, BTC may correct deeper toward $91K.
The structure has turned bearish.
Watch this demand zone closely.
DYRO, NFA

Bitcoin Key Market Structure Update
🔑 ZemoG Trading — Bitcoin Key Market Structure Update
As outlined in our previous analysis, a decisive close below 109.6k signaled the start of Bitcoin’s anticipated decline, pushing price action toward completing the right side of the unfolding market structure cycle.
BTC has now tapped 103.6k, a significant wick level and established point of control — areas where liquidity hunts and sharp reversals are not only possible but expected.
Whenever price strikes these structural pivots, the market seeks to rebalance by sweeping residual wicks before resuming the primary trend.
🔍 What’s Next?
For our upcoming short entry opportunities, we are watching for precise reactions and rejection patterns at the following upper wick clusters:
104.6k
105.3k
105.8k
106.4k
107.1k
108.2k
108.8k
🎯 Short-term Downside Targets:
102.3k (interim support)
101.4k (secondary profit zone)
100.6k (key structural break level)
A confirmed close below 100.6k will validate further downside continuation and unlock the next leg of the sequence.
🧭 Key Takeaway:
Patience and precision are your greatest allies. Wait for the key levels and execute with discipline.
1️⃣1️⃣
♾️ Trust the sequence. Respect the reversal. Repeat the mastery.
— ZemoG Trading

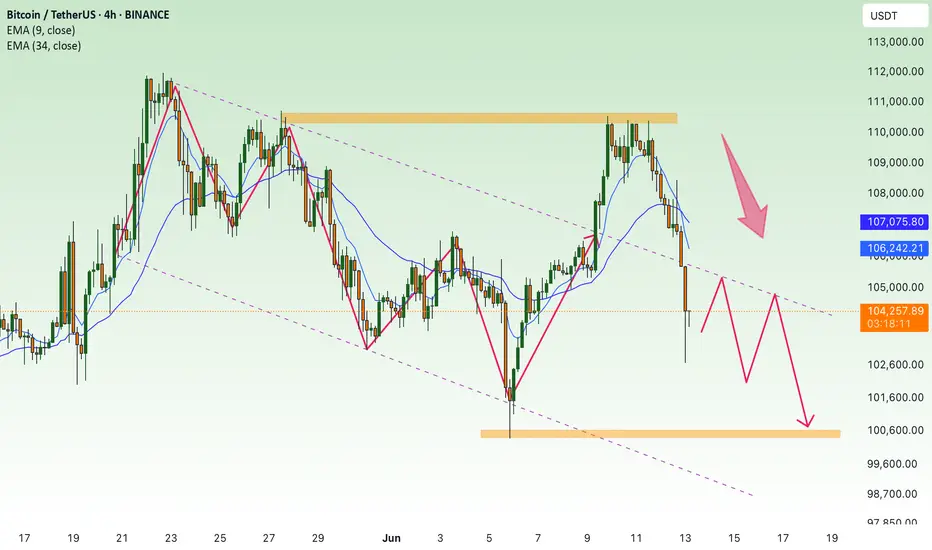
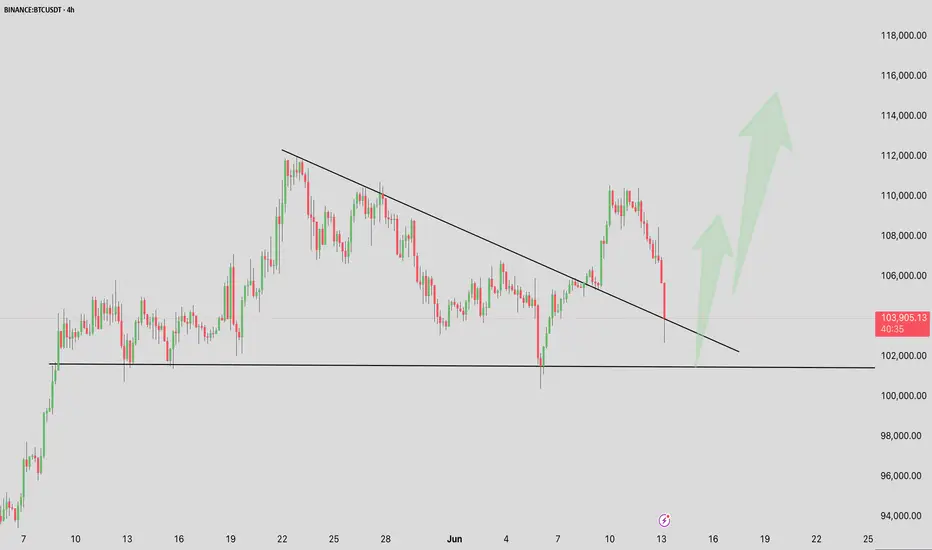
BTC/USDT 4H Chart Update –BTC/USDT 4H Chart Update –
After a strong rejection from the $110K+ zone, Bitcoin is now retesting a critical trendline support on the 4-hour chart.
Key Highlights:
Price dropped sharply to $103K, almost tagging the key ascending support zone.
The previous breakout from the descending trendline is now being retested, which is a classic bullish retest pattern.
If bulls defend this region successfully, expect a potential bounce towards $108K–$ 114 K.
However, a clean breakdown below $102K would shift short-term momentum bearish.
Eyes on this zone. High-probability decision area.
Watch for reaction candles and volume spikes to confirm the next move.
Thanks for your support!
DYOR. NFA
BTC Reacts to Iran–Israel Escalation: Risk-Off Sentiment GrowsBitcoin (BTC/USDT) — Caught Between Fear & Fundamentals
Technical Outlook — 13 June, 2025
Current Market Condition:
Bitcoin has dropped to $103,818 after facing rejection from the $106.8K–$108K resistance zone, coinciding with heightened geopolitical stress following renewed military escalation between Iran and Israel. Traditional markets are showing signs of risk aversion, and while Bitcoin is often seen as a hedge, the current flight to USD liquidity and defensive assets is putting pressure on high-beta instruments like crypto.
The psychological $100K support zone, which aligns with the EMA 50 and a key Fib level, is the immediate area to watch. A failure here could expose Bitcoin to deeper retracement toward $96,800 and potentially $92K, especially if global tensions worsen or investors rotate further into cash and gold.
Key Technical Highlights:
Rejection at supply zone near $106,888–$108,000.
Support at $100K holds structural and psychological importance.
Stochastic shows bearish momentum crossover, increasing downside probability.
EMA 200 at $92K could act as ultimate cushion in a full-blown correction.
Volatility likely to remain elevated amid Middle East conflict and global uncertainty.
Trade Plan:
🔼 Bullish Relief Bounce (Long Bias):
Trigger: Reclaim and hold above $106,888 with rising volume
Target: $108K → $112K → $116K
Stop Loss: Below $103,500
🔻 Geopolitical Risk Sell-Off (Short Bias):
Trigger: Break and close below $100,000
Target: $96,816 → $92,000 → $88,000
Stop Loss: Above $102,500
📉 Dip Buy Strategy:
Trigger: Price stabilizes at $96.8K with divergence and calming geopolitical headlines
Target: $103K → $106K
Stop Loss: Below $95K
🛡️ Risk Management Note:
With geopolitical risk driving short-term sentiment, expect volatility spikes, whipsaws, and fake breakouts. Remain nimble and manage exposure carefully — especially during weekend sessions when crypto trades unhedged and news developments can occur without warning.
📢 If you found this analysis valuable, kindly consider boosting and following for more updates.
⚠️ Disclaimer: This content is intended for educational purposes only and does not constitute financial advice.
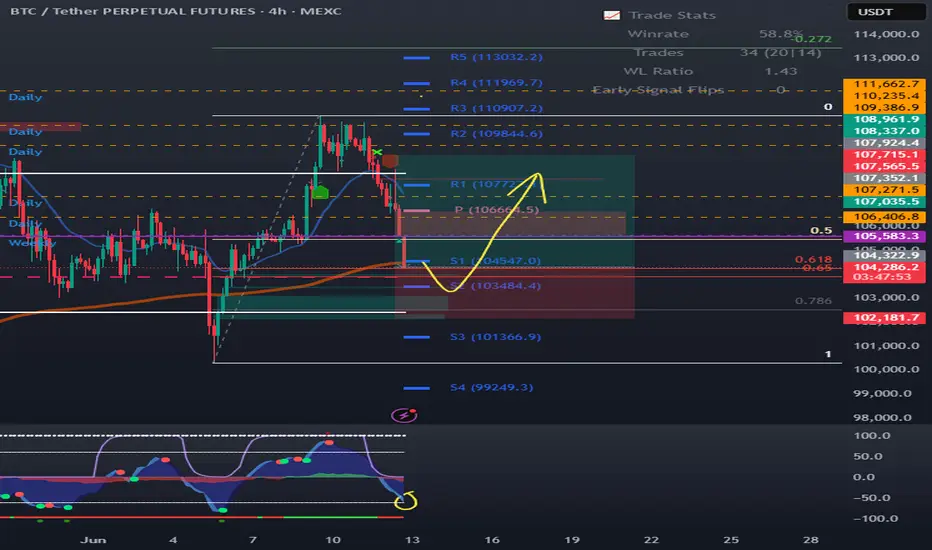
BTC 4hr POC, 200EMA, Golden pocket confluenceBTC 4hr POC, 200EMA, Golden pocket confluence.
Looking at smaller timeframes for bullish divergence for entry.
This could be the bounce to test new ATH.
Break of all these support will be a big drop.
Bitcoin Double Top FormationIf we lose 102k we will dump to 97-93k and alt will rugged
but if we can hold maybe sideway and retest 110k again

BTC down to 70k...maybeI've been saying this for a while now -> Most people are just not ready for BTC volatility. It may go up to 150k one day, but NOT before it hits a few trees first and maybe a cat. Best offset here is UVIX (think market volatility insurance, up +6% earlier today), Gold, and Oil now that things are heating back up again!
Best of luck and always do your own DD!

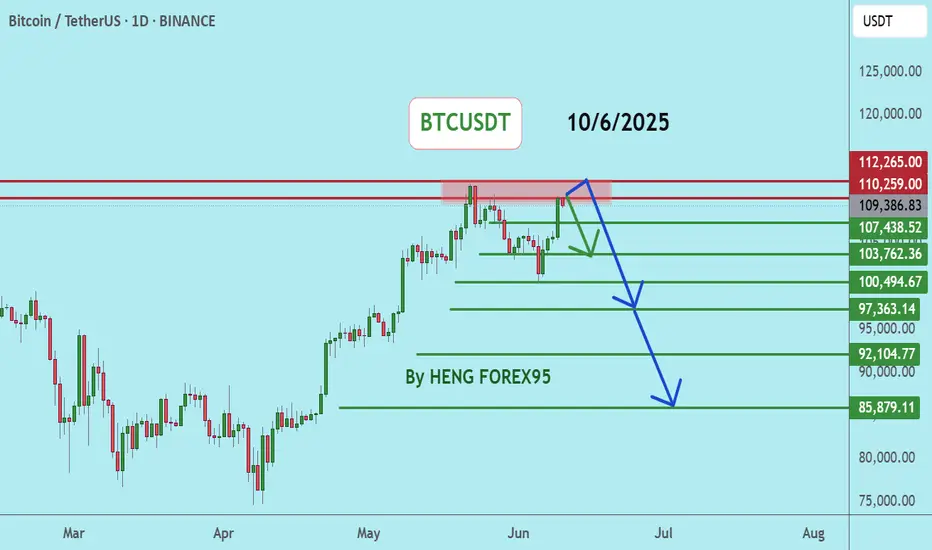
BTCUSDTBTCUSDT price is now near the resistance zone 110259-112265. If the price cannot break through the 112265 level, it is expected that the price will drop. Consider selling the red zone.
🔥Trading futures, forex, CFDs and stocks carries a risk of loss.
Please consider carefully whether such trading is suitable for you.
>>GooD Luck 😊
❤️ Like and subscribe to never miss a new idea!
BTC - On its way down from these trendlines How low can we go? We will find out.
Three bearish intersecting trendlines above.
Short began initiating from above as per my previous post.
I personally am not ruling out a flash crash to 10,000.
DXY is breaking down a major bearish trendline on the weekly / monthly - Market has a prime opportunity to manipulate Bitcoin into all of these long stop losses and trigger a massive liquidation event.
Stay alert and safe!

BTC bearish outlook going as planned Just as analysed , by is dropping, I would want to see price take out his 4h low , and also ,mitigate the 95k level

BTC 4HR Fair value gap/golden pocket trade to POCBTC 4HR Fair value gap/golden pocket trade to POC.
2:1 risk reward and maybe let a little bit run in case we go banana bull mode.
bitcoin for long *The content on this analysis is subject to change at any time without notice, and is provided for the sole purpose of assisting traders to make independent investment decisions.
