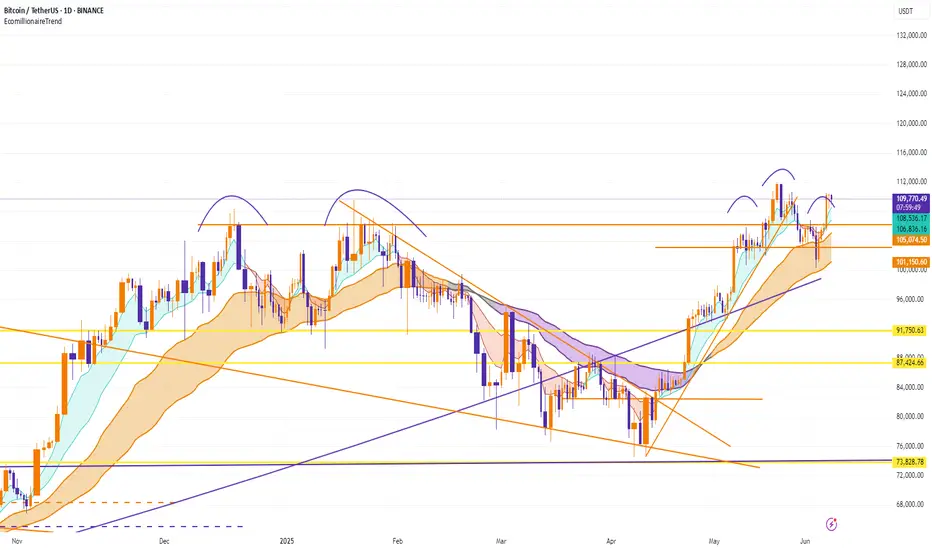
BTCUSDT – Bearish signs emerge below resistanceAfter a strong bullish run, BTCUSDT is now showing clear signs of weakness near the resistance zone around 109,600–112,000. Price action has formed a cluster of rejection candles at the top, failing to break above this key level – signaling that selling pressure is gaining control.
The current structure suggests a potential trend reversal, especially as the latest bearish candle came with rising volume, confirming selling interest from the supply zone. If the price breaks below the 101,500 support, BTC may continue dropping toward the 93,500–84,500 range – a high-liquidity area on the volume profile.
The previous bullish momentum appears to have lost strength, and this pullback may be confirming a shift after reaching its upper limit. As long as BTC remains below the 112,000 resistance, the bearish bias remains dominant.
BTCUSDT.3L trade ideas

a scalp long opportunitya scalp long opportunity- btc forming a downle bottom a small scalp opptunity to 109500 and if possible 110000. lets see
GME COLLAPSE - NET SELLOFF - MARKET ANALYSISGameStop (GME) is dropping in after-hours trading following its $1.3 billion convertible senior notes offering, which investors see as potential dilution. Similarly, Cloudflare (NET) is also falling due to concerns over its $1.75 billion convertible debt offering, which could impact shareholder value.
On the flip side, Oracle (ORCL) surged after reporting strong Q4 earnings, with cloud infrastructure revenue expected to grow over 70% in fiscal 2026. This could provide a tailwind for the broader cloud sector.
The market’s pullback today was much needed, with many stocks retesting key breakout zones

BTC - setupWe’re currently trading near the all-time high.
If we get rejected from this region, I’ll look to scale up my position in the trend reversal zone between $103,700 and $105,500.
A breakout in the near future (June) is highly likely.
I’m positioned accordingly
LFG 🚀
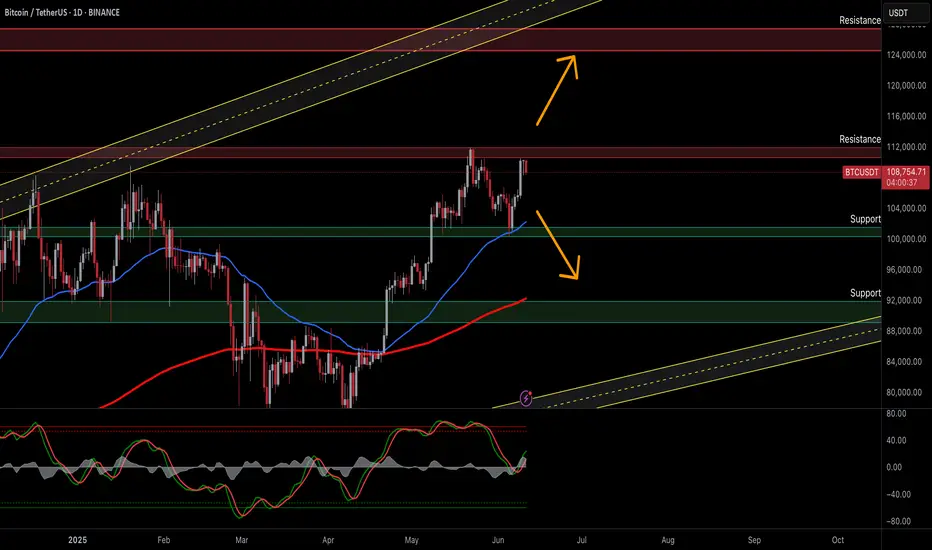
Bitcoin at the Crossroads: Will BTC Breakout or Retest SupportBitcoin (BTC) – Testing Resistance, Ready for Reversal or Breakout
Technical Outlook — June 11, 2025
Current Market Condition:
Bitcoin (BTC/USDT) is currently trading around $108,644 following a modest decline of -1.48% on the daily chart. After a bullish recovery from the $92,000–$96,000 zone, BTC has approached a strong resistance band near $112,000. The current structure suggests the market is in a critical phase — either poised to break higher or risk a deeper retracement toward key demand levels.
Key Technical Highlights:
Price is trading above the 50 EMA (blue) and the 200 MA (red), suggesting a bullish short- to medium-term bias.
The $112,000 zone is acting as a strong resistance, where BTC has previously faced rejections.
The ascending yellow parallel channel outlines the broader uptrend structure — BTC remains well within bounds, showing potential for continuation.
The Stochastic Oscillator is climbing, indicating building bullish momentum but nearing overbought territory, which could trigger short-term pullbacks.
Immediate supports are found near $104,000 and $96,000. A failure to hold above $104,000 could trigger downside pressure.
Trade Plan:
✅ 1. Bullish Breakout (Long) – Most Probable Scenario
Trigger: Daily close above $112,000 with strong volume and momentum
Target: $122,000 - $125,000
Stop Loss: Below $109,000
⚠️ 2. Bearish Rejection (Short) – Possible Scenario
Trigger: Bearish reversal candle at $112,000 or daily close below $106,000
Target: $102,000, then $92,000
Stop Loss: Above $111,000
📉 3. Dip Buy Setup – Last Scenario
Trigger: Price retests and holds $96,000 or $92,000 with a bullish reversal signal (e.g., pin bar, hammer)
Target: Immediate resistance at $104,000, then $112,000
Stop Loss: Below $91,000
Risk Management:
Always apply proper risk management, including clear stop-loss placement and responsible position sizing. Bitcoin can react aggressively to macroeconomic events and regulatory news — monitor sentiment closely when near major technical levels.
📢 If you found this analysis valuable, kindly consider boosting and following for more updates.
⚠️ Disclaimer: This content is intended for educational purposes only and does not constitute financial advice.
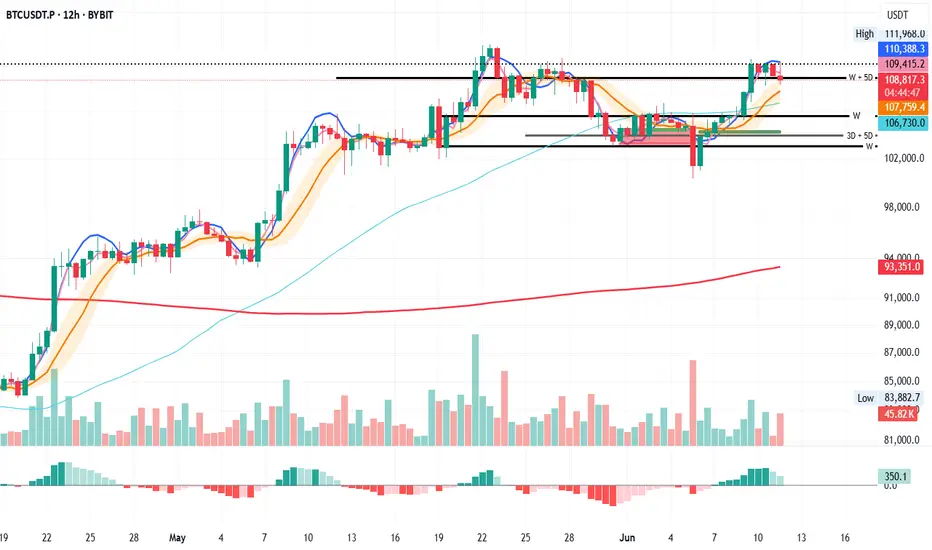
Bitcoin's Support in Focus: Stay Alert for Candle Closes
BTC on the 12H looks ready to close below the recently claimed W + 5D support.
It’s a signal to stay sharp and stick to a solid plan: but not a call to action just yet.
Let’s see how the next 3 to 5 candle closes unfold.
Always take profits and manage risk.
Interaction is welcome.
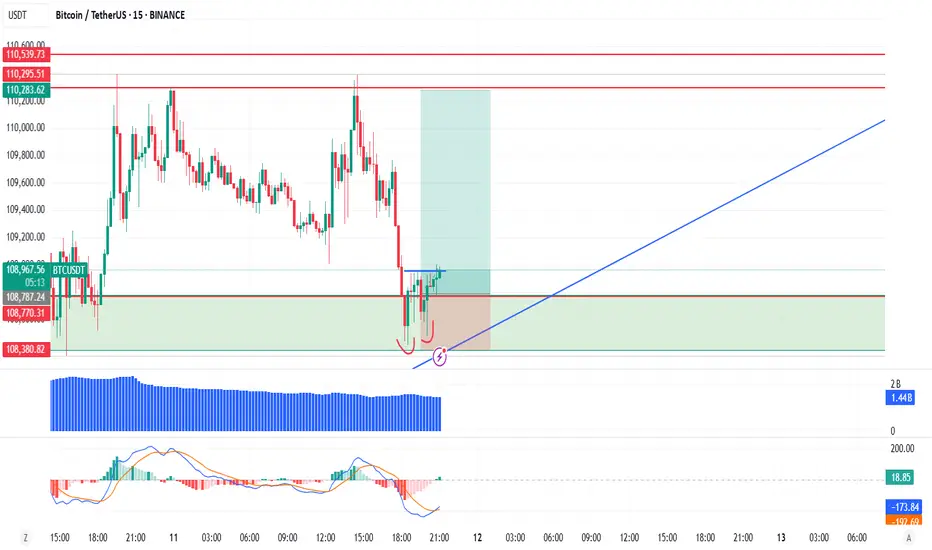
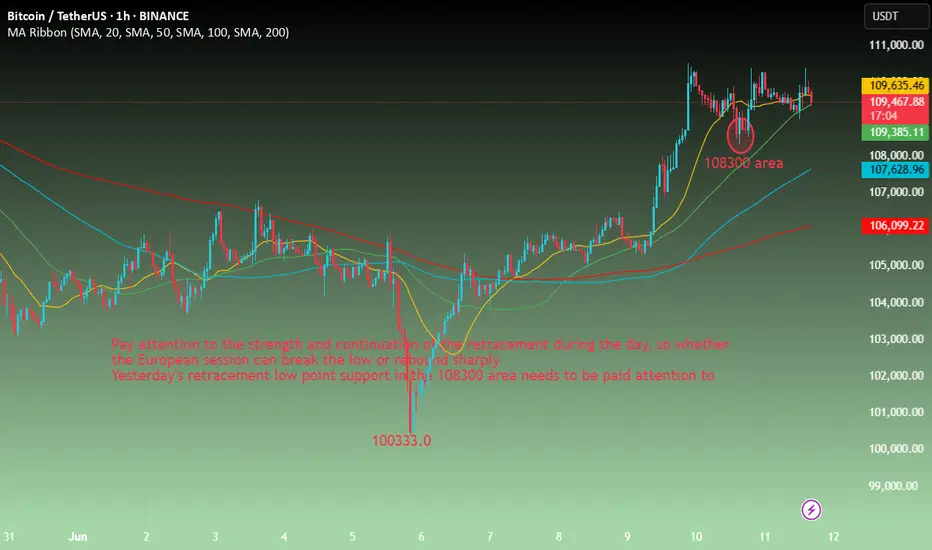
BTC-----Sell around 109500, target 108500 areaTechnical analysis of BTC contract on June 11:
Today, the large-cycle daily level closed with a small positive line yesterday, and the K-line pattern continued to rise. The price was above the moving average. The attached indicator was golden cross. The general trend of the rise was relatively obvious, but it should be noted that the large upward trend last week caused the current daily price to deviate from the moving average. Then the return to the moving average is a correction and retracement trend. The support position is near the 107000 area, so pay attention to avoid the risk of retracement; the short-cycle hourly chart yesterday's intraday retracement correction European session continued the US session support rebound, but did not break the previous high position. Today, the current pressure retracement, the K-line pattern continued to be negative, so the intraday still has to go through the retracement trend, the low point support position is 108300 area;
BTC short-term contract trading strategy:
sell at the current price of 109500, stop loss in the 110000 area, and the target is near the 108500 area;
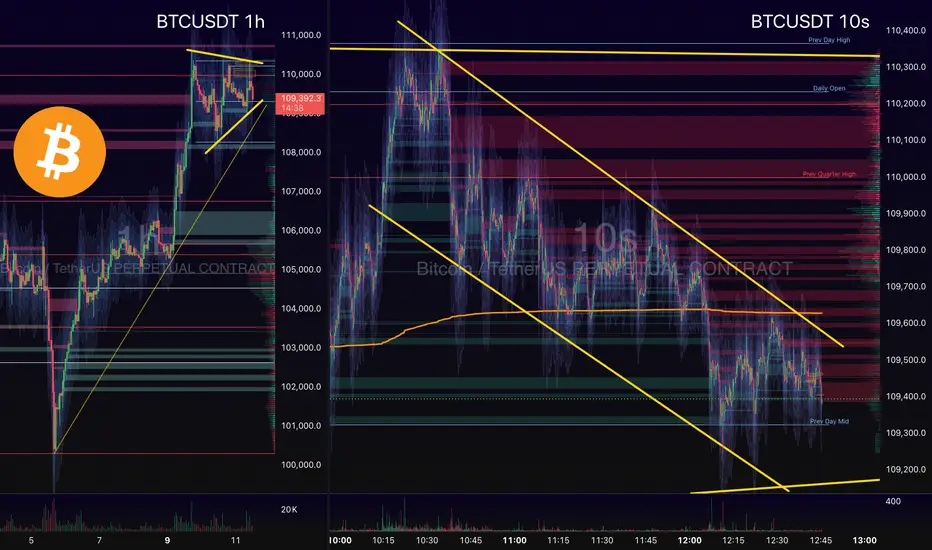
Layout TestHello World
HTF - 1h timeframe on left
LTF - 10s timeframe on right
FVG zones and Volume Profile
Key Levels
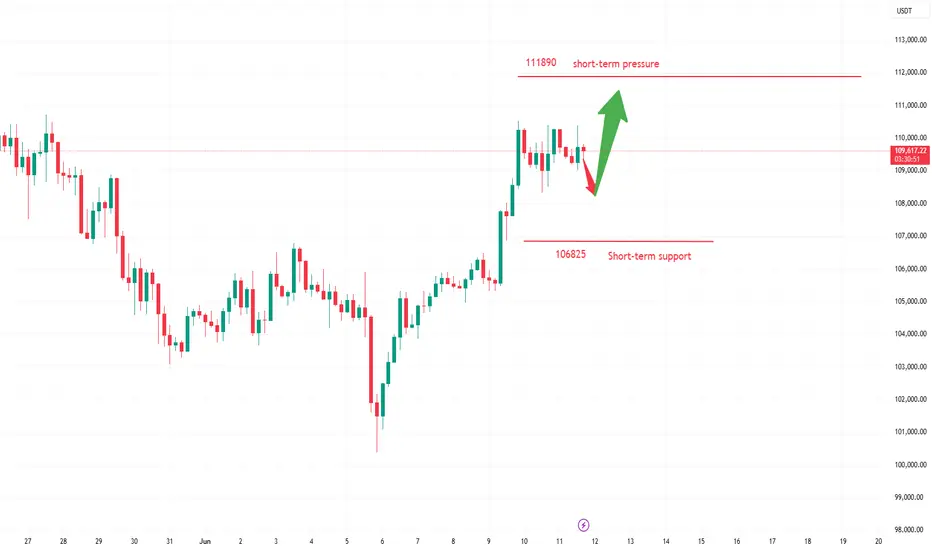
"Accumulation Phase for Breakout"Bitcoin underwent high-level consolidation on June 11, with intraday volatility ranging from $108,800 to $110,200. It failed to effectively break through the previous high of $111,980. The 24-hour global liquidations amounted to $210 million (half of the previous day), with short positions accounting for 62%, indicating that bears still dominate short-term sentiment.
The Sino-US high-level talks in London originally scheduled for June 11 have been postponed to June 15, and the details of tariff reductions remain unclear, leading to a decline in risk asset appetite. The US Dollar Index rebounded by 0.8%, suppressing Bitcoin's breakthrough momentum. Bitcoin is currently in a accumulation phase for breaking through all-time highs, with policy regularization and institutional increasing holdings forming long-term support.
Humans need to breathe, and perfect trading is like breathing—maintaining flexibility without needing to trade every market swing. The secret to profitable trading lies in implementing simple rules: repeating simple tasks consistently and enforcing them strictly over the long term.
Trading Strategy:
buy@108000-108500
TP:110500-111000
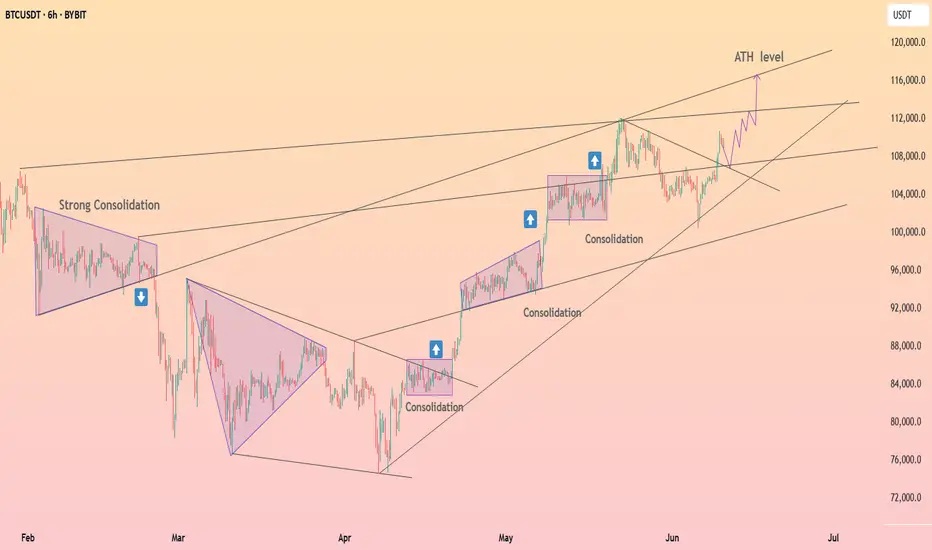
BTCUSDT – Strategy and Trend Probabilities for 2025In my opinion, Bitcoin (BTC) has become less interesting — there isn’t much room left for significant movement, and most of the “cream” has already been skimmed off. However, since it's essentially the index of the crypto market, I’m sharing this trading idea for context - to show where we currently are and what scenarios might unfold.
The price is globally moving within an ascending channel.
A secondary triangle pattern is forming.
Within this triangle, we can see the outlines of an inverse head and shoulders pattern - or possibly a cup and handle - both aligning with the channel’s resistance.
Potential scenarios:
a) Price breaks out of the triangle.
b) Price moves toward the triangle’s support, forming another wave inside it.
c) Price moves to retest the main ascending channel’s support.
d) Price fluctuates within the central range of the channel.
There aren't many options, and none of them would break the primary trend. Altcoin movements will largely depend on BTC’s behavior.
Therefore, it’s crucial to build a trading strategy that considers both the likely and less likely (but possible) outcomes.
Looking at the broader picture:
The previous minor altseason (winter 2024) was short and weak, except for a few coins.
There was no real secondary altseason in spring 2025.
Statistically, summer tends to be quiet - due to holidays and so on.
The first two points contradicted the expectations of most traders - so we’ll see how things play out with the third. If there's no altseason in summer either, then logically, winter might turn out to be quite aggressive.

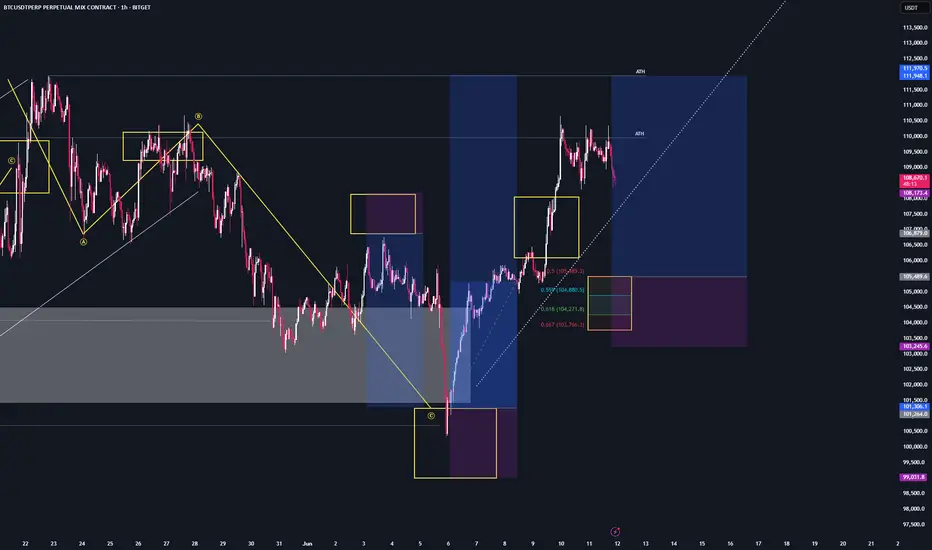
BTC/USDT Analysis: Unproductive Selling Pressure
Hello everyone! This is a daily analysis from a trader-analyst at CryptoRobotics.
Yesterday, Bitcoin once again tested the sell zone at $110,000–$110,600 (profit-taking by a large player) and moved into another correction.
Looking at the current accumulation, we’ve noticed strong market selling pressure that so far hasn't led to any significant result. The seller’s momentum is weak, so most likely we’ll see another upward impulse and a test of the all-time high (ATH).
Buy Zones:
$105,800–$104,500 (accumulated volumes),
$101,600–$100,000 (zone of previous pushing volumes + current buyer defense),
$98,000–$97,200 (local support),
Level at $93,000,
$91,500–$90,000 (strong buying imbalance).
This publication is not financial advice.

Bitcoin - Price Reversal AreaAny price increase in the market must be accompanied by a price correction and a temporary decrease, and only in the currency markets of countries with weak economies can currencies be found that always move in the same direction against strong currencies. This rule is the same in digital currencies and the crypto market. Supply and demand, fear and greed, cause increases and decreases. These drops are not a reason for a permanent decrease, and increases will definitely begin in the next few days. If the price of Bitcoin decreases again, you can use the specified support area to enter a new purchase.
Sasha Charkhchian

Bitcoin to 113K on the horizon!Today's inflation data, combined with key technical indicators, suggests a strong bullish trend for Bitcoin, potentially pushing its price to at least $113,000.

Bitcoin H4 – UpdatePrice consolidating just under $110K with low sell volume. This is bullish compression, not weakness.
📍 Key support: $109K
📍 Breakout above: $110.3K → 🚀 $112K+ in sight
📍 Invalidated below: $108K
This is the calm before the next leg up.

BTCUSDT | Neutral to Bearish Bias | Range Top | (June 8, 2025)BTCUSDT | Neutral to Bearish Bias | Range Top + Money Flow Out | (June 8, 2025)
1️⃣ Insight Summary:
Bitcoin is currently ranging near the top of a multi-day structure, but money flow has been consistently negative on the daily — hinting at hidden weakness. I'm now preparing for a potential move lower despite recent bullish sentiment.
2️⃣ Trade Parameters (Risk Management Focus):
Bias: Neutral to short-term bearish
Key Level to Watch: ~$94,000 (potential support target)
Risk Strategy:
— Reducing altcoin exposure by 50%
— Moving stop losses to entry across open positions
— Hedging if downside momentum increases
(This is not financial advice — just a view on how I’m managing risk.)
3️⃣ Key Notes:
❌ Money Flow Weakness: Daily outflows have been persistent across the entire consolidation — a warning sign even if price holds range highs.
📊 4H Structure: Still within a clean range. Currently at the top, which historically has triggered rejections.
🔥 Exchange Behavior: We're seeing flows back into exchanges, not out — which could suggest increased sell pressure or rotation rather than long-term accumulation.
🧠 Sentiment Caution: While many are still targeting higher levels (like $100K+), this current range and flow data suggests a pause or pullback before continuation — if it happens.
4️⃣ Follow-Up:
Will stay cautious and flexible. If BTC breaks above the range cleanly with strong volume and inflow data flips, I’ll re-evaluate bias. Until then, managing exposure tightly.
Please LIKE 👍, FOLLOW ✅, SHARE 🙌 and COMMENT ✍ if you enjoy this idea! Also share your ideas and charts in the comments section below! This is best way to keep it relevant, support us, keep the content here free and allow the idea to reach as many people as possible.
Disclaimer: This is not financial advice. Always conduct your own research. This content may include enhancements made using AI.

Bitcoin Near Breakout – CPI Miss Could Be the Catalyst?Just Released: Key U.S. Inflation Data:
Core CPI m/m: 0.1% (vs. 0.3% forecast)
CPI m/m: 0.1% (vs. 0.2% forecast)
CPI y/y: 2.4% (vs. 2.5% forecast)
Market Reaction & Outlook:
The softer-than-expected inflation figures suggest easing price pressures in the U.S. economy — a potential bullish signal for risk assets, such as Bitcoin ( BINANCE:BTCUSDT ).
-----------------------------
Now let's take a look at the Bitcoin chart on the 1-hour time frame .
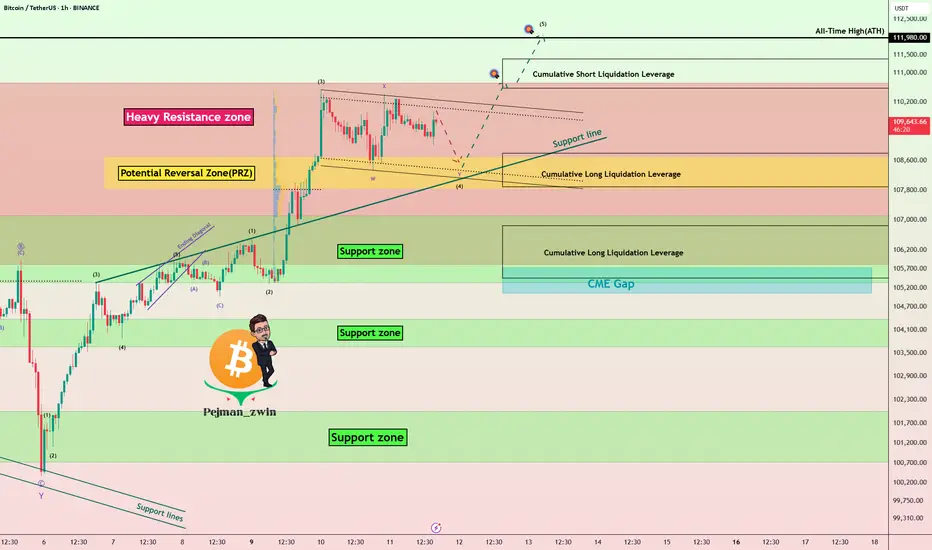
Bitcoin is trading in the upper part of a Heavy Resistance zone($104,380-$103,670) and is trying to break through this zone. The announcement of US indexes could be a trigger for a breakout of this zone .
In terms of Elliott Wave theory , Bitcoin appears to be completing microwave 4 of the main wave 3 . The structure of microwave 4 is a Double Three Correction(WXY) .
I expect Bitcoin to start rising from the Potential Reversal Zone(PRZ) and near the Support line again and rise to at least $110,670 and if the Heavy Resistance zone($104,380-$103,670) is broken we should expect new ATHs in the coming days .
Cumulative Long Liquidation Leverage: $108,791-$107,887
Cumulative Long Liquidation Leverage: $106,840-$105,457
Cumulative Short Liquidation Leverage: $111,381-$110,568
Note: If Bitcoin falls below $105,700(Worst Stop Loss(SL)), we should expect further declines.
If you want to know my weekly analysis about BTC , I suggest you check out the following idea:
Please respect each other's ideas and express them politely if you agree or disagree.
Bitcoin Analyze (BTCUSDT), 1-hour time frame.
Be sure to follow the updated ideas.
Do not forget to put a Stop loss for your positions (For every position you want to open).
Please follow your strategy and updates; this is just my Idea, and I will gladly see your ideas in this post.
Please do not forget the ✅' like '✅ button 🙏😊 & Share it with your friends; thanks, and Trade safe.
HolderStat┆BTCUSD preparing to test 110kYesterday's rise in CRYPTOCAP:BTC puts the immediate target at testing 110,000 and 112,000 and after that opening a new ATH. Local resistance has been broken.
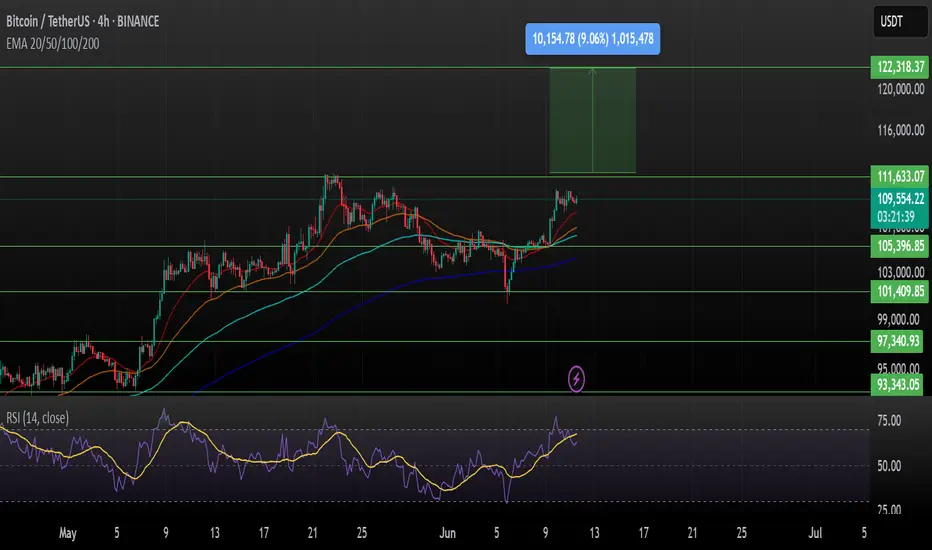
BTCUSDT – Bullish Continuation Setup (4H Chart)Bitcoin shows a strong bullish structure on the 4H timeframe after breaking and holding above key EMAs (20/50/100/200). Price is consolidating just above the breakout zone, suggesting potential continuation.
Support Levels:
$105,396
$101,409
$97,340
$93,343
Resistance Levels:
Immediate: $111,633
Major Target: $122,318 (+9.06% potential upside)
Indicators:
RSI: Holding at ~63.7, still below overbought — suggests room for momentum.
EMA Confluence: All major EMAs are aligned below price, acting as dynamic support.
If BTC holds above $109K, a move toward $122K looks likely. A clean breakout above $111.6K could ignite the next leg up.
Bullish bias intact
Target: $122,318
Risk Management: Watch for invalidation if price breaks below $105K.
This is not financial advice, please do your research before investing, as we are not responsible for any of your losses or profits.
Please like, share, and comment on this idea if you liked it.
#BTCUSDT #Bitcoin #Crypto #TradingView
BTCUSD – Strong Bullish Signals on Daily ChartBTCUSD – Strong Bullish Signals on Daily Chart
Bitcoin is building strong bullish momentum after holding key support near $100,000 and breaking above the critical resistance zone at $105,000–$106,000. This move confirms renewed buying interest and opens the door for further upside.
The daily MACD is on the verge of a bullish crossover, signaling strengthening upward momentum.
The RSI has climbed above 55, moving out of neutral territory and showing buyer dominance.
Price action is approaching the upper boundary of a rising channel, with resistance near $110,000 to watch closely.
Volume has increased on recent up days, supporting the breakout strength.
Key Levels:
Support: $106,000 and $100,000
Resistance: $110,000 and $112,500
A daily close above $107,500 with volume confirmation would solidify the bullish case and could target a move toward $112,500.
What to expect after breaking $112,500:
Breaking and holding above $112,500 would open the path toward the next major resistance near $118,000–$120,000.
This breakout could trigger a strong rally fueled by momentum traders and institutional buying.
Watch for increased volatility as Bitcoin approaches all-time highs, with potential pullbacks serving as entry opportunities.
Sustained volume above breakout levels will be critical to confirm strength beyond $112,500.
If Bitcoin fails to hold above $112,500, it may retest support near $106,000–$108,000 for consolidation.
Short-term outlook: Expect consolidation between $106,000 and $110,000 before the next leg higher. Keep an eye on volume and momentum indicators for confirmation.

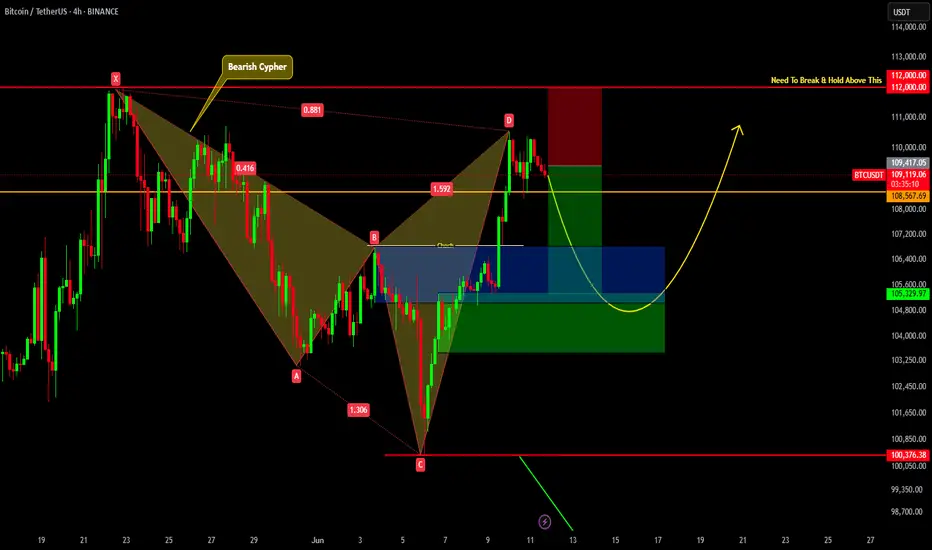
BITCOIN SHORT TERM UPDATE!!! Recently we have seen a great price move from 100K to 110K. We got clear Change Of Character , which indicates a sign of strength. Also we got bearish cypher harmonic pattern formed. So now we can expect a slight pullback up to 106-103k region from there we may see price reversing. But price should hold 100.3K region to remain bullish in short term.
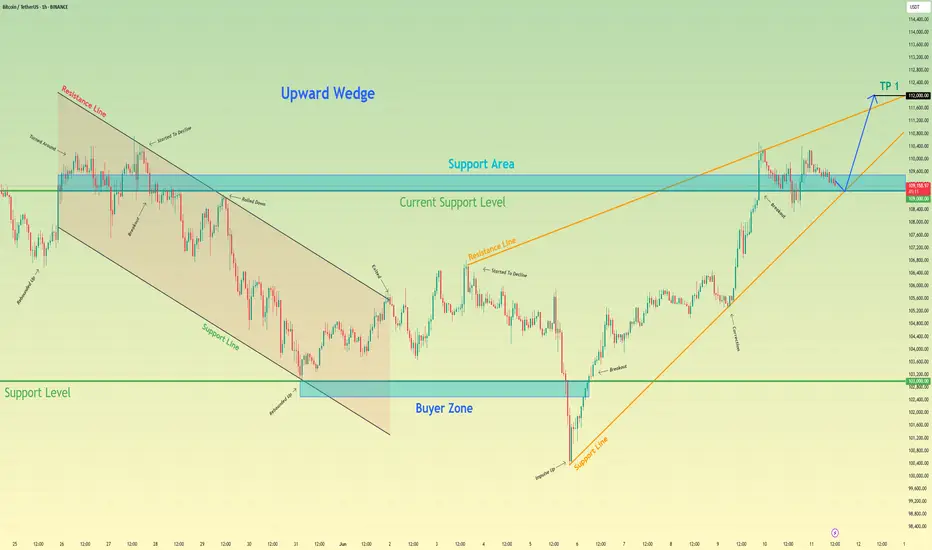
Bitcoin will rise from support level and exit from wedgeHello traders, I want share with you my opinion about Bitcoin. This chart shows how the price rebounded from the current support level and then turned around and rebounded up. Price broke the 109000 level, coinciding with a support area, and then traded near this level for some time. Later price turned around and started to decline inside a downward channel, where it soon broke the 109000 level, reached the resistance line, and continued to fall next. Bitcoin fell to the support line of the channel, which coincided with the 103000 support level and buyer zone, after which it rebounded up. Then BTC exited from channel and later entered to upward wedge, where it at once made a correction movement from the resistance line to the support line, breaking the 103000 level. But soon, price made an impulse up, breaking the support level one more time. Next, it rose to the current support level, broke it too, and now trades inside the support area. In my mind, BTC can rebound from the support level and rise to the resistance line of the wedge. Then it can break this line, thereby exiting from the wedge and continuing to move up; therefore, I set my TP at 112000 points. Please share this idea with your friends and click Boost 🚀
TradeCityPro | Bitcoin Daily Analysis #114👋 Welcome to TradeCity Pro!
Let’s go over Bitcoin analysis and the key crypto indexes. As usual, I’ll break down the futures triggers for the New York session.
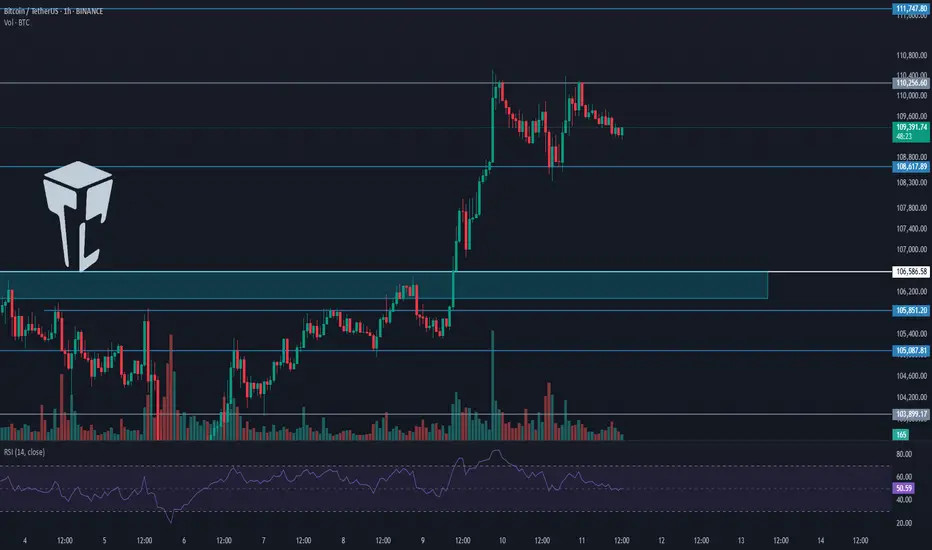
⏳ 1-Hour Timeframe
On the one hour timeframe, as you can see, a trading range has formed between the levels of 108617 and 110256. This has happened after a strong upward move with significant buying volume, and now we’re in a market correction phase.
📊 Market volume is decreasing during this corrective phase, which shows the strength of the buyers and supports the ongoing uptrend. RSI has exited the Overbuy zone and is now cooling off, which indicates that the bullish momentum has weakened for now.
📈 For a long position, the 110256 trigger seems very suitable today. If the price forms a higher low above 108617 before breaking this level, the probability of breaking 110256 increases significantly.
💥 If this trigger is activated, it’s crucial that volume rises as well. That would confirm the strength of the trend and increase the chances of the uptrend continuing. The current target for this position is 111747.
🔽 In the correction scenario, if the price stabilizes below 108617, this scenario becomes more likely and a deeper correction could follow.
✨ Personally, I won’t open a short position unless we get confirmation of a trend reversal. But if you want to go short, a break below 108617 is not a bad option and could signal a downward move.
👑 BTC.D Analysis
Bitcoin dominance has continued its downward movement, stabilized below 64.12, and is now heading toward 63.93.
⭐ If the 63.93 low is broken, the bearish move in dominance will likely continue. If it pulls back, a break above 64.12 will confirm that retracement.
📅 Total2 Analysis
Let’s look at Total2. Yesterday, it broke through the 1.2 level and is now moving toward 1.24. A breakout above this level could start the next bullish leg.
🎲 If a correction occurs, the price may drop back to 1.2 or even 1.18.
📅 USDT.D Analysis
Now for Tether dominance. This index is still sitting at the 4.56 support and is currently being held there. If 4.56 breaks, the next bearish leg can form.
🔔 In case of a retracement, USDT dominance might rise to 4.64.
❌ Disclaimer ❌
Trading futures is highly risky and dangerous. If you're not an expert, these triggers may not be suitable for you. You should first learn risk and capital management. You can also use the educational content from this channel.
Finally, these triggers reflect my personal opinions on price action, and the market may move completely against this analysis. So, do your own research before opening any position.