Wednesday, Trade of the day 📊 Wednesday Trading Update
Tuesday didn’t give us any tangible plays — price action was choppy, unconvincing, and mostly noise. But that’s behind us. Let’s see what Wednesday brings, especially with London and NY sessions ahead.
Midweek is notoriously volatile for BYC, and historically, Wednesday has often been the day that breaks the range or gives us a proper deviation setup — so eyes sharp today 👀.
My trades today will stick to standard range plays, nothing forced. We're still sitting above 4H supply, and unless we get a clean breakout with structure shift, I’ll remain cautious and reactive, not predictive.
Here’s what I’m watching today:
👉 Look for clear market structure shifts on the LTF (lower timeframes)
👉 Divergences can give early signs if you're using oscillators
If I get time, I might record a quick session later. No promises, but I’ll update if that changes.
🎥 If you're unsure what to look for, go back through the video archive — everything you need has already been broken down in detail.
📅 Weekly Schedule:
Wednesday – ❌ No class
Thursday – ❌ No class
Friday – ❌ No class
Let’s stay sharp — volatile Wednesdays tend to reward patience and precision.
BTCUSDT.3L trade ideas
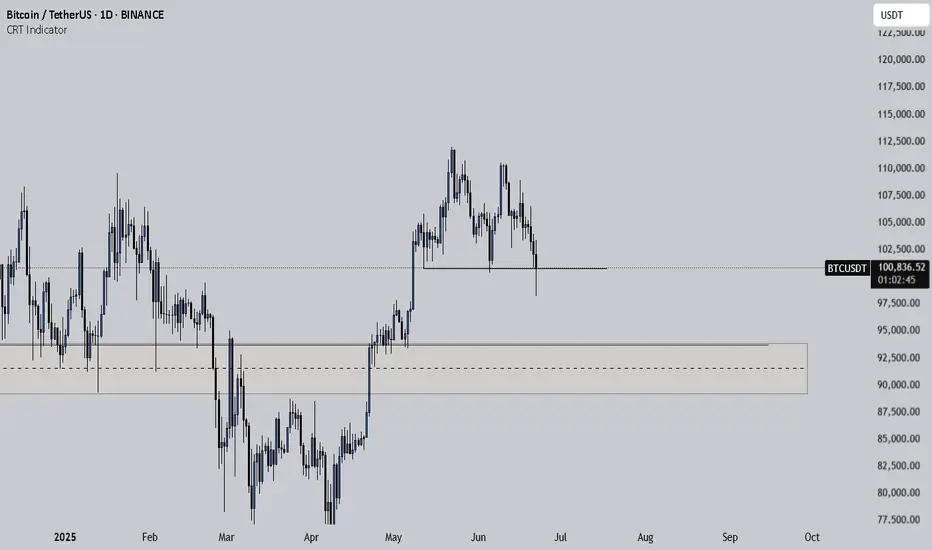
BTCUSDT Technical Outlook TC is trading at $106k , with resistance confirmed near $106.14k–$106.22k and support at $104.8k .
A daily drop below $104.8k would confirm a short setup. Conversely, a break above $106.2k on elevated volume is required to challenge the $107k–$108k zone.
Absent significant volume, expect continued sideways action between $105k–$106k.
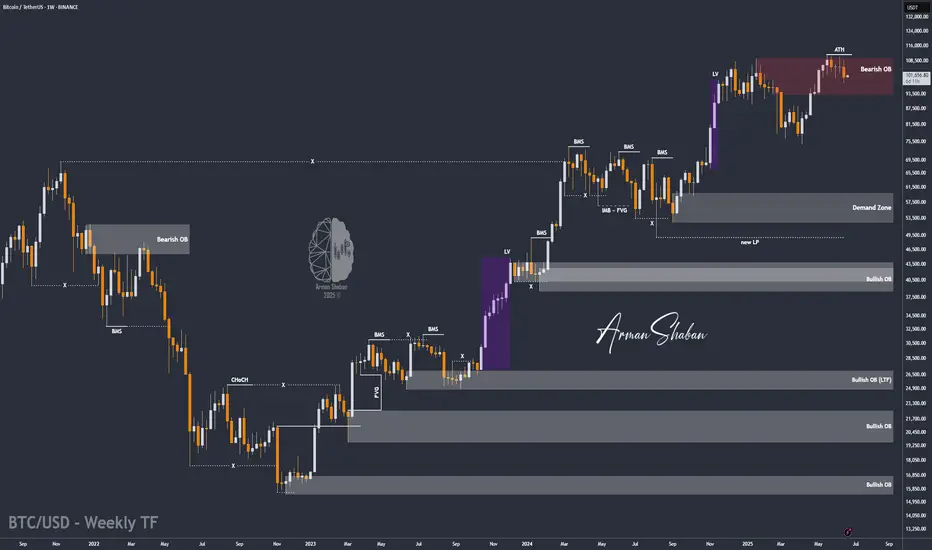
Bitcoin at Risk: Will Geopolitical Tensions Push BTC Below $90K?By analyzing the #Bitcoin chart on the weekly timeframe, we can see that the price continued its correction amid rising tensions and conflict between Iran and Israel, dropping to as low as $98,000. Currently, Bitcoin is trading around $101,000, and if these tensions escalate further — especially if Iran decides to close the Strait of Hormuz — it could significantly impact global markets, and Bitcoin would not be an exception.
If BTC fails to hold above $100,000 by the end of the week, a continuation of the drop toward $90,000 is possible.
Please support me with your likes and comments to motivate me to share more analysis with you and share your opinion about the possible trend of this chart with me !
Best Regards , Arman Shaban
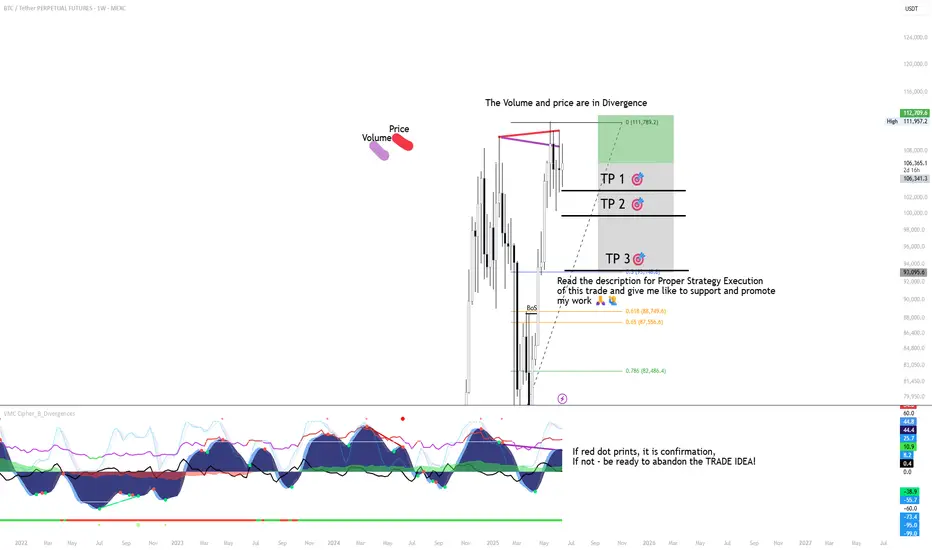
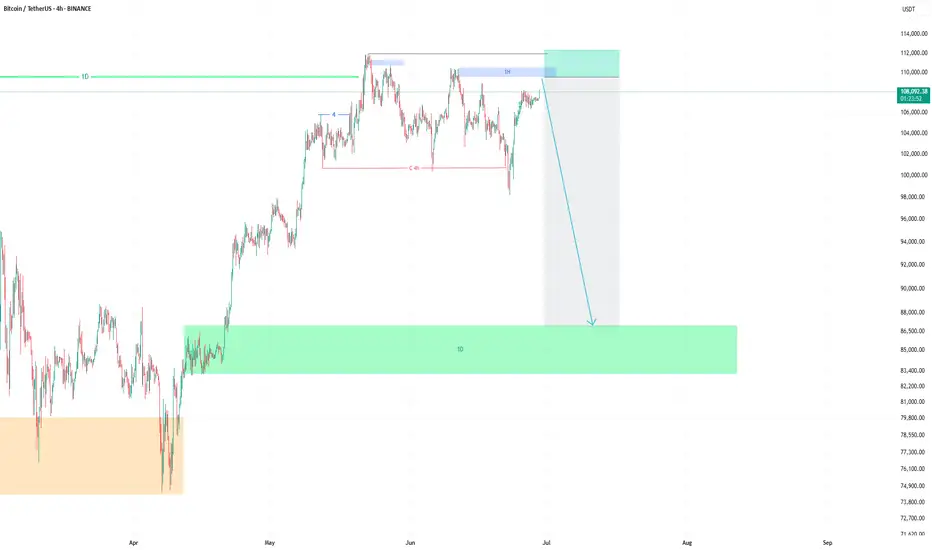
BTC MACRO PLAY - SHORT TRADE SETUP📉 BTC/USDT SHORT TRADE SETUP – WEEKLY TIMEFRAME
🔍 Trade Idea Overview:
We are seeing a bearish divergence between price and volume on the weekly chart — while price makes higher highs, volume is decreasing, signaling a potential reversal or weakening trend.
Further confluence is seen with the VMC Cipher indicator. If a red dot prints, it will confirm the short entry. If not, the trade idea should be abandoned.
📊 Trade Plan:
Entry Zone: Around $106,300–$107,000 (wait for confirmation)
TP 1 🎯: $102,000
TP 2 🎯: $97,500
TP 3 🎯: $93,000
🛑 Risk Management:
Stop-Loss: Above recent highs at $111,800 (or adjusted based on your entry)
⚠️ Disclaimer:
Once TP 1 is reached, move stop-loss to breakeven to protect capital and eliminate risk.
TP 3 may never be reached, but it remains part of the plan to capture extended downside if momentum continues.
If no red dot prints, there is no confirmation — be ready to abandon the trade.
Your Edge Isn’t Just Technical, It’s PersonalMost traders obsess over their strategy: Which indicator? What session? What entry signal?
But very few stop to ask the question that could change everything: “Does this style actually fit who I am?”
The Truth Most Don’t Talk About
Trading success is not about copying someone else’s edge. It’s about discovering your own edge, and that begins with self-awareness .
And it hit deep because this is the part of trading psychology we often skip.
Some Real Talk
If you’re naturally calm and risk-averse, trying to scalp news spikes will drain you.
If you’re fast-thinking, decisive, and love volatility, swing trading might feel like watching paint dry.
If you thrive on rules and structure, discretionary trading might feel chaotic.
If you're intuitive and adaptive, being forced into mechanical rules may kill your edge.
You’re not underperforming because you lack discipline, you’re likely just misaligned.
What Changed for Me
I stopped trying to “be the trader” everyone said I should be. And I started trading like me.
I built a system that fits my mental rhythm.
I gave myself permission to simplify.
I became consistent not because of a new setup, but because I removed internal friction.
Final Thought:
Your best trades don’t just come from the chart. They come from a place of alignment, when your mindset, risk tolerance, and system flow together. So before chasing another strategy, ask yourself: “Is my trading style in tune with my personality?”
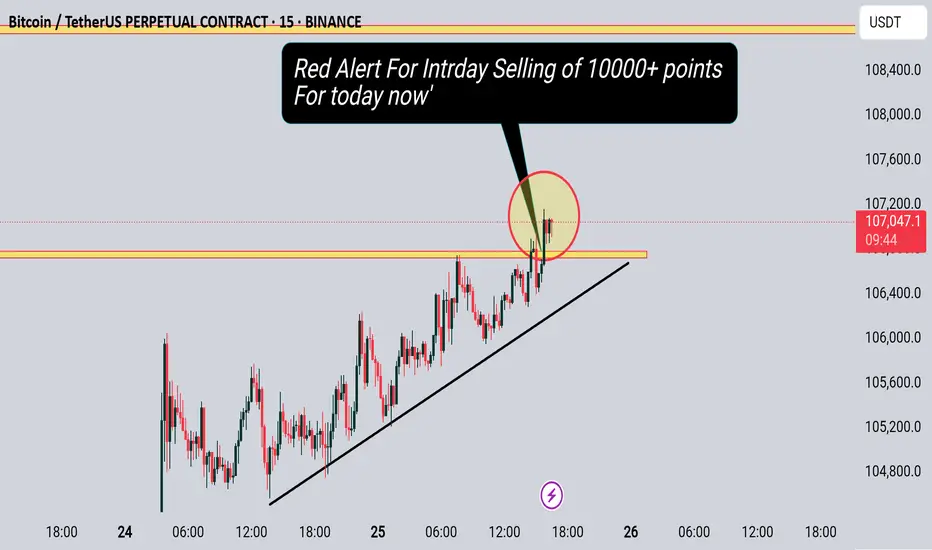
Red Alert For Intrday Selling #bitcoinHello trader's
This is your Red Alert level only for today intrday selling...
Little market update on btc 23/07/25. hope you enjoycheers just a quick one yo update people on my current thoughts on btc

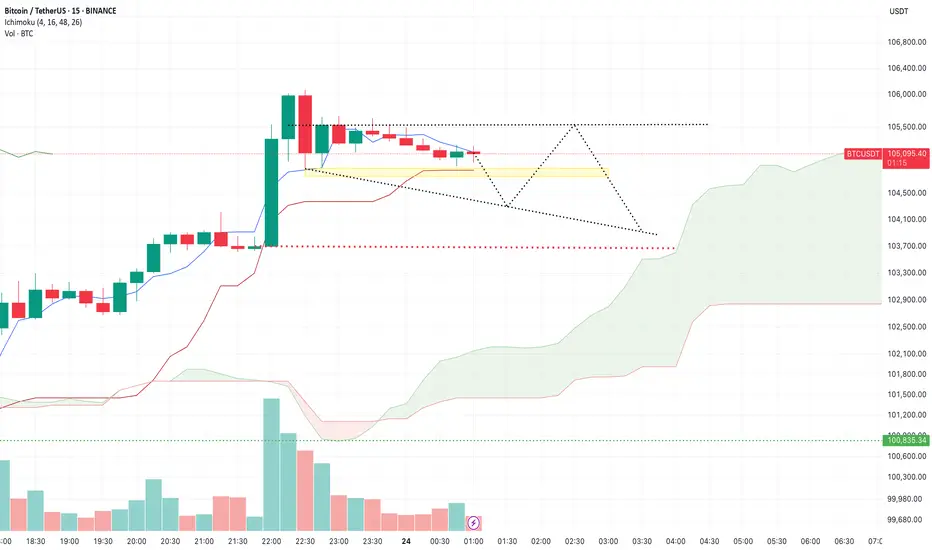
BTC/USDT – Intraday Plan (15m, Ichimoku) by RiscoraWe’re approaching a major liquidity zone in the yellow highlighted area. I expect this zone to be swept soon — likely triggering a wave of stop-losses and liquidations. Once this liquidity is taken, I anticipate a sharp move down on increased volume.
After this liquidity event, my base case is a buyback from lower levels, with price rebounding towards the upper boundary at 105,500. From there, I’m watching for renewed selling pressure to create another push down, forming a descending wedge pattern and a retest of the 104,000 zone.
The key price range I’m focused on for the coming session is 104,400 – 105,500.
I expect BTC to spend most of tomorrow trading within this range, as it consolidates after the volatility spike.
However, if in the next few hours we see a 1H candle close decisively below the red-marked level at 103,700, this would be a strong bearish signal. In that case, I expect the move to extend further down toward the 102,300 area.
Whether price eventually breaks higher or lower from this range will depend on macroeconomic flows and the market’s reaction inside the outlined zone. I’ll continue to update as the situation unfolds.
trade idea on btcthis is my idea about bitcoin movement in next hours.the target is shown in picture.follow for more....
BTC, Selling pressure below 100K, 23 JunePlan BTC today: 23 June 2025
Related Information:!!!
Market capitalisation fell to $3.03 trillion over the weekend, likely due to speculators expecting a sell-off in response to US strikes on targets in Iran. However, the limited reaction from traditional financial markets brought buyers back to the crypto space, showing their willingness to buy at a discount and pushing market capitalisation back up to $3.12 trillion.
The cryptocurrency sentiment index dropped to 42 on Sunday, its lowest level in two months, but rebounded to 47 at the start of the new week, moving from the fear zone into neutral territory.
Bitcoin slipped to $98K over the weekend, briefly touching the classic support level at 61.8% of the April–May rally. However, by the start of the European trading session, it had already recovered to around $102K, compared to $102.7K at the beginning of Sunday. Still, last week’s sell-off broke the 50-day moving average support, weighed down by external factors. A breakout from the $96K–$105K range will likely determine the direction of the next major move
personal opinion:!!!
Selling pressure caused gold price to drop below 100k yesterday, macro economy has not changed much. Gold price continues to suffer selling pressure
Important price zone to consider :!!!
support zone : 100.800 ; 98.200
Sustainable trading to beat the market
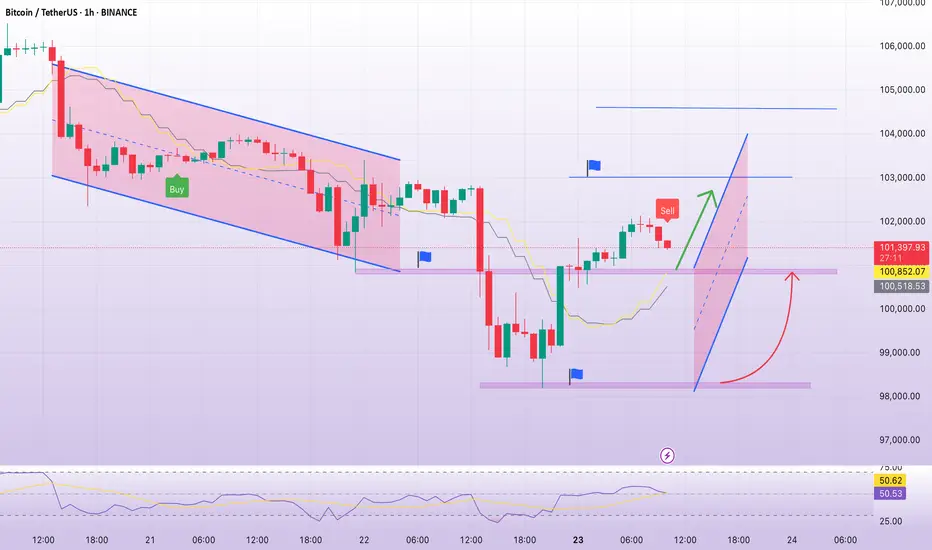
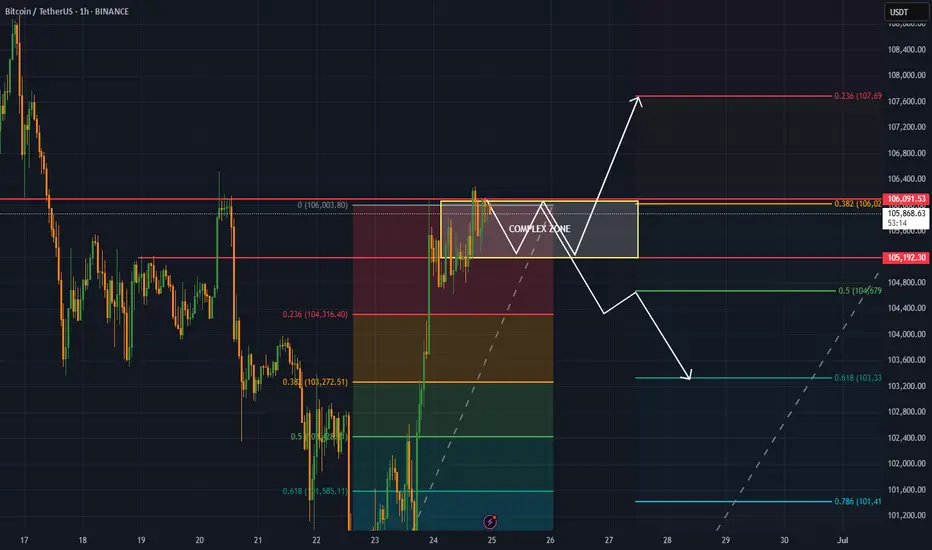
Bitcoin Long Setup: Two Potential Entry Zones After The DropHello, traders! As predicted, Bitcoin is perfectly following Scenario #2 from my previous analysis.
📉 What Happened?
The instrument showed a fake rally, luring impatient traders into premature long positions, only to liquidate them with a sharp downward move. The primary Point of Interest (POI) remains below us — this is where the "whale" aims to deliver the price to fill their orders and close the shorts they used for the initial SSL manipulation.
My Trading Scenarios & Entry Plan
1️⃣ Scenario 1: Mitigation of the Primary POI
My expectation remains the same: a reaction upon the mitigation of the 4h order block , which aligns with the 78.6% Fibonacci level.
Entry Condition: The level must hold on at least the 4H timeframe, confirmed by a bullish reversal and an order flow shift on the Lower Timeframe (LTF).
Zone: $102,745 - $103,868
Invalidation: A clear break and close below the 78.6% Fib level would invalidate this scenario.
2️⃣ Scenario 2: Deeper Liquidity Grab
If the liquidity at the 4h OB isn't enough for the whale to continue the uptrend, they might trigger a more aggressive decline to grab liquidity from the low at $100,370.
Entry Condition: A swift sweep of this low, followed by a sharp reclaim of the level and the beginning of a bullish order flow on the LTF.
Zone: $100,700 - $102,000
Invalidation: A candle close below the $100,370 liquidity level would invalidate this scenario.
Final Thoughts
Do not open positions just because the price has reached a POI. Wait for a clear reversal reaction and LTF confirmation for more conservative and safer entries. Always use stop-losses to protect your capital; no setup has a 100% win rate, and for every whale, there can always be a bigger one.
To be consistently profitable, you just need to find setups with a win rate greater than 50% — this is how casinos and professional traders operate.
Happy hunting with the whales — don't be the plankton. Follow their tracks.

$BTC correction: targets 101k, 97.5k, 94k, 87kThe hype is peaking — institutions, banks, Wall Street, and even governments are buying Bitcoin.
Yet despite the frenzy, BTC has been rejected three times around the $110K level and appears to be heading into another correction.
Bitcoin maximalists are pushing a strong FOMO narrative to attract retail investors, but several factors are pushing back:
- Psychological barrier: At these price levels, retail investors are hesitant. Owning just a "fraction" of a Bitcoin doesn’t appeal to the average person.
- Geopolitical tension: The conflict with Iran is serious. This isn’t a small, isolated country — Iran is a millennia-old civilization with global alliances. This situation won't resolve quickly or easily like Libya, Syria, or Iraq.
- Oil price surge: Escalating tensions could disrupt the Strait of Hormuz, a critical route for global oil. Western sanctions on Russia already strain supply — if Iran joins, where will Europe get its energy? U.S. supply won’t be enough. Expect a spike in inflation.
- Recession risks: Persistent inflation could drive a recession in the second half of the year.
- Trade wars & tariffs: No resolution, just chaos.
- Ukraine-Russia war: Still unresolved. Still draining global stability.
In short, the world is burning — and this is terrible for markets.
Bitcoin maximalists — some even selling company shares to buy more BTC — may soon face the harsh reality: Bitcoin needs a deeper flush before it can rally again. Retail won’t return until altseason clears the way and resets sentiment.
In a cycle dominated by propaganda, institutional manipulation, and global unrest, predictions are fragile. The only guide left: the chart.
Technically, we’re in correction mode again. Comparing with past cycles, potential pullback targets are:
$101K, $97.5K, $94K, $87K
There’s massive support at $74K, but it's unlikely we revisit it soon.
Stay cautious. DYOR.
#Bitcoin #CryptoMarket #BTCUpdate #Geopolitics #Altseason #CryptoCorrection #MacroView #CryptoFOMO #RiskAssets #DYOR

Short to 86KIt really wants to go up to 110,000 and then drops to 86,000.
So it's better to think about selling at higher levels than buying.
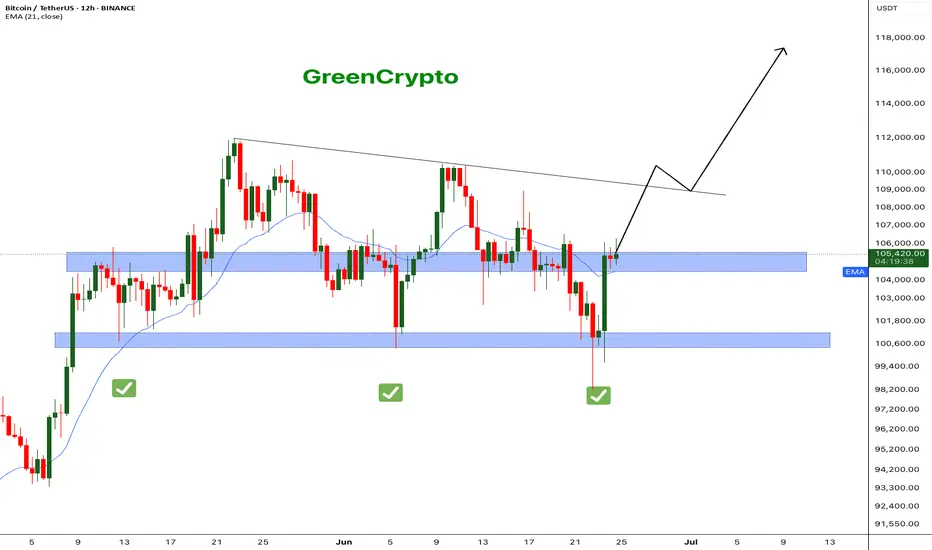
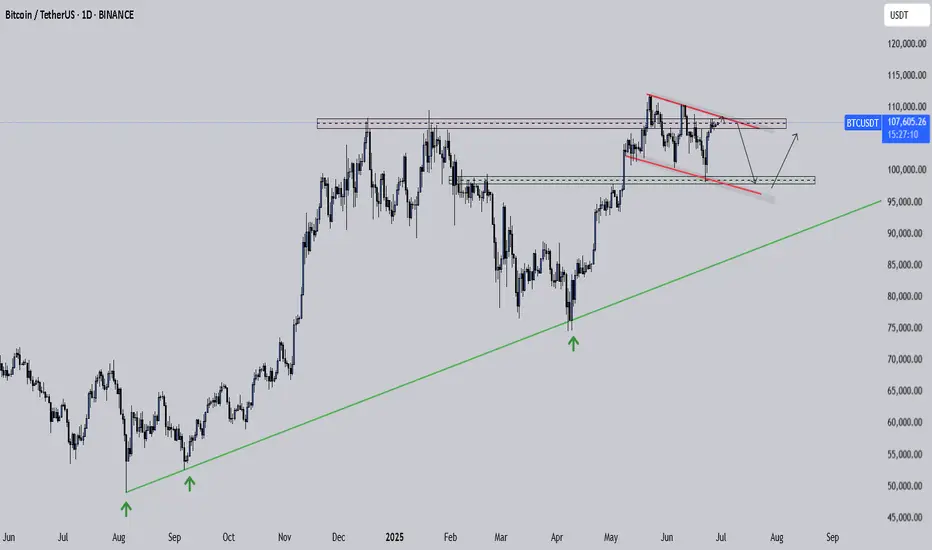
Bitcoin - What's next ? BINANCE:BTCUSDT (12H CHART) Technical Analysis Update
Now that ceasefire is announced, bitcoin price has successfully recovered to the resistance level and currently trading at the resistance zone. It's critical that bitcoin breaks this resistance for it to hit the next resistance around 110K .
I'm expecting price to reach 110k this week and we can see some consolidation in that range before moving further up.
Follow our TradingView account for more technical analysis updates. | Like, share, and comment your thoughts.
Cheers
GreenCrypto
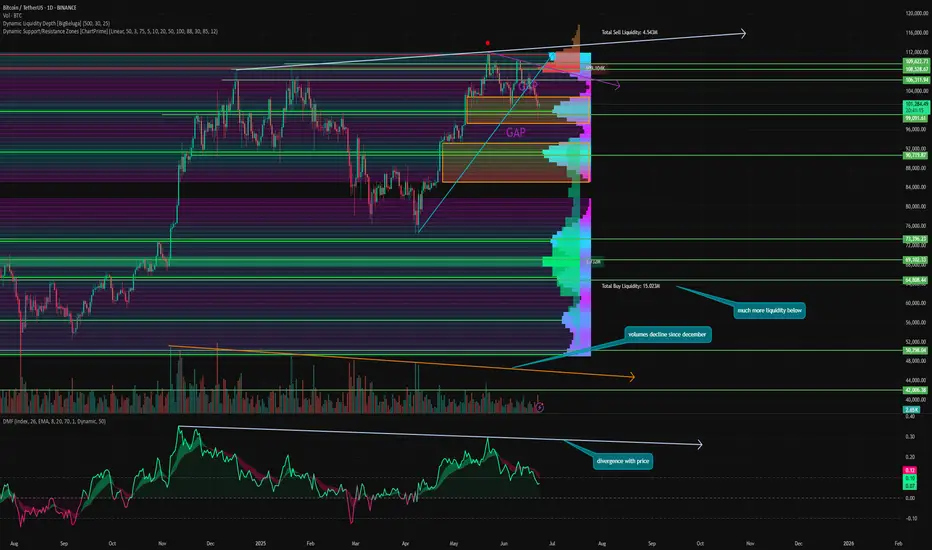
We PREDICTED correction, and here is the NEXT step⚡️ Hello, everyone! As I said in my previous ideas, the correction is just beginning. Some people link this to the hostilities in the Middle East.
But, in reality, this is just a way to find a reason. In fact, the charts have long predicted a correction, which I have been actively talking about for the last month.
📊 Let's take a look at what lies ahead:
Having gathered liquidity below 100k, we are now seeing a short-term rebound. For me, the maximum target for this rebound is 106,000-107,000.
We have started to close the GAP at levels of 102,760 - 97,400. I expect it to close completely, after which we can move into a range. The next GAP is at levels of 93,280 - 85,230. So the further direction of movement is also obvious. After all, in 99% of cases, gaps close sooner or later.
⚙️ Metrics and indicators:
Money Flow - liquidity has been declining for more than half a year. This updated ATH was accompanied by a significantly smaller inflow of capital and formed a divergence. This means that there is still no new liquidity in Bitcoin, and for it to move higher, a new catalyst and cheaper prices are needed.
Liquidity Depth - as we know, the price tends to move from one liquidity zone to another. And now, there is significantly more liquidity at the bottom than at the top.
Dynamic Support/Resistance - Currently, 99,890 is a strong support level. However, each time we move lower below it. So I am confident that this level will be broken in the near future. The next major support level is 91,460.
Volume - is another indicator of the lack of new liquidity in Bitcoin. Since November 2024, purchase volumes have continued to decline!
📌 Conclusion:
I don't expect us to see Bitcoin at 60,000 before the fall. But 80,000 by September is quite possible. The fact that we will probably test the 90,000 level is not even up for discussion. Unless, of course, a new bullish catalyst appears. Altcoin ETFs are not even close to being one.
So, for now, I advise everyone to be patient and not try to predict the bottom. Prepare your bags for spot purchases, sit back in your chair, and enjoy the show!
🔥 Have a great week, everyone! 🔥
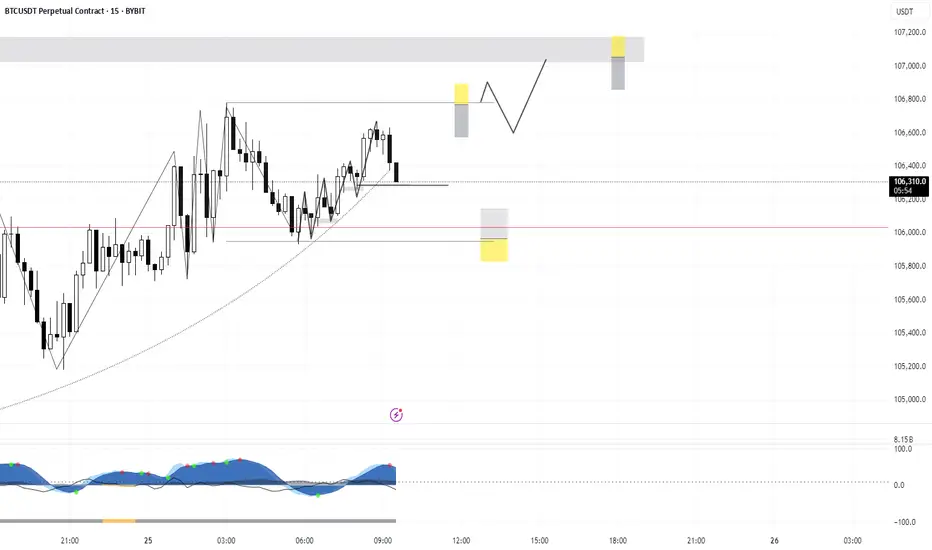
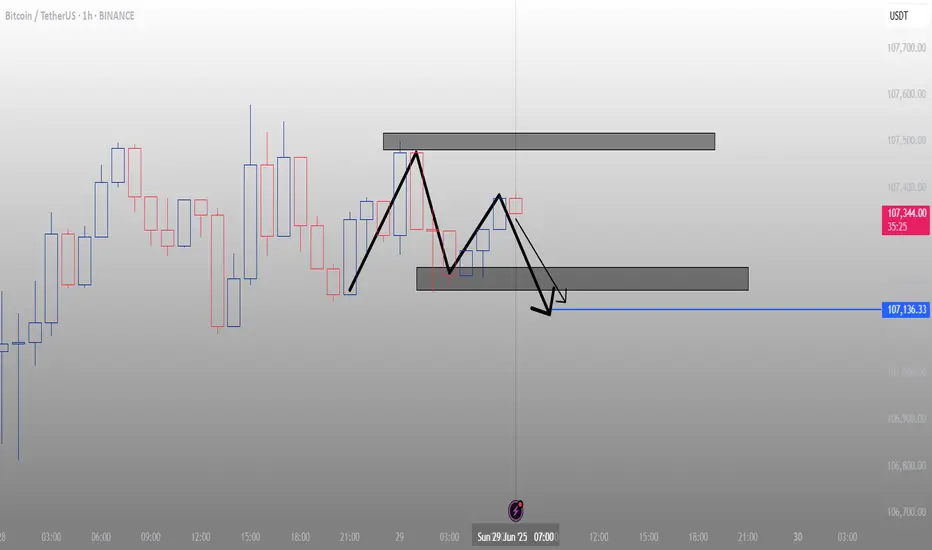
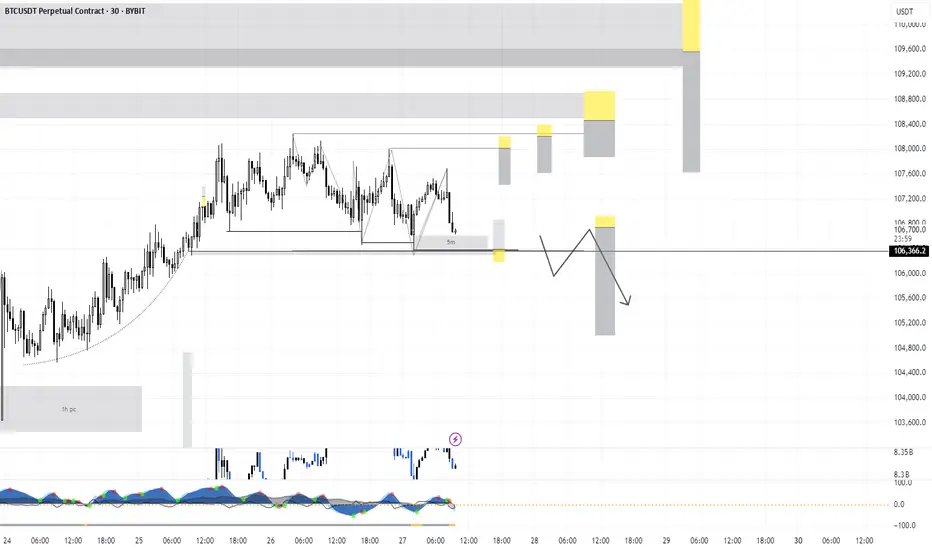
Trade of the day!These are the areas I have my eyes on. We are in a range and can get a long or short play here. If we break bullishly, I will be wary of the supply above, if we break down here there's a lot of liquidity to sweep. Lets see what happens
Confirmation: MS change on secondary TF or Divergences
BTC black swan event is over, war fud ending, 220k-240k+ nextbuy spot , im betting more on Solana since i think SOL will outperform

BTCUSDT Hello traders.
The BTCUSDT trade I shared the other day played out just as expected, with BTC experiencing a significant drop in value shortly after. The price fell all the way down to the 98K level.
Following this decline, I anticipate a short-term rebound toward the 102K–103K range, after which I expect the downtrend to resume. Therefore, I’ve placed a Sell Limit order at 102,350, and I’m currently waiting for the price to reach that level.
If you'd like, you can consider this opportunity in the same way.
🔍 Trade Details
✔️ Timeframe: 1-Hour
✔️ Risk-to-Reward Ratio: 1:2
✔️ Trade Direction: Sell Limit
✔️ Entry Price: 102,350.24
✔️ Take Profit: 100,250.08
✔️ Stop Loss: 103,399.62
🕒 If the trade doesn’t gain strong momentum, I will keep the position open only until 23:00 (UTC+4) today. Otherwise, I will manually close the trade—either in profit or at a loss—depending on price action.
🔔 Disclaimer: This is not financial advice. I’m simply sharing a trade I’ve taken based on my personal trading system, strictly for educational and illustrative purposes.
📌 Interested in a systematic, data-driven trading approach?
💡 Follow the page and turn on notifications to stay updated on future trade setups and advanced market insights.

Bitcoin sell short inter:115000Bitcoin needs to reach the 114,000-115,000 range and a daily time frame divergence and drop to the 84,000-50,000 range.
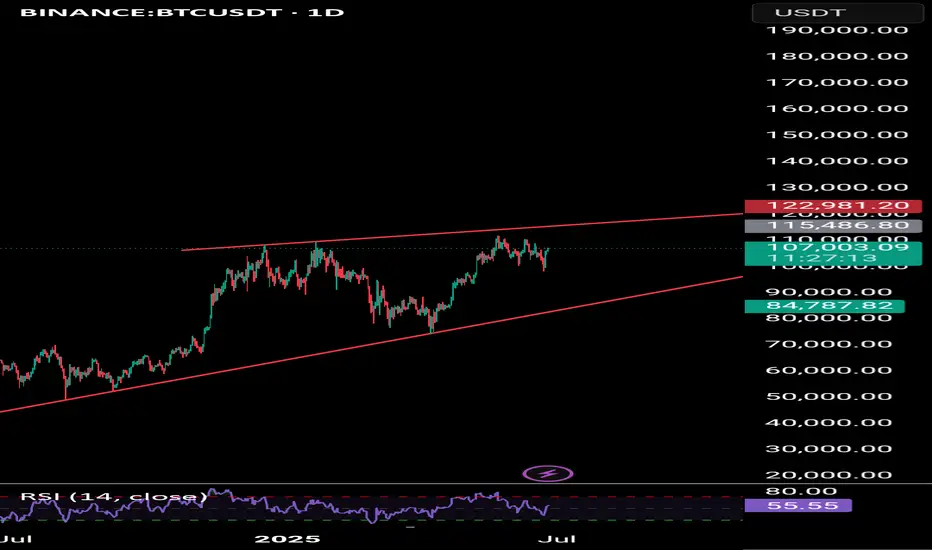
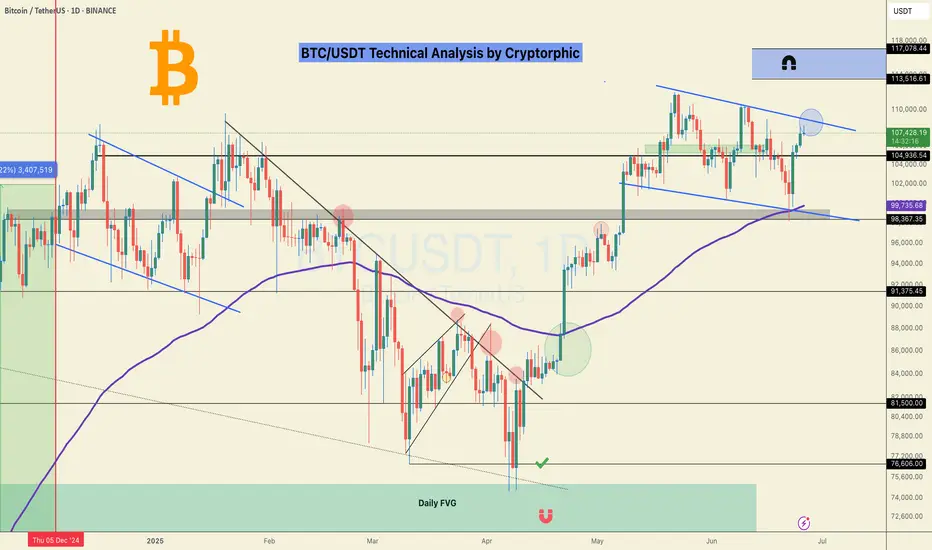
Bitcoin Pressing Up But This Compression Could Crack LowerBitcoin has been steadily climbing for months, respecting that long-term trendline since last year. Each dip into it brought a strong bounce, showing bulls are still in control of the bigger picture.
But right now price is pressing into a tight descending resistance line. We can see it making lower highs while struggling to break above that red trendline. At the same time, it’s sitting just above a key horizontal range, where buyers stepped in before.
This compression is risky . If BTC fails to push above the descending resistance and breaks back below the box, it could drop toward the next demand zone around the low 100K region .
As long as the major trendline from last year holds, the broader uptrend is intact . But losing this structure would open the door for a deeper correction.
This is the kind of spot where patience pays. Let the breakout or breakdown show its hand before jumping in heavy.
#BTC Update. Here's the trigger point.CRYPTOCAP:BTC Update:
Bitcoin is trading around the key $108K resistance, one of the most crucial levels for bulls to break.
A strong close above this zone could spark a rally toward $ 117,000. However, if rejected, we might see a pullback to $ 103,000.
I’m not touching futures just yet.
I’m okay with missing a few green days; I’d rather wait for clear momentum than get caught in this choppy price action.
Let me know what you think in the comments.
Thank you
#PEACE
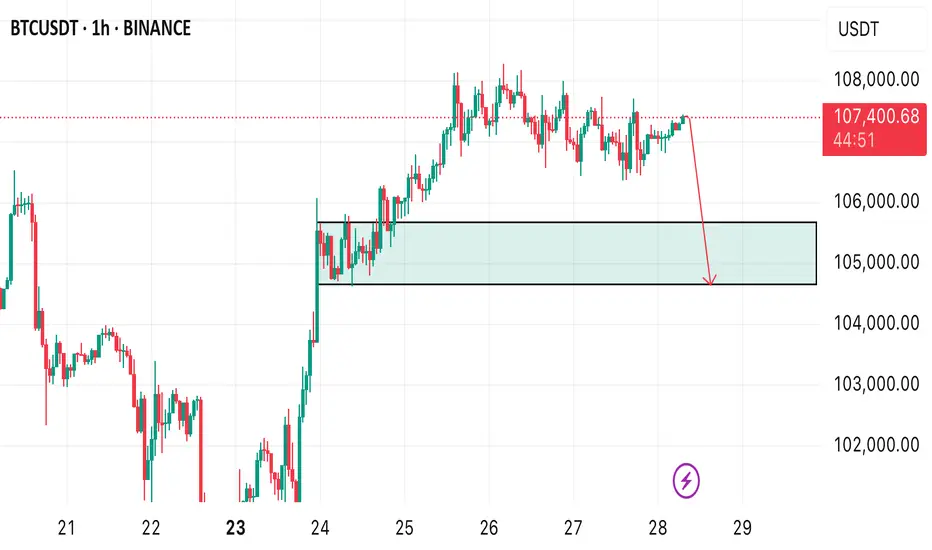
PRICE SPECULATION ON BTCUSD!Price updates from the H1 timeframe . Price is likely to drop from the current high after we saw a distribution stage currently forming, therefore, a sell opportunity is envisaged.
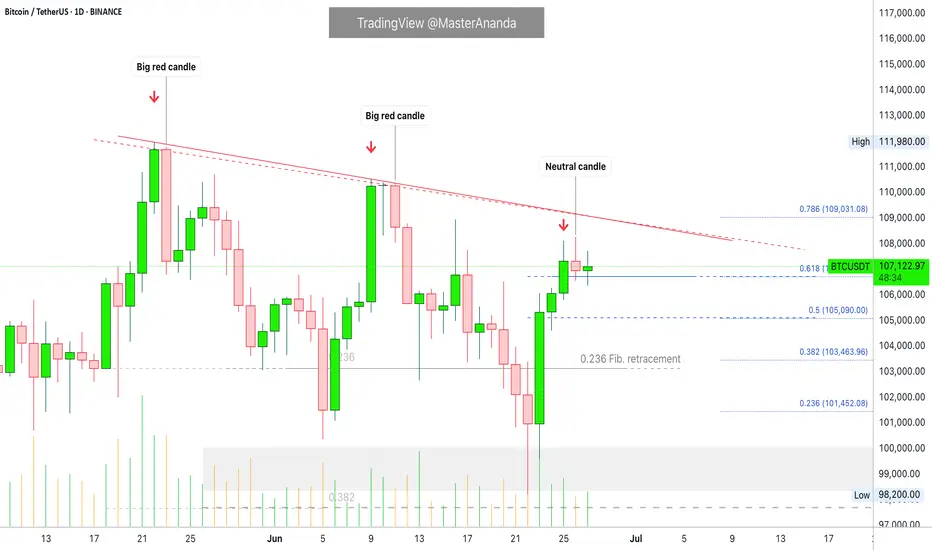
Bitcoin, The Next High Is The All-Time HighThe title might be a bit misleading but, the truth is that Bitcoin stays bullish short-term and this is bullish on all terms...
Good afternoon my fellow Cryptocurrency trader, how are you feeling today?
Any day, any week, any moment; every month, place or year, the market provides everything we need to know. This information is made available to us through the chart.
Bullish Bitcoin
The present signal is the fact that Bitcoin remains very high, challenging resistance, after a strong recovery and advance. This is happening with the altcoins also.
If you look at the last two peaks, as soon as resistance was hit there was an immediate crash. The next day was full red; very strong bearish action and momentum and this led to a new low. The situation is not the same today.
22-May peak. 23-May, strong bearish action.
9-June peak. 11-June, strong bearish action.
26-June lower high (not a peak). Today, neutral action. This neutral action is what I am taking as a bullish signal. Many other factors of course support this conclusion yet, this is still an early signal.
Fib support
A closer view of the daily timeframe:
4H. The grey line represents Fib. retracement. Dark blue—Fib. extension:
Conclusion
Each time there is a price peak a retrace follows, if there is no retrace then you are not witnessing a peak but rather a stop, a pause; resistance being met.
It seems that the current lower high is not the end but rather just a pause before additional growth. Market conditions can change.
It can happen that several days Bitcoin goes sideways with the bulls failing to garner enough strength. In this scenario, there would be a move lower before additional growth.
The present scenario shows a bullish chart even if prices drop, remember, the market is in no hurry.
Easy money
In September we will have lower interest rates and this is a bullish development for Bitcoin. Advanced money minds see easy money as inflationary for the currency, while Bitcoin is inflation-proof. So the dollar goes down and Bitcoin goes up.
I didn't quite develop this point, next time I'll do a better job.
Summary
The market is good even if it shakes. The market is good and isn't shaking, the recovery is already in place.
Bitcoin's price is very strong and there are many layers of support. The altcoins are in a similar situation, growing from the bottom up.
The Fed will reduce interest rates in September and then once more before the year ends, this is bullish for everything so, everything will be going up, at least everything that we are interested in, support and trade.
Thanks a lot for your continued support.
Never give up!
You are divine! You are blessed.
If you are reading this now, you will be blessed for your great timing. Hard work and dedication always pays.
Keep moving forward, keep pushing forward, never give up.
When life hits you hard, do take a break if you need it, only to comeback with new energy, a new mind and an infinite drive to achieve your goals.
You are the reason why Bitcoin exist... You are the lifeblood of the market.
Without you, nothing is possible. It is because of you that we all continue to grow.
Thanks again for taking the time to read.
I appreciate your support.
Namaste.