BTC - LONG SET-UPBINANCE:BTCUSDT
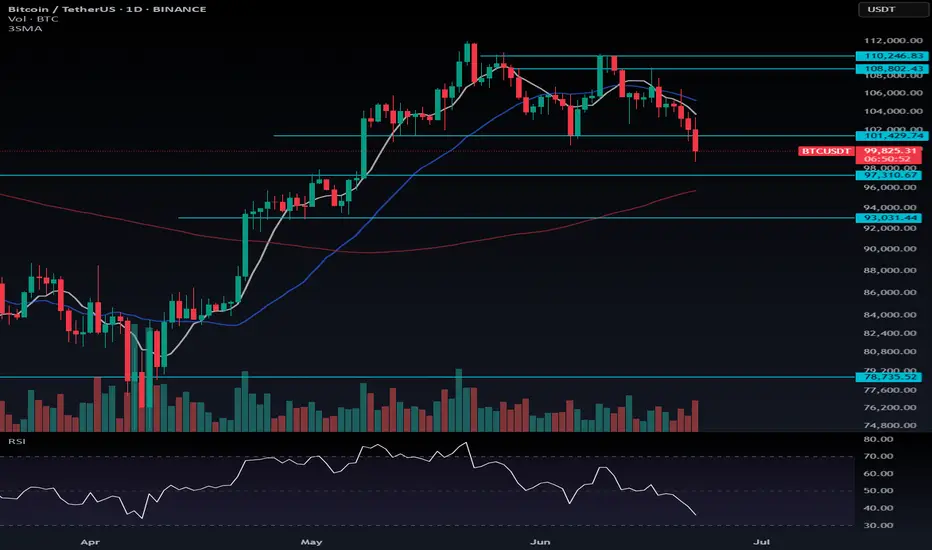
Bitcoin is currently testing its critical resistance level
If the price gets rejected here, the key support to watch is the $𝟏𝟎𝟏,𝟐𝟎𝟎 - $𝟏𝟎𝟐,𝟖𝟎𝟎 zone. This area represents a strong demand level where a potential buying opportunity could emerge.
For a trade setup based on this support, a strategic Stop Loss (SL) should be placed below the $𝟗𝟖,𝟎𝟎𝟎 mark to manage risk.
For now, patience is crucial. Keep a close eye on the price action
BTCUSDT.3L trade ideas
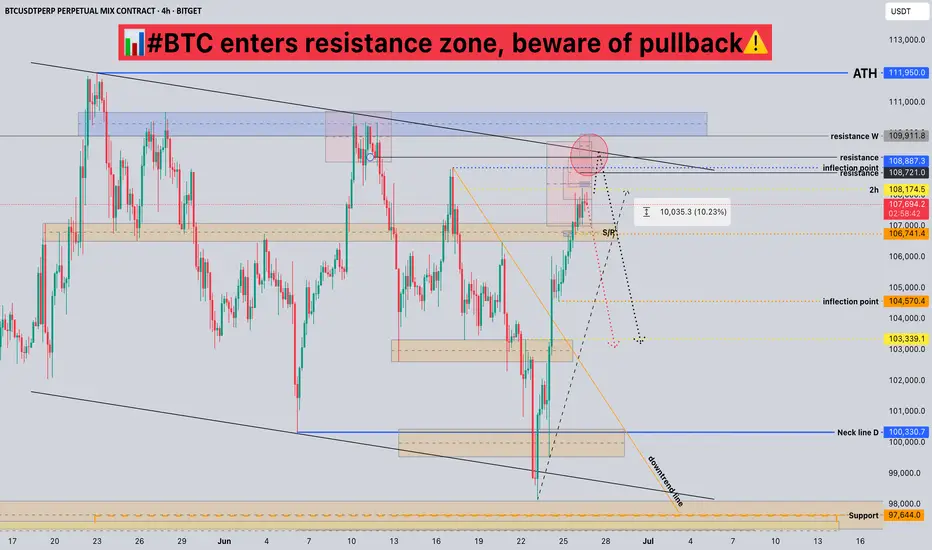
#BTC enters resistance zone, beware of pullback📊#BTC enters resistance zone, beware of pullback⚠️
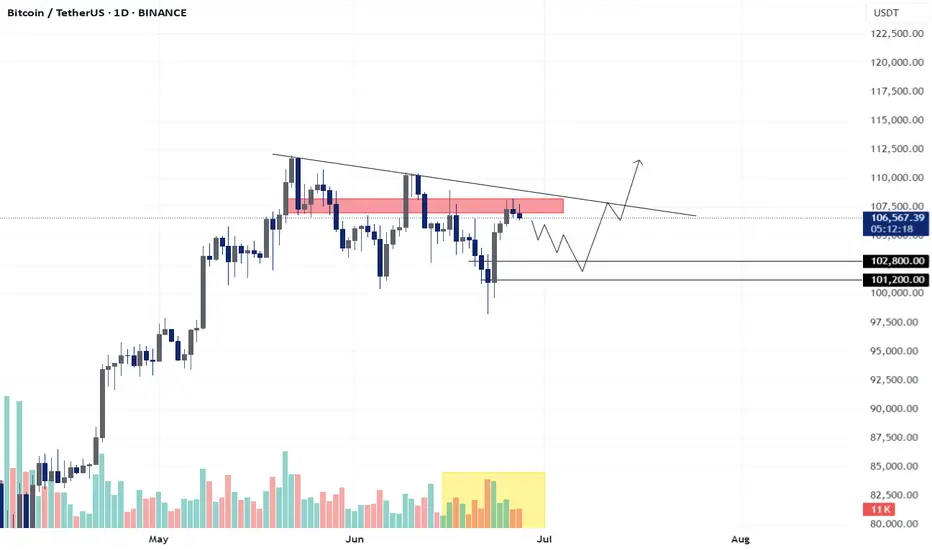
🧠From a structural perspective, the target of this rise has been achieved, so we need to be wary of a mid-term correction.
➡️From a graphic perspective, the daily level seems to be forming a bull flag. This is the third time we are close to the upper edge of the flag. I think the probability of encountering resistance and falling back is higher than the probability of continuing to break through.
Let's see👀
🤜If you like my analysis, please like💖 and share💬
BITGET:BTCUSDT.P
BTC - 103.5 - 102k when?OKay so the move as marked did move but is choppy, owing to the new pattern, lets see if triple tops are made and is done in a manner where it falls, LIQ shows at 108,800, BTC genuinely looks very very tired!
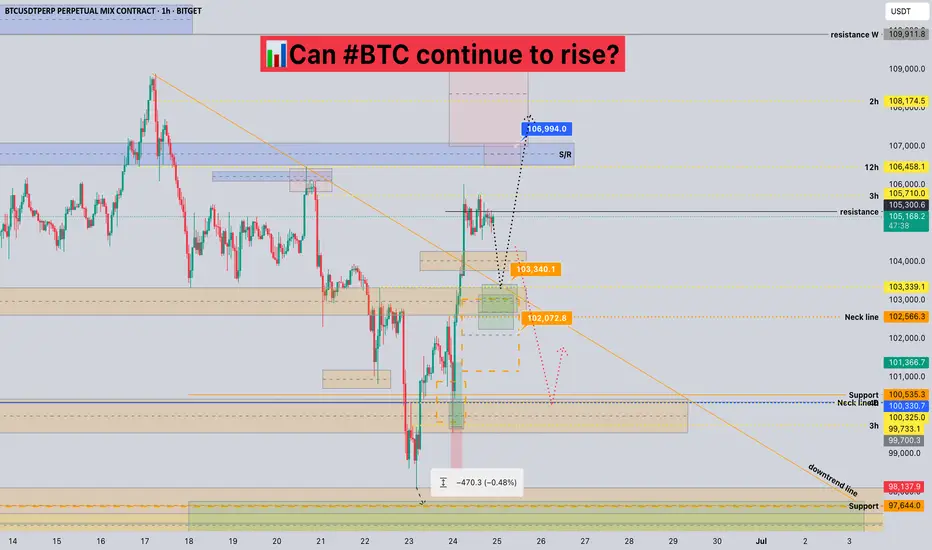
Can #BTC continue to rise?📊Can #BTC continue to rise?
🧠From a structural perspective, we started to rebound after being very close to the ideal target area of the bearish cup-handle structure, and broke through the downward trend line, which means that the correction phase is over.
➡️So next we need to pay attention to the long trading opportunities after the pullback. At present, this position belongs to the contradictory range. It can continue to rise, but it will be very uncomfortable if we chase the rise. So wait patiently for trading opportunities after the pullback. We can pay attention to the neckline support area (102000-103000).
➡️If there is no pullback, but it continues to rise, then the resistance near 106500 is also worth our attention. This is the support-resistance conversion area that has been tested many times.
🤜If you like my analysis, please like 💖 and share 💬
BITGET:BTCUSDT.P
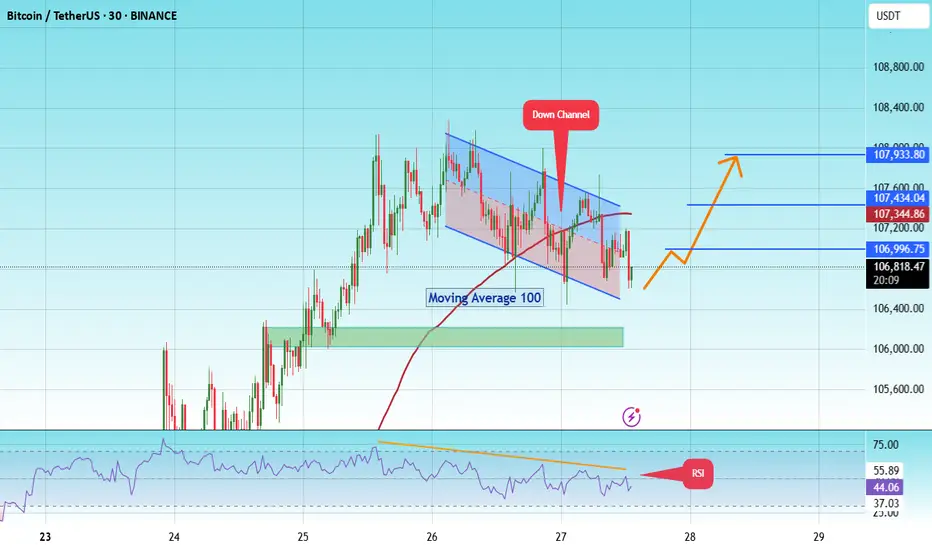
BITCOIN - Price can continue grow inside flat to $107933 level#BTC
The price is moving within a descending channel on the 1-hour frame and is expected to break and continue upward.
We have a trend to stabilize above the 100 moving average once again.
We have a downtrend on the RSI indicator that supports the upward move with a breakout.
We have a support area at the lower boundary of the channel at 106500, acting as strong support from which the price can rebound.
We have a major support area in green that pushed the price upward at 106000.
Entry price: 106736
First target: 106996
Second target: 107434
Third target: 107933
To manage risk, don't forget stop loss and capital management.
When you reach the first target, save some profits and then change your stop order to an entry order.
For inquiries, please comment.
Thank you.
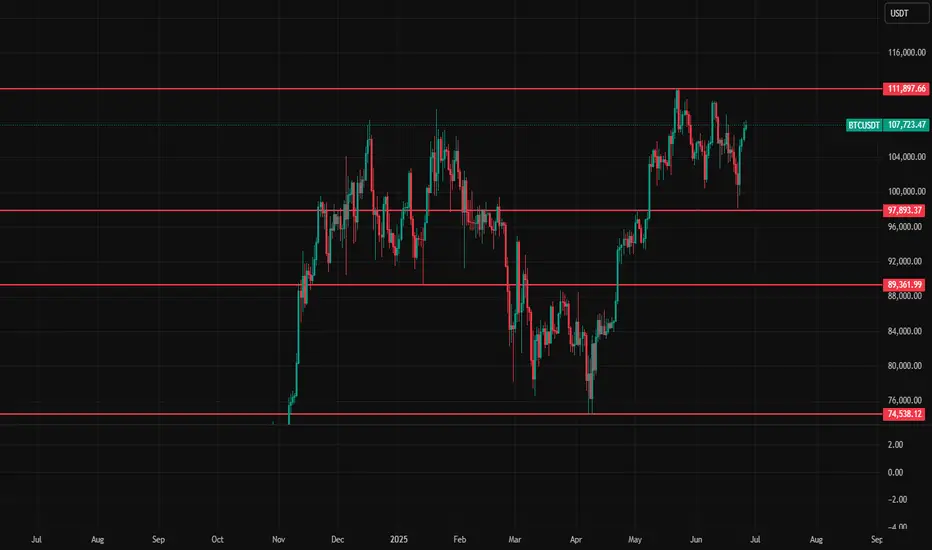
BTC Key levelsBTC key levels are below
These are very important levels for reversals and breakouts.
111, 898
97,893
89,362
74, 538
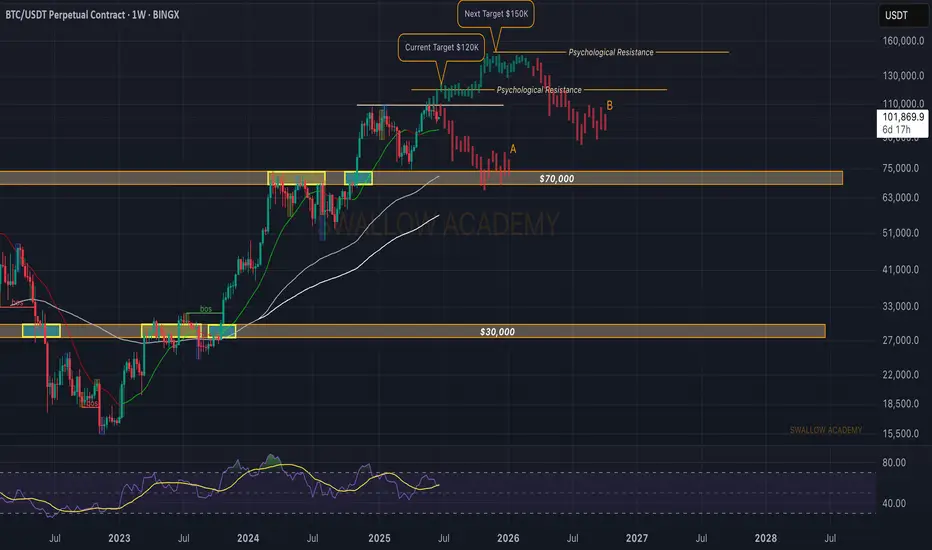
Bitcoin (BTC): Strong Sell-Off During Weekends | Plan A & BBitcoin was bleeding hard during the weekend when the US decided to join the ongoing war, which is now strongly impacting the economic markets.
As tensions are tightening, we are expecting a similar outcome to happen like we had during the beginning of the UA war, where at the start everything dipped hard, and later we had a strong upward rally.
Remember, people need to store their money somewhere safe, and the safest places are buying gold or Crypto.
Swallow Academy
USA bombs IRAN - Bitcoin Falling!Operation Midnight Hammer was a major U.S. military strike carried out on June 21, 2025, targeting three of Iran’s key nuclear facilities: Fordow, Natanz, and Isfahan.
The operation involved seven B-2 Spirit bombers, each flying an 18-hour mission from Missouri, supported by over 125 aircraft, including refueling planes, fighter escorts, and surveillance assets.
To maintain the element of surprise, the U.S. used deception tactics, such as sending decoy aircraft westward over the Pacific while the actual strike force flew east toward Iran with minimal communications.
The bombers dropped Massive Ordnance Penetrators (MOPs)—30,000-pound bunker-busting bombs—on the fortified nuclear sites. Cruise missiles launched from a U.S. submarine struck additional infrastructure targets.
The Pentagon described the mission as the largest B-2 operational strike in U.S. history and the first known combat use of the MOP. Officials emphasized that the operation was aimed solely at nuclear infrastructure and not at Iranian civilians or military personnel

Bitcoin Still Bullish Above $93K — Don’t Trade with Emotion🟢 Bitcoin Still Bullish Above $93K — Don’t Trade with Emotion
I still believe Bitcoin is in a bullish trend as long as it holds above $93,000. The recent drop seems mostly driven by external factors and geopolitical uncertainty. If Iran responds to the U.S. or closes the Strait of Hormuz, there’s a strong chance this short-term downtrend could continue.
But here’s the key: don’t trade emotionally. If you’ve bought spot positions and your stop-loss was hit, it’s okay to exit. You can always re-enter later when conditions improve. The most important part is to trust your analysis and the stop you originally set.
As for futures, I’m personally not trading right now — the market is too reactive to headlines. However, I’ve noticed BTC outflows from exchanges have increased, which is often a bullish long-term sign. This means the price can recover just as fast once fear subsides.
📉 In uncertain times, patience is a strategy too — sometimes watching is better than chasing trades.
---
💬 What’s your take on Bitcoin during this geopolitical mess? Let me know in the comments — I’d love to hear your thoughts. 👇
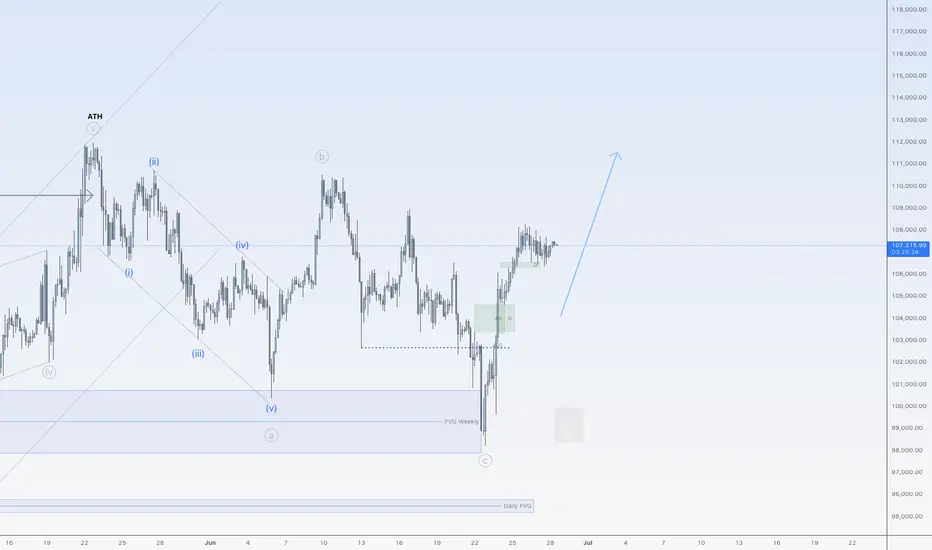
Up for BitcoinHi traders,
Last week Bitcoin made a small correction up and after that another drop just as I've said.
After it retested the Weekly FVG and broke the previous swing low it went impulsive up again.
This could be the next impulse wave to new ATH's. So wait for the correction down to finish and trade longs.
Let's see what the market does and react.
Trade idea: Wait for the correction down to finish to trade longs.
If you want to learn more about trading FVG's with wave analysis, please make sure to follow me.
This shared post is only my point of view on what could be the next move in this pair based on my analysis.
Don't be emotional, just trade your plan!
Eduwave
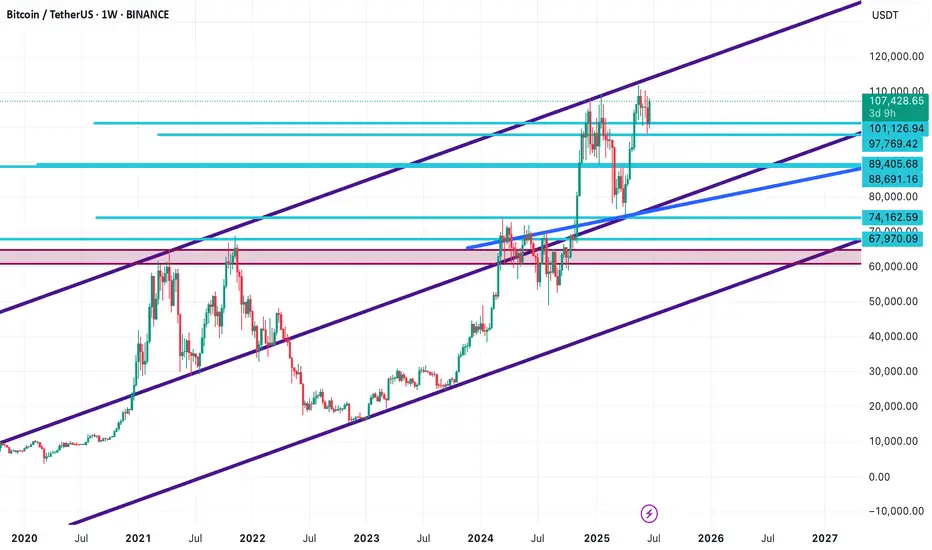
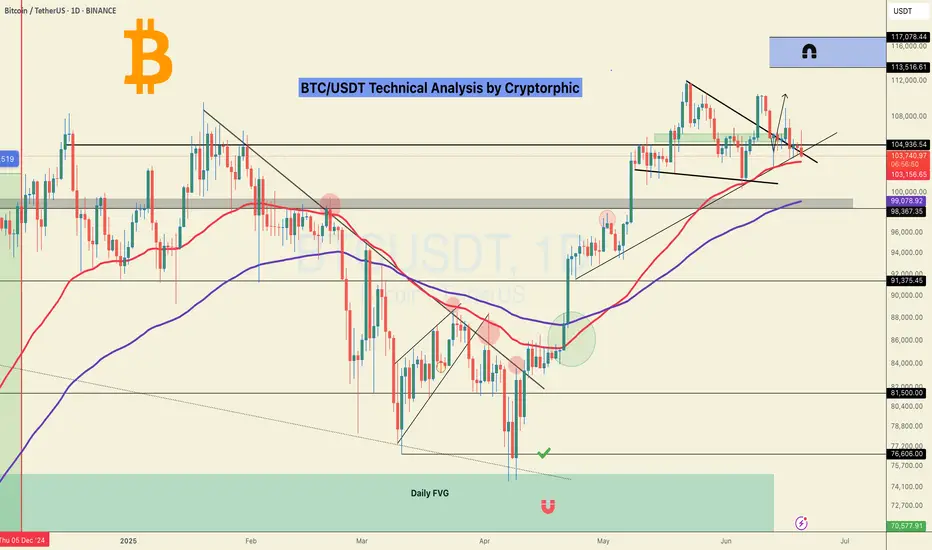
Bitcoin Technical Analysis | The Most Important Channel 📊 Bitcoin Technical Analysis | The Most Important Channel You’ll Ever See!
This might be the most critical BTC chart you come across. I've mapped out the key ascending channel that has defined Bitcoin’s long-term trend over the past few years. The upper boundary, lower boundary, and especially the midline have repeatedly acted as dynamic support and resistance levels.
Right now, BTC is trading near the channel top, with strong bullish momentum. While the buying pressure remains high and a breakout is possible, watch out for potential rejections or fakeouts around this area.
All major support and resistance levels are clearly marked in this chart. Make sure to draw this channel on your own chart and use it as a powerful tool in your trading decisions.
🧠 Follow for more high-probability setups, smart technical insights, and real-time updates!
Support Tested: Can Bitcoin Withstand Global Fear?CRYPTOCAP:BTC is struggling to hold above the key support zone after losing its rising trendline.
This weakness comes as the Israel-Iran conflict intensifies, shaking global market confidence. While BTC has often acted as a hedge, rising geopolitical tension is pushing investors toward safety, causing hesitation even at critical support levels.
A breakdown here could trigger deeper downside.
DYOR, NFA

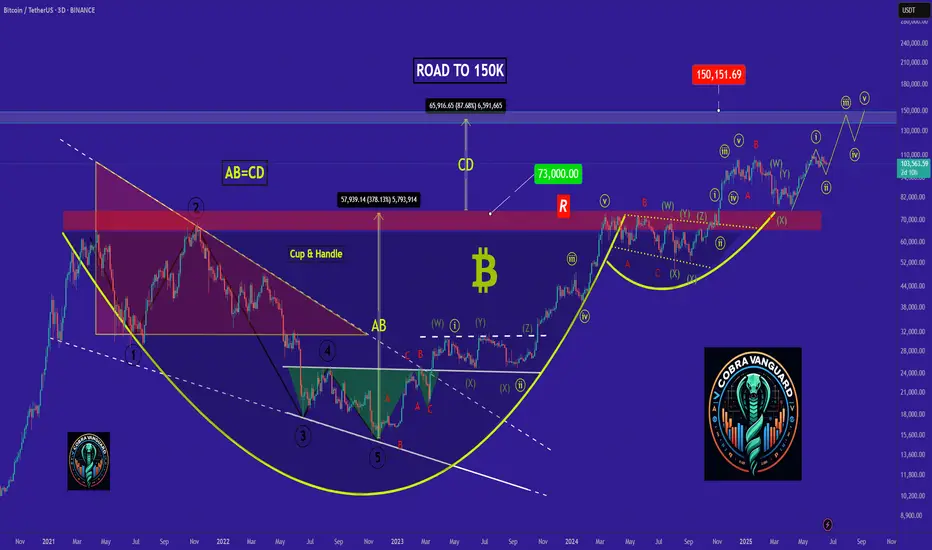
Do you think I'm joking ???The price is currently forming the second corrective wave, and a slight price drop to reach higher levels is normal.
Best regards CobraVanguard.💚
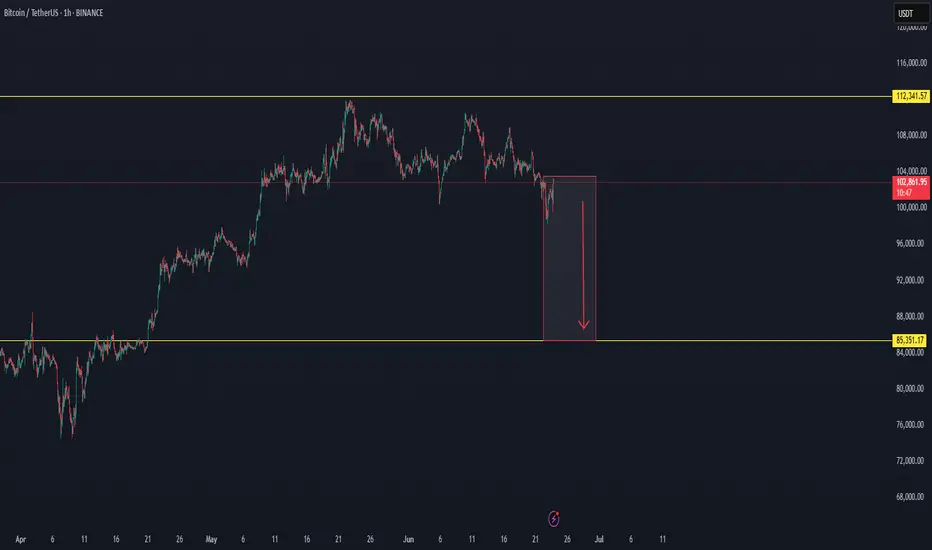
Market SIGNALS SHOW THAT BTC CAN FALL TO 85K USDMarket follow-up study shows that there is a good chance BTC can fall to 85K in the coming time period. The market cycle seems to end the green trend and to enter a new red zone.
Time will show what really can happen with BTC.
The market can make a fake trend, with a trend fall on a high time frame.
The crash can also happen on the main markets.
This is not trading advice, trade always only depending on your plan.
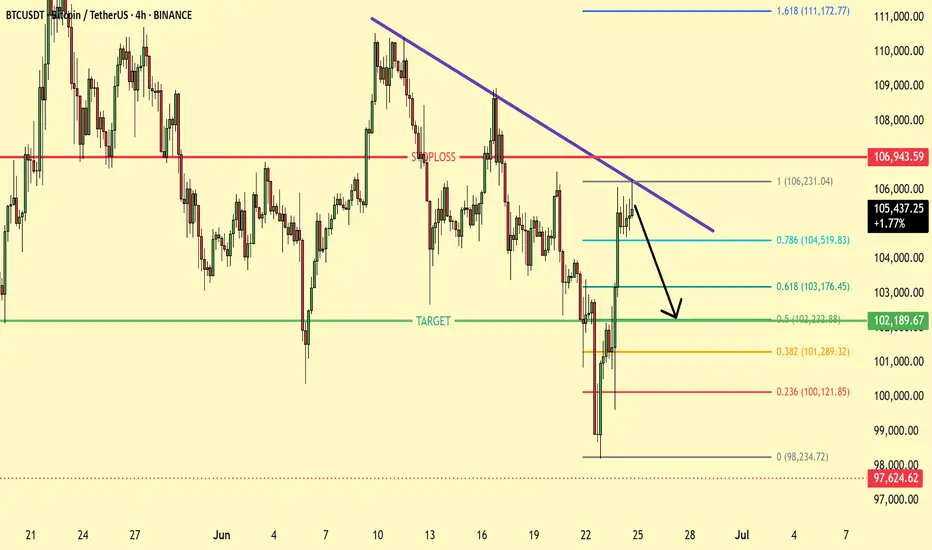
BTC rejected from the Resistance trend line BTCUSDT is currently testing a descending trendline near $105,364, with a potential bearish rejection expected. The chart suggests a short setup targeting the $102,200 area, while a break above $106,943 would invalidate the trade.
#BTC URGENT UDPATE Plus ALTCOINS Strategy.CRYPTOCAP:BTC UPDATE:
Bitcoin looks critical at the moment. The 50 EMA supports nearly $103K if this level breaks, we could see a drop toward $98.5K.
The current structure doesn’t look promising, and it’s wise to stay on the sidelines for now.
Altcoins may offer better opportunities once those lower levels are reached.
The strategy is to ladder in slowly when there are signs of reversal, until then we stay put!
Remember: nothing goes up forever, and nothing goes down forever.
Geopolitical tensions might be fueling this move, but I believe better days are ahead.
Stay patient.
Avoid high-leverage trades during this choppy, sideways price action.
Stay tuned, I’ll keep you updated the moment signs of a reversal appear.
Let me know what you think in the comment section and hit that like button if this post helped you in any way.
Thank you
#PEACE
BTCUSD next target releasedNo comment needed. All information is in the chart analysis.
Steps to follow:
Analyze yourself.
Take the position with SL and Take Profits.
Wait, it may take a couple of days, so take a break and step away from the screen from time to time, just like I do :)
Get the result.
I will update the trade every day.
Like, comment with your good mood or viewpoint, share with your circle. It’s together that we get stronger!
Good trades, Traders!
The golden bear
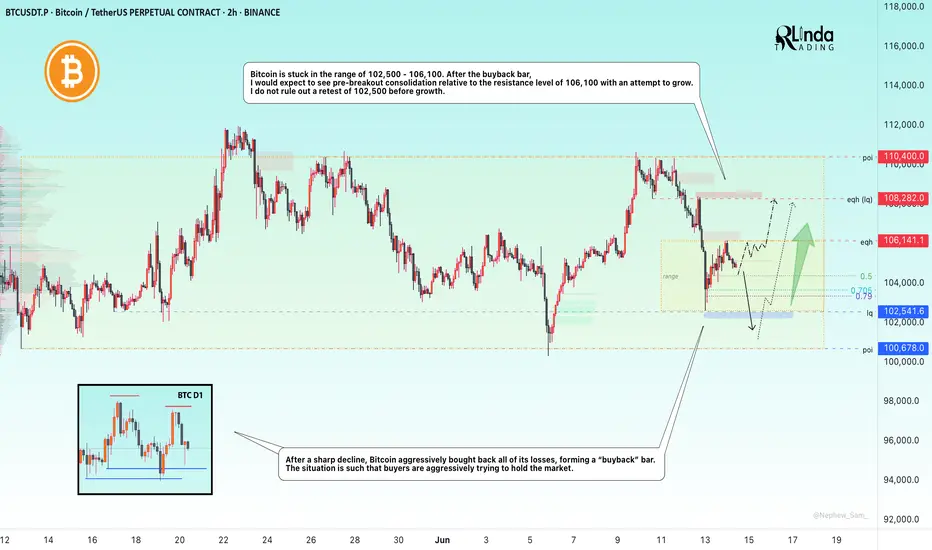
BITCOIN → Buyback bar. Chance of growth to 108,000BINANCE:BTCUSDT is trading in a fairly wide range of 100,600 - 110,400. The market is stagnating due to fundamental uncertainty, but the risks of a decline are quite high...
After the escalation of the conflict in the Middle East, Bitcoin broke the bullish structure on the market and managed to test the local level of 102500, from where a fairly aggressive phase of buying out the fall began within one trading session. The market is defending the structure quite aggressively. The chart shows a local range forming with strong levels at 102500 and 106200. Accordingly, the price may remain in this range for a long time (in which case an intraday trading strategy can be considered). However, if Bitcoin starts to stick to one of the boundaries, then we can consider the price leaving the range, but based on the structure of the uptrend, correction, and the formation of a buyback bar, it would be logical to see an attempt to break through resistance with the aim of continuing growth.
Resistance levels: 106200, 108200, 110400
Support levels: 102500, 100600
On D1, there are no prerequisites for a strong decline. The market is buying up knives and trying to stay afloat (in consolidation). In the medium term, there may be an attempt to retest 102500 - 100600 due to the liquidity pool. But locally, the market may form an attempt to grow to 108200
Best regards, R. Linda!
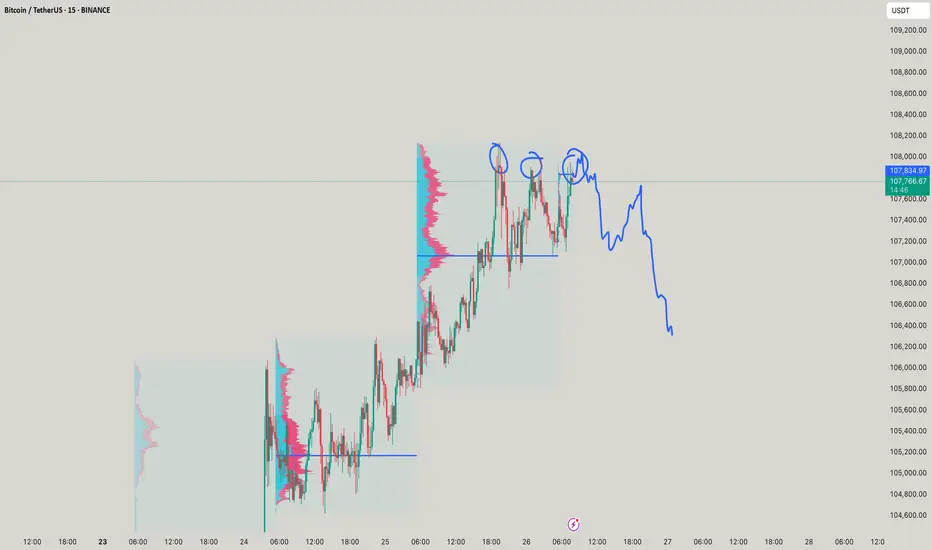
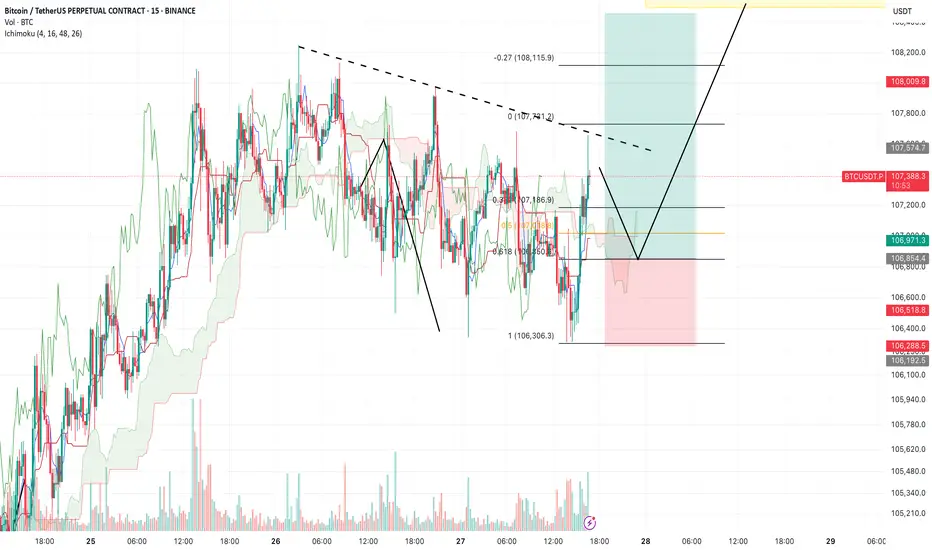
BTC/USDT.P – Intraday Plan (15m, Ichimoku) by RiscoraPrevious idea played out. The last candle showed strong volume and a wick to the upside, signaling some liquidity has been taken.
From here, I expect either a minor high above that wick or a correction down to the 0.618 area, then continuation of the bullish move towards the yellow liquidity block.
If price breaks below recent lows, the 106,300 level has proven itself as solid support—buyers have stepped in there twice with strong volume, so I’m not expecting it to give way easily.
Overall, I anticipate another push up to collect liquidity above and will reassess once price reaches the upper range.
Watching price action closely for confirmation.
#BTC #Crypto #Trading #Ichimoku #Riscora
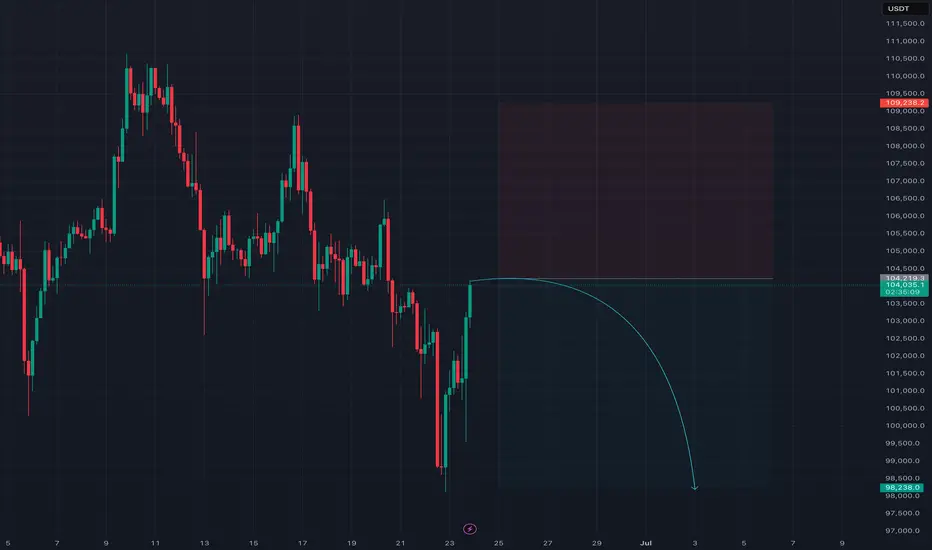
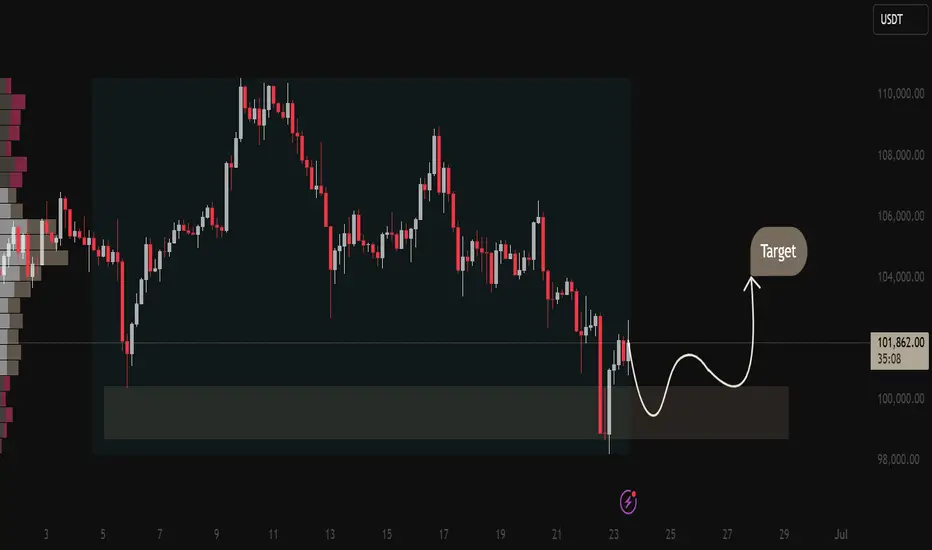
BTC/USDT Technical Outlook – Reversal Zone In Play✅ BTC/USDT Technical Outlook – Reversal Zone In Play
Current Price: 101,884.97 USDT
Structure: Bullish Reversal Setup
🧠 Market Insight:
Bitcoin has tapped into a high-probability demand zone between 100,000 – 99,300 USDT, showing clear signs of buyer absorption after extended downside pressure. The chart illustrates a strong bullish reaction from this area, hinting at a potential shift in momentum.
📈 What the Chart Tells Us:
Demand Zone Activation:
The price has tested a historically reactive demand block and bounced with strength — indicating a possible exhaustion of sellers and re-entry by larger players.
Volume Cluster Confluence:
Volume Profile shows heavy historical activity around this zone. This suggests that the current bounce is not just noise — but supported by previous institutional interest.
Path Projection (White Curve):
Market structure suggests a minor pullback followed by bullish continuation toward the 104,000–105,000 USDT target. The curved projection outlines potential market behavior leading up to this target.
Short-Term Resistance:
First key resistance is seen around 102,800–103,200 USDT. A break above this would likely trigger bullish momentum toward target levels.
🔐 Trading Insight:
Bias: Bullish (Short to Medium Term)
Entry Zone: 100,200 – 100,800 USDT (buy on minor dip)
Target Zone: 104,000 – 105,000 USDT
Invalidation: Clean breakdown below 99,000 USDT
📊 Summary:
BTC is currently sitting at a critical demand zone with bullish potential building. Price action, volume profile, and market behavior all support a reversal toward 104K+. Traders should watch for confirmation on the next pullback before entering long positions.
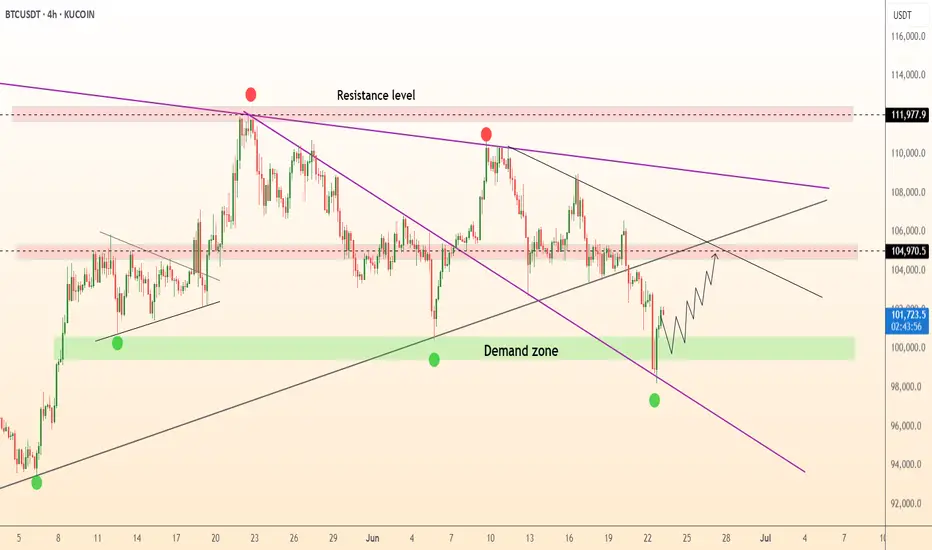
DeGRAM | BTCUSD rebound from the demand zone📊 Technical Analysis
● The BTCUSDT 4-hour chart on KUCOIN highlights a pronounced descending channel, with price action recently rebounding from a well-defined demand zone between 98,000 and 100,000. This green-shaded area has repeatedly acted as a springboard for bullish reversals, as evidenced by the strong wick and immediate recovery after the latest test. The chart also marks a series of lower highs and lower lows, but the most recent price action shows a break in bearish momentum, with a projected zigzag path indicating a potential move toward the 104,970 resistance. The confluence of the lower channel boundary and the demand zone suggests that buyers are stepping in aggressively at these levels, aiming for a retest of the upper resistance band.
● The technical setup is further reinforced by the presence of a major resistance level at 111,977, which has capped previous rallies. The chart’s structure, with its clear trendlines and highlighted resistance and support zones, points to a tactical opportunity for bulls to capitalize on the oversold conditions. The anticipated path, as drawn on the chart, suggests a gradual recovery with intermittent pullbacks, targeting the 104,970 area as the next significant hurdle. The overall pattern indicates that while the broader trend remains bearish, the immediate outlook favors a corrective rally from the current demand zone.
💡 Fundamental Analysis
● Recent fundamentals support the technical case for a short-term recovery. Over the past two days, Bitcoin has experienced heightened volatility due to escalating geopolitical tensions, notably US military action in the Middle East, which triggered a sharp sell-off and flushed out leveraged positions. Despite this, institutional accumulation remains robust, with over $1.2 billion in Bitcoin added to corporate treasuries in the last week, and Texas officially establishing a state-managed Bitcoin reserve. On-chain data shows sustained negative netflows from exchanges, indicating that large holders are moving coins to cold storage, a historically bullish signal. Meanwhile, derivatives data reveals a cautious market, with open interest skewed toward protective puts, but spot ETF inflows and long-term adoption trends continue to underpin the market.
✨ Summary
● BTCUSDT is rebounding from a key demand zone, with technicals pointing to a corrective move toward 104,970. The bullish scenario is supported by strong institutional accumulation and strategic adoption, even as short-term volatility persists. A sustained close above 104,970 would open the path to the 111,977 resistance, while a drop below 98,000 would invalidate the recovery thesis.
-------------------
Share your opinion in the comments and support the idea with a like. Thanks for your support!
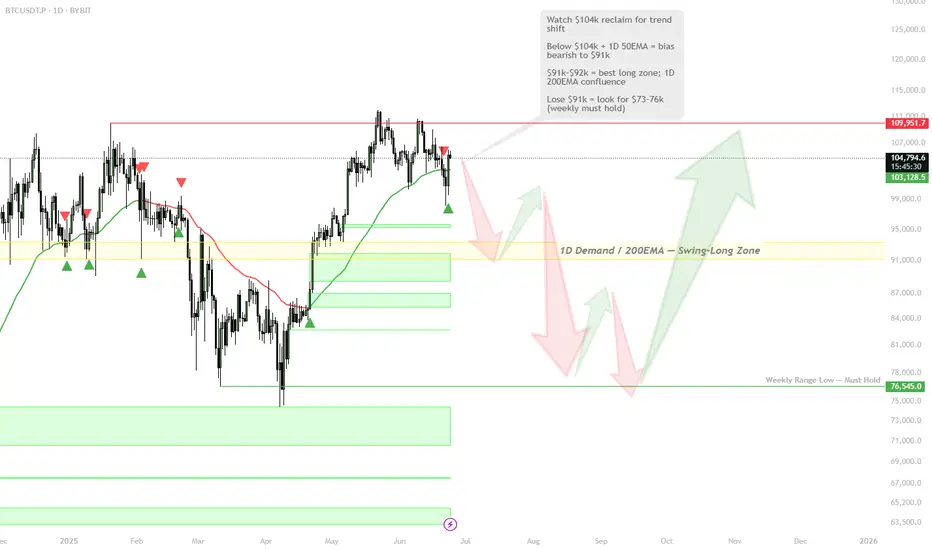
BTC at the Crossroads — $91k Demand or Deeper Flush to $76k?🎯 BINANCE:BTCUSDT Trading Plan:
Scenario 1 — Bullish Reclaim:
If price reclaims 1D 50EMA and $104k, bias flips bullish; look for continuation toward ATHs
Scenario 2 — Base Case (Favored):
Remain patient for a move to $91k–$92k; swing-long setup on signs of strength or iH&S formation
If $91k–$92k holds, expect a summer rally and new ATHs later in 2025
Scenario 3 — Breakdown:
If $91k fails, prepare for deeper move to $73k–$76k; this is the “max long” zone if tested
Must hold here; below $73k–$76k, next support is $55k
🔔 Triggers & Confirmations:
Long only above $104k + 1D 50EMA, or after bullish structure at $91k–$92k
Major long only on strong support at $76k, with clear confirmation
📝 Order Placement & Management:
Buy: On reclaim of $104k (trend confirmation) or at $91k–$92k with iH&S/reversal pattern
Backup Buy: If $76k is tagged with confirmation
Stops: Under $91k or $73k (based on entry)
Targets: New ATHs for late 2025
🚨 Risk Warning:
Losing $91k opens path to $76k; losing $76k is a major structure break
Don’t knife-catch — wait for confirmation at each level
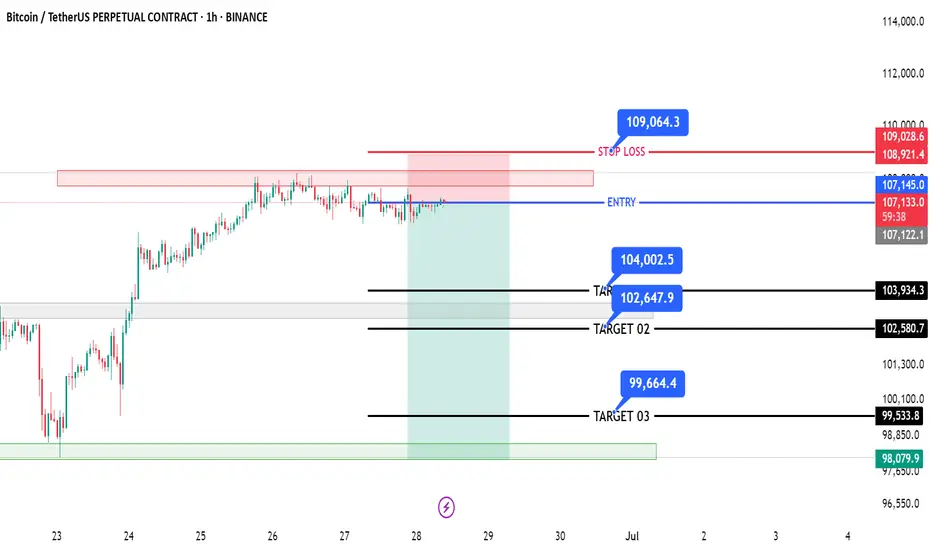
#BTCUSDT.p Bearish📉 Short Trade Alert! We're eyeing a potential downside move with a clear entry, stop loss, and multiple profit targets. Keeping a close watch on this one. #Trading #MarketAnalysis #ShortTrade #RiskReward