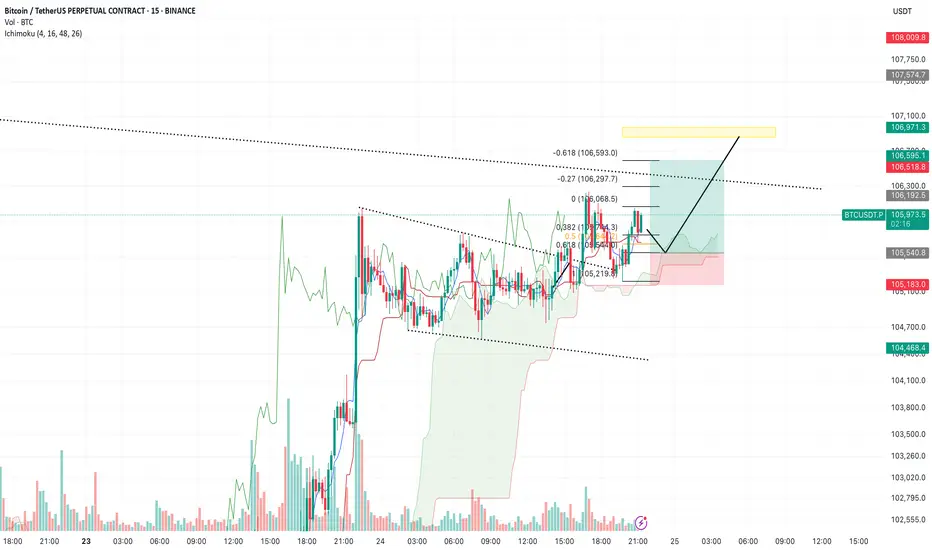
BTC/USDT – Update & New Plan (15m, Ichimoku)Previous idea recap:
Bulls proved stronger than expected — we didn’t get the move down to 104,000 as anticipated. Instead, price rallied directly to the 106,300 block, as outlined earlier, and saw only a brief pullback.
Current outlook:
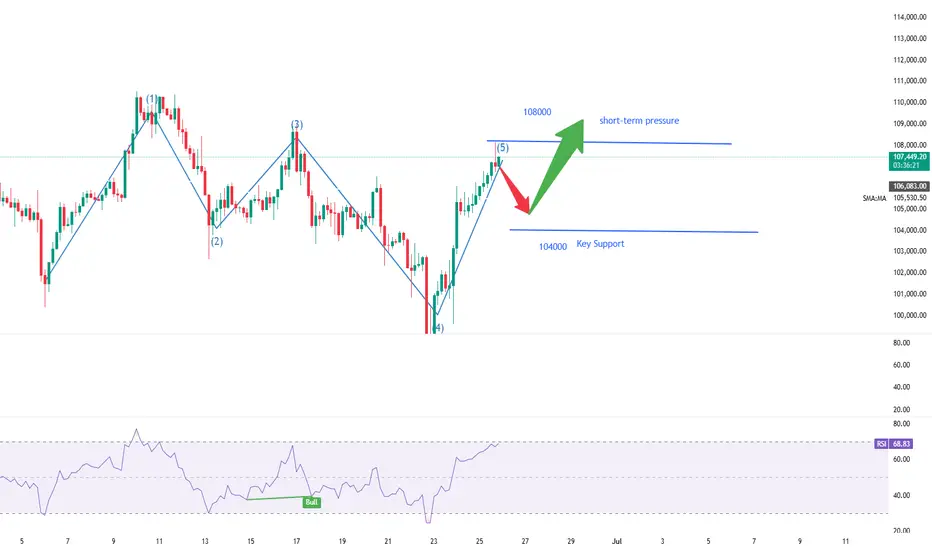
Buyers remain in control here. My new base case is a move towards 106,900 (yellow liquidity block). Ideally, I’d like to see a quick dip to the 105,550 area first, which would set up a strong launch for the next leg higher into the key liquidity zone.
Watching how price reacts on minor pullbacks — still expecting buyers to step in and push us to 106,900 where significant liquidity is stacked.
Key levels:
Minor support: 105,550
Main target: 106,900 (yellow block)
Bulls remain in control above 105,550
Will update if conditions change.
BTCUSDT.3L trade ideas
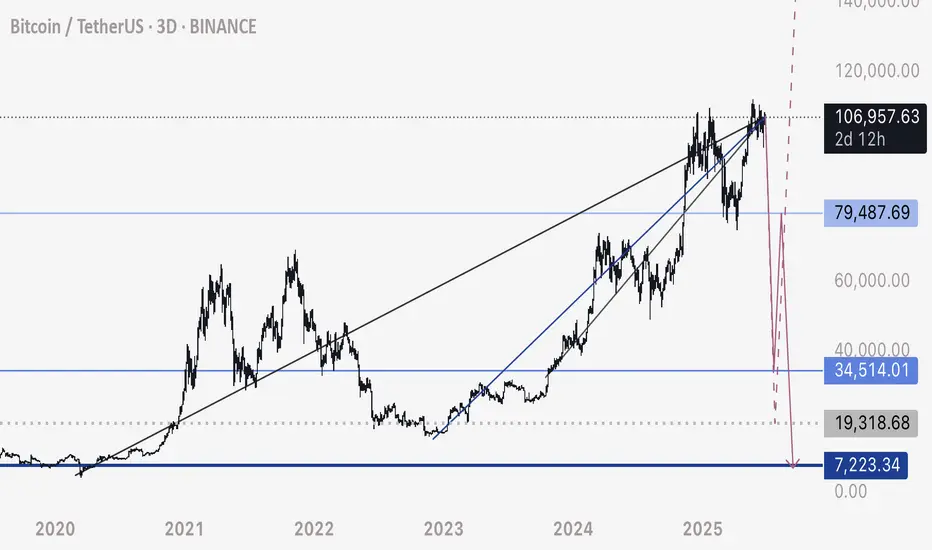
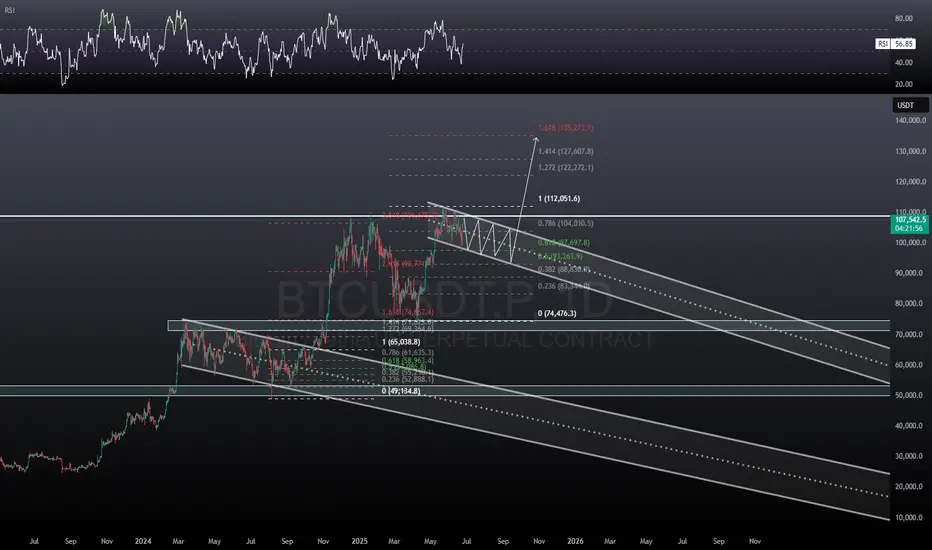
BTC: One More Leg Down?
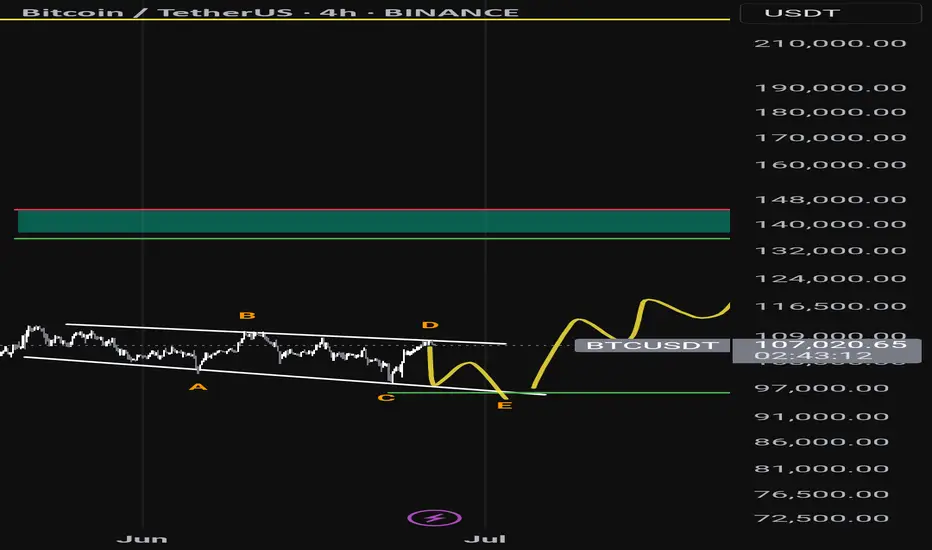
I believe the impulse BINANCE:BTCUSDT BITSTAMP:BTCUSD BINANCE:BTCUSDT.P from April to May has been completed, and we are currently in a correction phase, which is likely to continue for some time.
In the base case, I’m considering a simple zigzag pattern:
Wave A – impulsive move down
Wave B – forming a symmetrical triangle
Wave C – expected next
🎯 Target zone: 97,500, where we have a confluence of weekly FVG, 20-week MA, and vWAP.

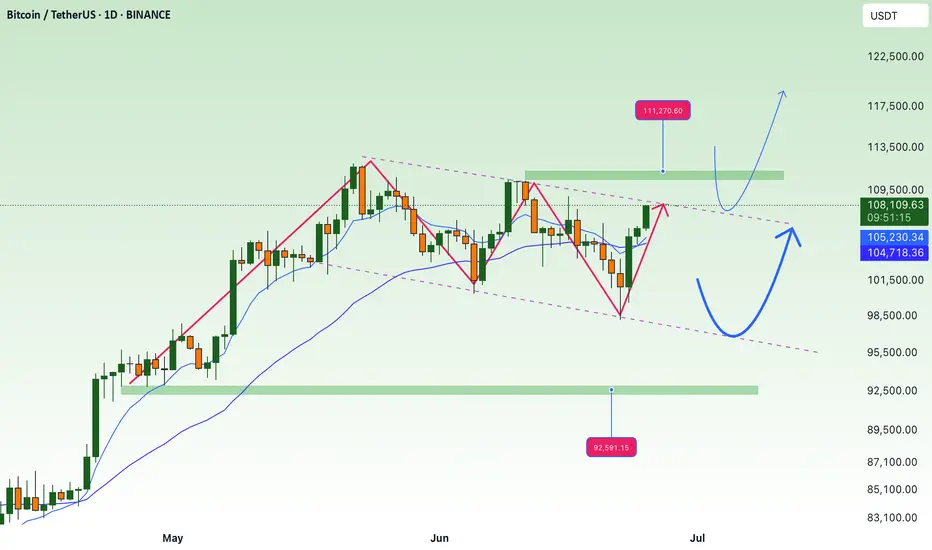
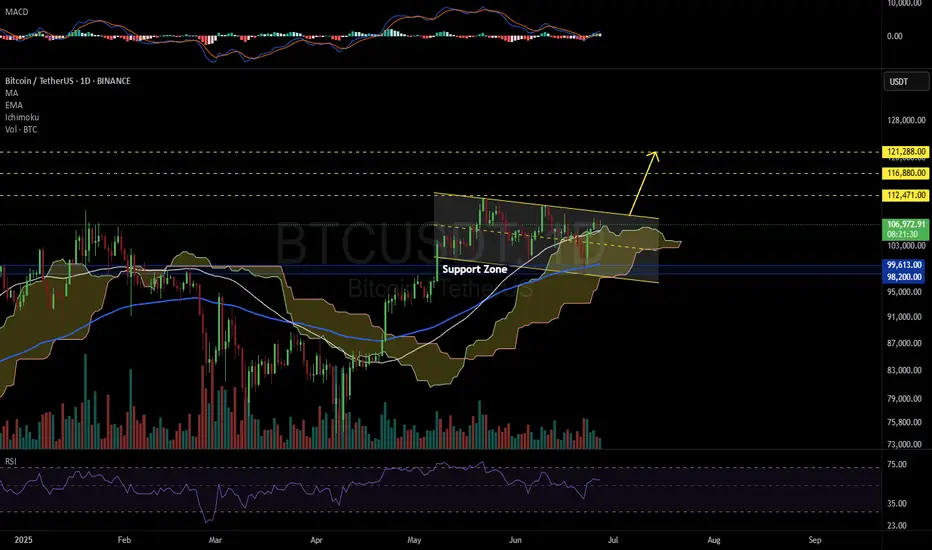
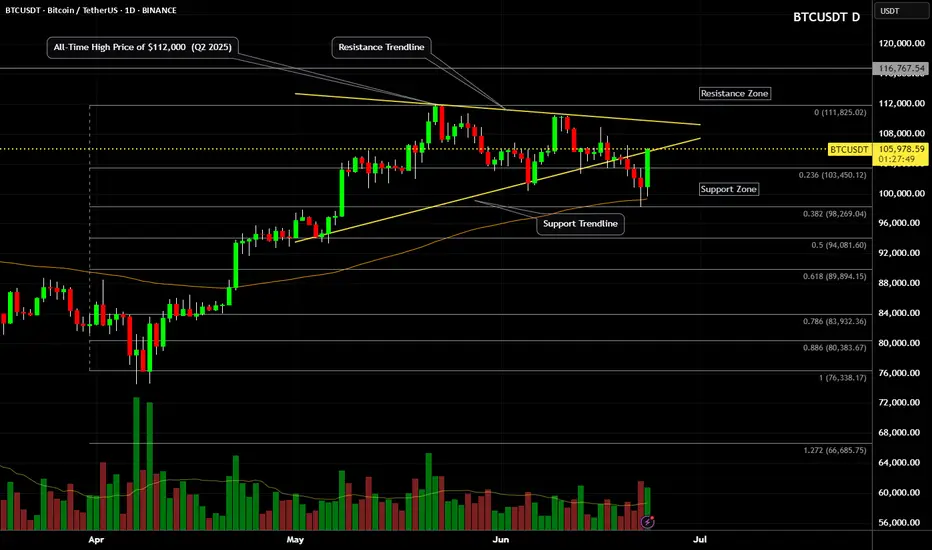
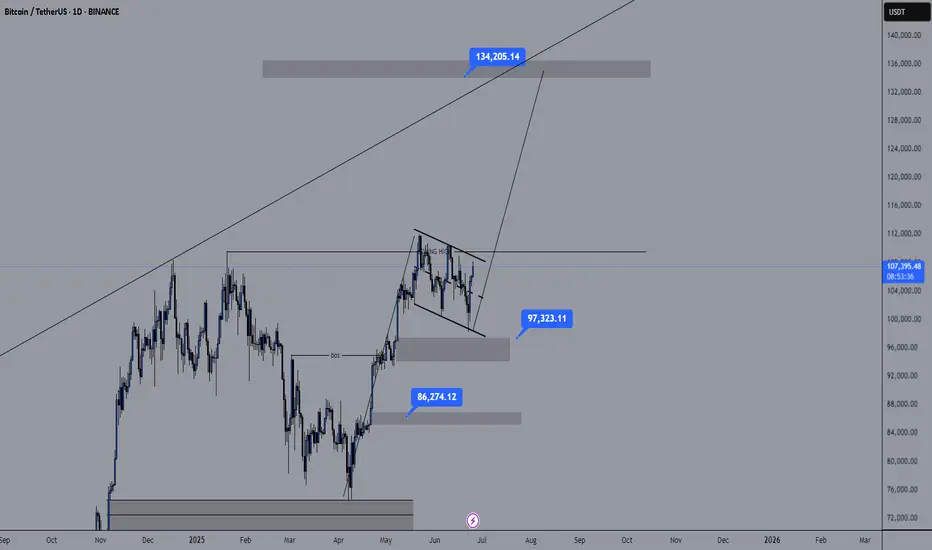
BTCUSDT 1D📈 #BTC Plan for July – Bullish Setup in Play
Bitcoin is forming a bull flag pattern on the daily chart — a classic setup that often leads to strong upward continuation when confirmed.
🔹 Key Indicators
• MACD is building positive momentum
• RSI is holding above 50
• Price is trading above the MA50 and the Ichimoku Cloud, indicating strong underlying support
📍 Strategy
We're buying here and will consider adding more near the key support zone:
$98,200 – $99,613
📈 Potential breakout targets (on confirmation):
🎯 $112,471
🎯 $116,880
🎯 $121,288
⚠️ Reminder
Always use a tight stop-loss and apply proper risk management.
Breakout confirmation with volume is crucial.
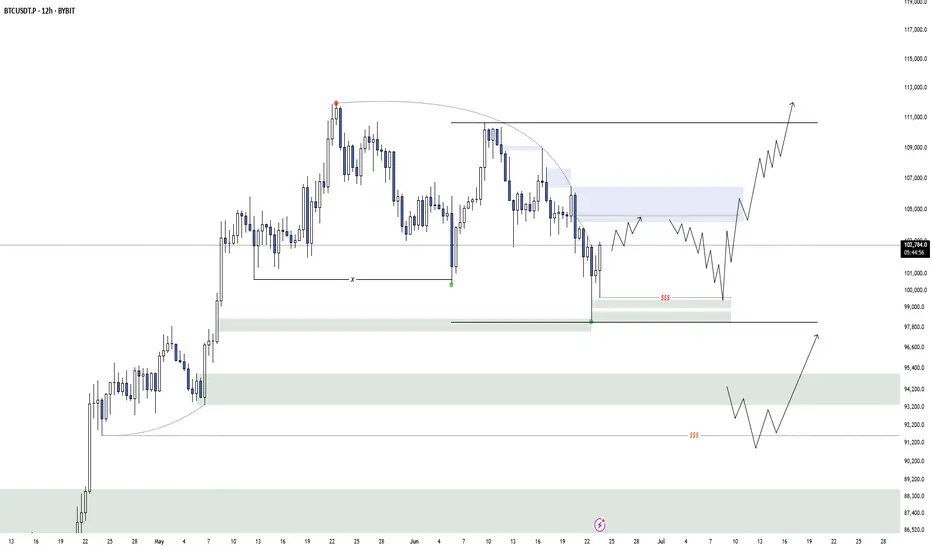
BTC MTF AccumulationThis is the current accumulation model i am watching to bring BTC back to ATH's and form the second deviation of the HTF distribution model. I would prefer if we could go lower and form a range from there, but at the moment thats all i got.
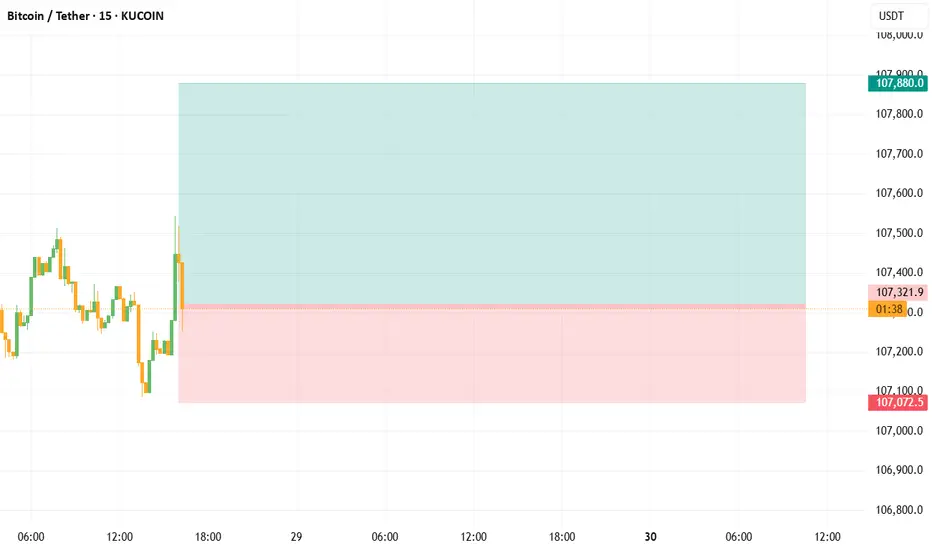
BTC/USDT high win scalping signals in 15 minutes are as follows- Signal: LONG
- Admission: 107,260 ~ 107,340
- Take Profit: 107,620, 107,880
Btcusd sell setup H4Hello! Friends,
Greetings. Please leave a Like if you like the idea.
Before start talking about technical Let's share your LOVE by giving me LIKES to support this work. Thanks in advance.
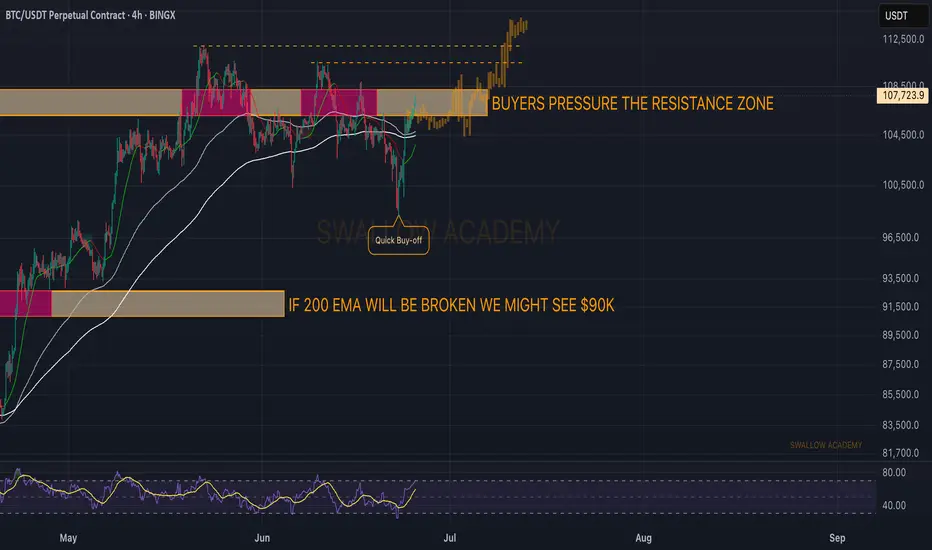
Bitcoin (BTC): Going For Another Breakout | New ATH?Bitcoin is showing strong signs of buyside movement, where we are pressuring the local resistance zone, which upon breaking should lead us to a new ATH area.
We have had multiple attempts to break out from that area, so being back here does not mean anything. yeet, we have to ave clean breakout in order to see the $120K area tested.
Swallow Academy
Is Bitcoin Signaling Risk-Off? Structure Breakdown Explained💥 BTC/USD Outlook – Is Bitcoin Losing Steam? 🧠📉
I'm keeping a close watch on Bitcoin (BTC/USD) this week, and the current price action is flashing some key signals.
🔍 Over the past several sessions, BTC has struggled to hold momentum, and we’re now seeing a shift in tone. On the 4-hour timeframe, the market structure is tilting bearish, with a pattern of lower highs and lower lows developing — a classic sign of weakness ⚠️📉.
📐 The most recent downside leg has caused a clear break in structure, and BTC is now retracing back into a potential supply zone, hovering around equilibrium of the recent move. This zone will be critical to watch for signs of seller re-entry.
⏳ On the 30-minute chart, I’m waiting for a decisive shift in structure — a break of local support or a failed rally that confirms bearish continuation. Should that play out, it could signal a high-probability short setup.
🪙 A breakdown in BTC often has broader implications — especially in the risk asset space. If we see weakness here, JPY pairs may strengthen as capital rotates into safer assets 💴🌐.
⚠️ Disclaimer:
This is not financial advice. The information provided is for educational purposes only. Please conduct your own analysis and consult a licensed professional before making any investment decisions. 📚💼

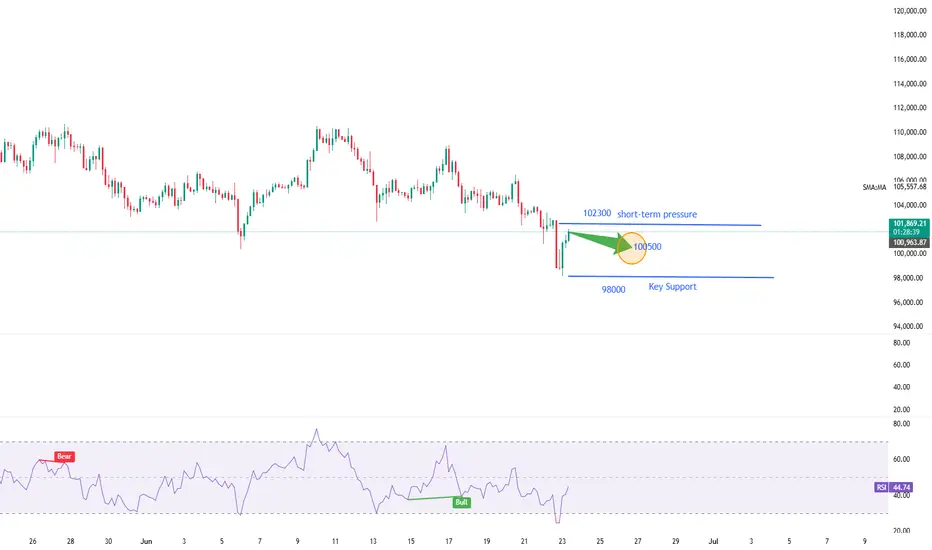
Pullback Correction after a Sharp DeclineTechnical Analysis of BTC Contracts: As of today, on the daily timeframe (major cycle), yesterday closed with a small bearish candle, showing consecutive bearish declines. The price remains below moving averages, and attached indicators are in a death cross, clearly indicating a downward trend. With the trend being evident, two key points should be noted: First, guard against significant pullback corrections; Second, risk control must be prioritized under any circumstances, which is of utmost importance.
On the hourly timeframe (short cycle), the price fell under pressure during the US session yesterday, breaking below the 100,000 level. It rebounded after hitting the intraday low in the morning. The breakdown level is near the 102,700 area. Currently, the K-line shows a large bullish rebound, and attached indicators form a golden cross, suggesting that corrective movements will prevail today. However, the breakdown level (102,700) must not be breached; otherwise, the corrective trend may fail to sustain, which aligns with typical price movement patterns.
you are currently struggling with losses,or are unsure which of the numerous trading strategies to follow,You have the option to join our VIP program. I will assist you and provide you with accurate trading signals, enabling you to navigate the financial markets with greater confidence and potentially achieve optimal trading results.
Trading Strategy:
sell@102300-102800
TP:100000-100500
Btcusdt A break above the trend line could lead to a potential run up in BTC price but a break below the purple support could lead to a drastic drop in price
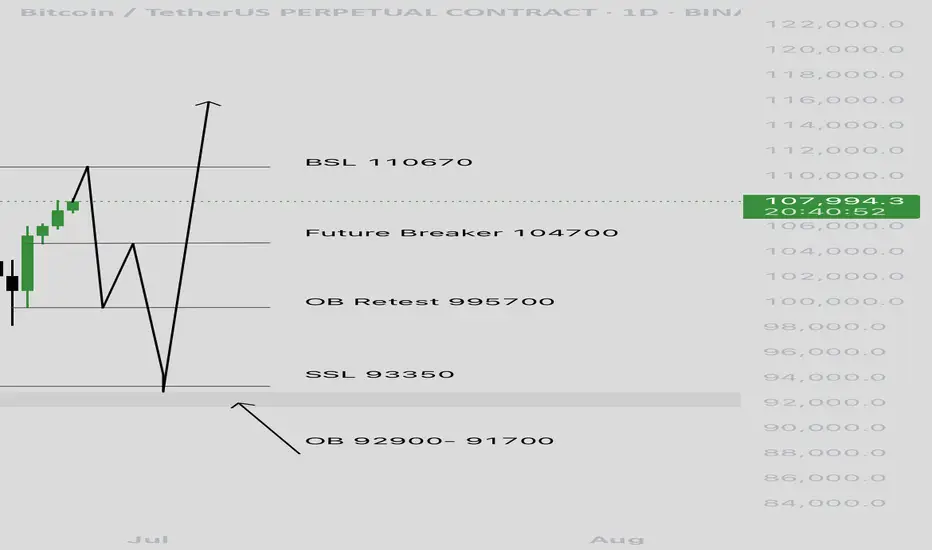
Big move for BTC - liquidity sweep + order block retest scenarioPrice could sweep the highs (BSL 110670), then reject around 104700. If that happens, I’ll look for a retest of the OB at 995700 for a possible long.
If we break lower, deeper liquidity sits around 93350, with a strong OB between 92900–91700, that’s my last line for a high-probability reversal.
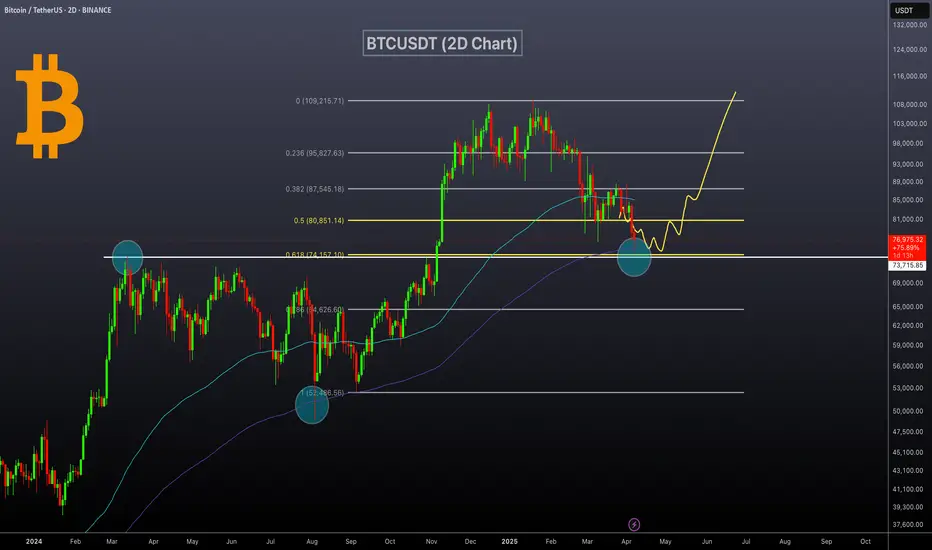
BTCUSDT: Bounce Incoming?BTCUSDT Technical analysis update
-March 2024 resistance is now expected to act as a strong support level.
-The price has touched the 0.618 Fibonacci retracement level, suggesting a potential reversal from this zone.
-The 200 EMA on the 2-day chart is positioned as a strong dynamic support, reinforcing the bullish case.
We can expect a bounce from the $72-75k level.
A Disciplined Approach to BTC/USDT - Wait for the Right Set Up!Right now, I’m closely monitoring BTC/USDT — and what immediately jumps out is how aggressively this rally has pushed upward 🚀. We’ve seen price climb into a key external range high, taking out liquidity that was likely sitting just above those prior highs 💧.
This kind of move is often where institutional players step in to offload positions, as the liquidity makes it easier to find counterparts for previous accumulation phases 🏦. The way this price action is unfolding, I wouldn't be surprised to see a correction or retracement soon.
With the market this stretched, I’m not looking to get long here — especially not while BTC is trading at such a clear premium 🎯. No edge in chasing the highs.
Instead, I’ll be sitting back, waiting for a healthy pullback and a confirmed bullish structure shift before considering any entries 🔄📊. There’s no need to force trades in these conditions. Patience protects capital 🛡️.
⚠️ As always, this is not financial advice — just my current market perspective.

Bitcoin (BTCUSDT) - Price Testing Resistance after Morning StarBitcoin (BTCUSDT) price is currently testing the resistance zone of $105,000 to $110,000 (yellow lines).
A morning star candle pattern has formed above the 100 ema (orange line), which is also $100,000 price support.
Some bullish momentum is forming on the MACD Histogram, however, Bitcoin is still technically in a short-term downtrend for the past 30 days.
Bitcoin price needs to create a new uptrend on the daily chart, a series of higher-highs and higher-lows in the price, which could take several months.
At this time, Bitcoin is still reacting to global news and stock market correlations.
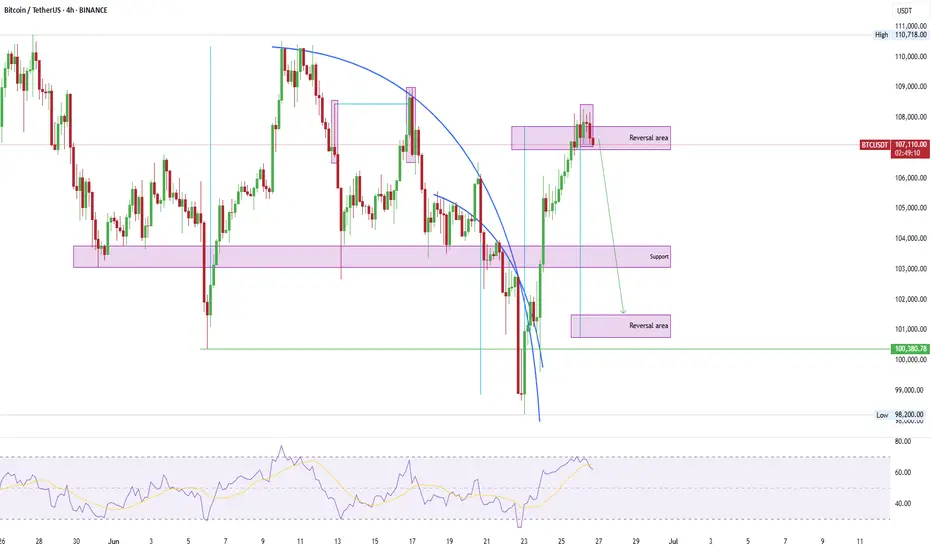
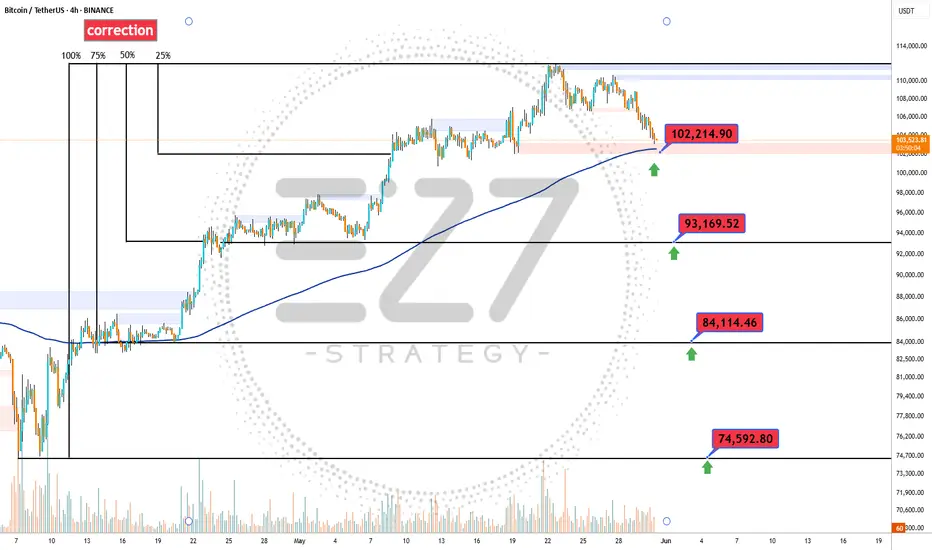
BTC Correction's 📉 Significant Bitcoin Correction During Uptrend
After a strong bullish rally, Bitcoin has entered a correction phase, retracing nearly 25% of its recent gains. Interestingly, this correction aligns exactly with the 200-period moving average on the 4-hour chart, marking a potential key support level.
🔍 Is Bitcoin’s Correction Over or Just Beginning?
The overlap with the 200 MA could signal the end of the correction, but if this zone fails to hold, deeper targets between the 35% and 75% retracement levels may come into play.
🛡️ Potential Support Levels for Bitcoin if the Correction Continues:
First support: 102,200 USD – 25% correction
Second support: 93,200 USD – 35% correction
Third support: 84,100 USD – 50% correction
Fourth support: 74,600 USD – 75% correction
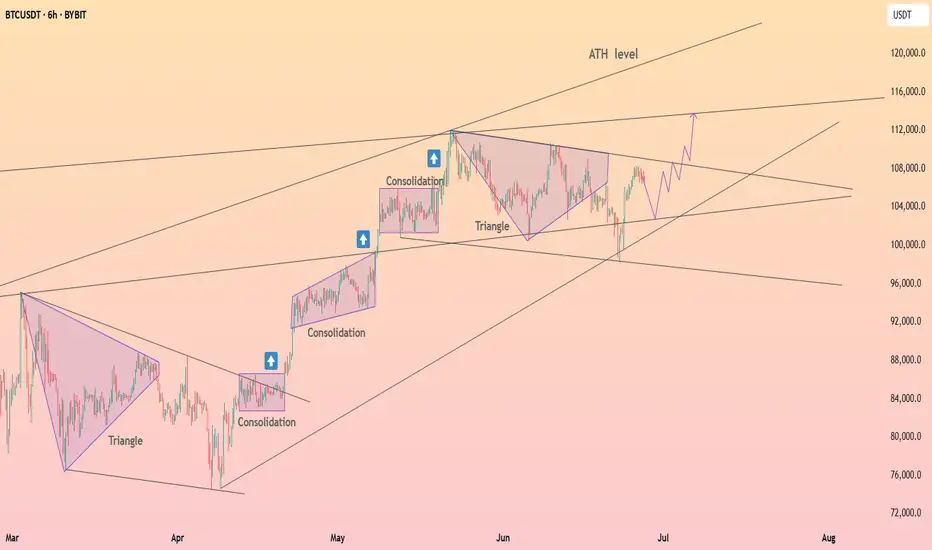
HolderStat┆BTCUSD aiming for 112kBINANCE:BTCUSDT is forming a bullish continuation structure after bouncing from the mid-range. With support holding and consolidation patterns completing, price action suggests a rally toward the 115,000 resistance line. Triangle and consolidation behavior confirms a strong uptrend continuation setup.
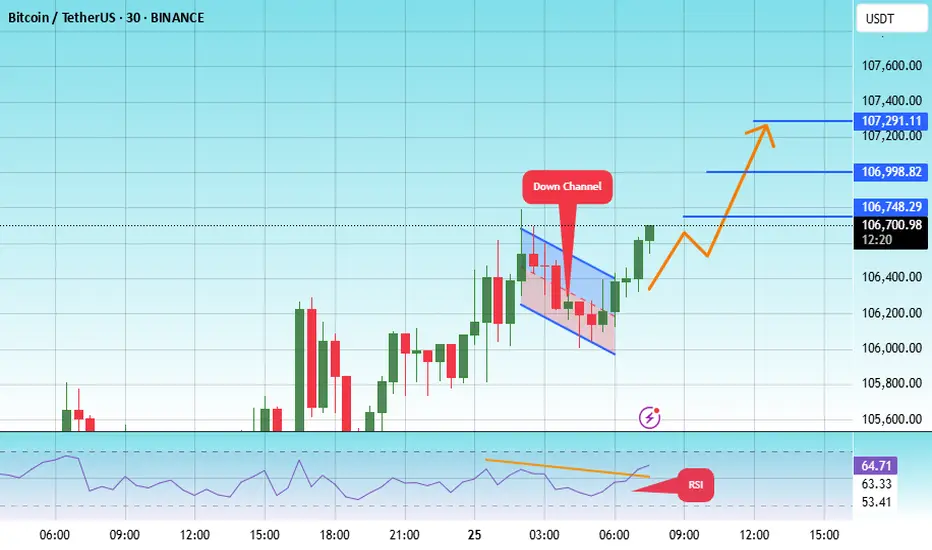
#BTC/UST#BTC
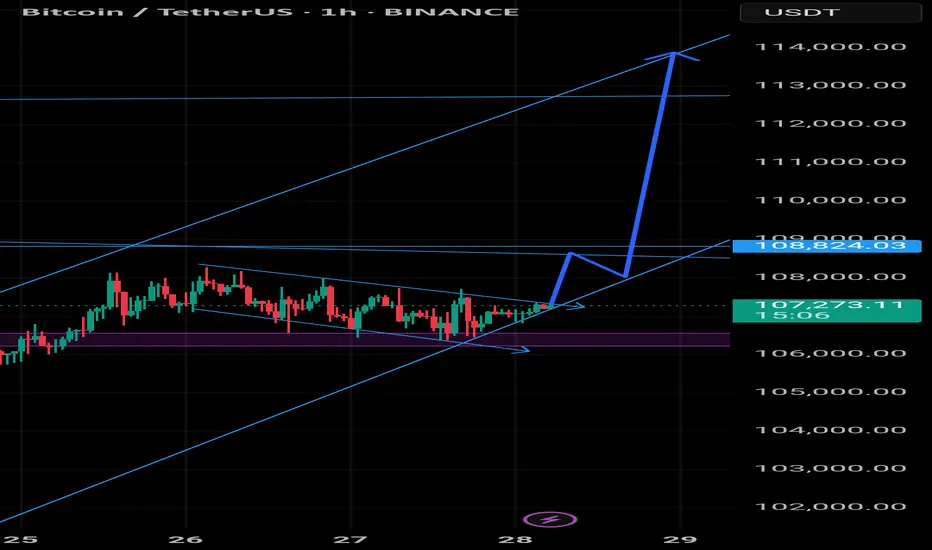
The price is moving within a descending channel on the 1-hour frame, adhering well to it, and is on its way to breaking it strongly upwards and retesting it.
We are seeing a rebound from the lower boundary of the descending channel, which is support at 106,000.
We have a downtrend on the RSI indicator that is about to break and retest, supporting the upward trend.
We are looking for stability above the 100 moving average.
Entry price: 106,600
First target: 106,750
Second target: 107,000
Third target: 107,291
Why BTC hasn’t moved up recentlyBTC has been bobbing above and below this bearish triple crossover the past few months. What we see as consolidation is rather price getting stuck around these resistance levels.
The only reason why this would be occurring in my view, is due to the market makers having intention to allow this drop to play out.
The resistance is located at around 107,000 to 107,400 - watch this zone closely for a hold below / rejection and fast drop.
Scenario 1 marked with solid red line.
Scenario 2 marked with dotted red line.
Little update for y’all. Happy weekend trading.
BTC gonna surprise us its not the end for btc
looks very juicy
last bull flag gave huge pump
will this bullflag will be the same ?
place ur bets
Here is an analysis of the latest Bitcoin market trendBitcoin has surged to around $106,700 at its peak and hovered around $104,800 at its low. Overall, the trend remains relatively stable, continuing to stay at a relatively high level. What is driving the market?
First, institutional funds have flowed in again. Recently, many investors have bought Bitcoin through ETFs, with substantial capital inflows, which has formed support for this price level.
Second, the technical outlook is promising. Various technical indicators suggest that it is still a bullish market, meaning the price may continue to rise.
Third, regarding support and resistance levels: if the price declines, it may first find support near $104,000. If it breaks upward, the next target is roughly between $108,000 and $110,000.
What about the short-term trend? If it can break through $107,000, it may then surge toward $109,000 or even the high of $112,000. If it fails to break through, it may fluctuate repeatedly within the range of $104,000 to $106,000 for a period.
you are currently struggling with losses,or are unsure which of the numerous trading strategies to follow,You have the option to join our VIP program. I will assist you and provide you with accurate trading signals, enabling you to navigate the financial markets with greater confidence and potentially achieve optimal trading results.
Trading Strategy:
buy@104300-104800
TP:107000-107500
Do you think it supports this model?After two weeks away from you, I am back.
Hello friends, as some of you dear ones know, I live in Iran, and due to the two-week war in Iran, I was not in the mood for analysis, nor was the internet helpful.
But I came back to you so that we can identify the profits together.
.
The chart you see has formed an old pattern (flag pattern), and if it breaks out of this pattern from above, we can expect an increase as large as the previous lag.
The target of this increase is the area that we had mentioned in previous Bitcoin analyses. (You can enter the page and look at the analyses)
.
I hope you have used this analysis well.
I wish you complete peace wherever you are.
You can follow the page to see more analyses, hoping for good days.
BTC recovers, price range sideways trend line💎 Update Plan BTC (June 25)
Notable news about BTC:
🌐 Growth stimulus factor
Reducing geopolitical tensions: The ceasefire agreement between Iran and Israel has helped improve investor psychology, promote capital inflows into risky assets like Bitcoin.
The dollar weakened: The USD index dropped to the lowest level in a year due to concerns about the economic impact from President Trump's tax policies, making Bitcoin a more attractive choice for investors to search for replacement assets.
Expectations for monetary policy: The decision of the US Federal Reserve (Fed) on keeping interest rates stable and interest rate cutting capacity in July has motivated the cryptocurrency market.
Technical analysis angle
Bitcoin may increase to the highest level of all time
Bitcoin price reached the lowest level of $ 98,200 on Sunday but has recovered strongly 5% in the next two days, closed on the dynamic average line according to the 50 -day exponential jaw at $ 103,352. At the time of writing on Monday, the price continued to trade higher at about $ 106,500.
If BTC continues to increase, the price can expand the momentum to the highest level of all time is $ 111,980 on May 22.
The relative power index (RSI) on the daily chart is 54, higher than the neutral level of 50, showing the motivation for price increase. The average divergent divergence (MACD) is referring to the price intersection (the MACD is about to cut on the signal line), if completed, the purchase signal will be made.
==> Comments for trend reference. Wishing investors successfully trading