Today's BTC trading strategy, I hope it will be helpful to youBitcoin Trading Strategy: Navigating $101,000 Volatility with a Three-Dimensional Model
Current Bitcoin prices oscillating near $101,000 reflect more than just technical support battles—they embody an expectation gap between policy implementation timelines and institutional fund flows. This strategy constructs a "Policy-Funds-Technology" three-dimensional analysis model, using the U.S. *Genius Act* House voting process and Hong Kong's *Stablecoin Ordinance* countdown as policy anchors, institutional behavior differences (e.g., MicroStrategy增持 vs. Grayscale fund flows) as funding validation, and key technical breakouts as entry signals for a dynamically adjusted trading system.
I. Policy Landscape: Dual Catalysts on the Horizon
- **U.S. *Genius Act* Legislative Progress**: The Senate passed the *Genius Act* with a 68:30 supermajority, and Trump has publicly pressed the House to expedite voting, with markets expecting final legislation by mid-late July. The bill requires stablecoin issuers to maintain 100% dollar/T-bill reserves, effectively integrating stablecoins into the "digital dollar" system. This is expected to attract ~$20 billion in institutional capital via compliant channels.
- **Hong Kong *Stablecoin Ordinance* Launch**: Scheduled to take effect on August 1, the ordinance has prompted institutions like Standard Chartered and JD.com to prepare license applications. The introduction of offshore RMB stablecoins will create new liquidity entry points for Bitcoin.
II. Funding Dynamics: Institutional Long-Term Conviction vs. Short-Term Positioning
- **MicroStrategy's Bold Accumulation**: The firm's holdings surpassed 330,000 BTC after a June 22 purchase, with an average cost of $88,627—current prices yield a 14% unrealized gain, demonstrating corporate investors' long-term confidence.
- **Grayscale GBTC Contrast**: $46.3 million flowed out of GBTC in the week ending June 20, reflecting institutional portfolio optimization ahead of policy milestones.
- **Tron USDT Liquidity Base**: With circulation exceeding $70 billion (50% of global USDT) and $80 billion daily transaction volume, Tron's stablecoin provides robust liquidity support for Bitcoin.
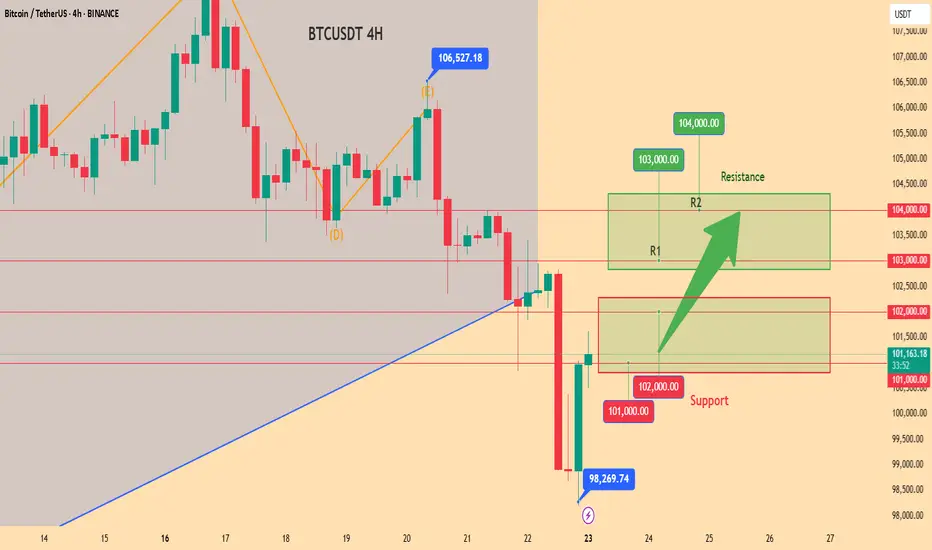
III. Technical Confirmation Mechanisms for $101,000
1. Short-Term Support Validation:
- Price forms a "Morning Star" candlestick pattern within $100,000-$101,000, accompanied by 20% higher trading volume than the prior day.
2. Trend Breakout Confirmation:
- RSI rebounds from below 40 to above 50, coinciding with a decisive price突破 (breakout) of the intraday resistance at $102,000.
**Trading Tactics**:
- **Aggressive Entry**: Long positions on confirmed Morning Star patterns, with stop-loss below $100,000 (2% below support).
- **Breakout Follow-through**: Add to positions above $102,000, targeting $105,000 resistance.
- **Risk Control**: Maintain position sizes below 15% of portfolio, with profit-taking triggers set at 3%–5% intervals.
This framework balances policy-driven structural shifts with tactical technical signals, enabling traders to navigate the volatility gap between institutional long-termism and short-term market noise.
Today's BTC trading strategy, I hope it will be helpful to you
BTCUSDT BUY@101000~102000
SL:98000
TP:103000~104000
BTCUSDT.3L trade ideas
Example of how to draw a trend line using the StochRSI indicator
Hello, traders.
If you "Follow", you can always get new information quickly.
Have a nice day today.
-------------------------------------
We use the StochRSI indicator to draw a trend line.
We draw a trend line by connecting the peaks of the StochRSI indicator, i.e. the K line, when they are created in the overbought area or when they are created in the overbought area.
That is, when the K line of the StochRSI indicator forms a peak in the overbought area, the trend line is drawn by connecting the Open values of the falling candles.
If the candle corresponding to the peak of the StochRSI indicator is a rising candle, move to the right and use the Open value of the first falling candle.
When drawing the first trend line, draw it from the latest candle.
Since the third trend line indicates a new trend, do not draw anything after the third trend line.
The currently drawn trend line corresponds to the high-point trend line.
-
Therefore, you should also draw the low-point trend line.
The low-point trend line is drawn by connecting the K line of the StochRSI indicator when the top is formed in the oversold zone.
The low-point trend line uses the low value of the candle when the K line of the StochRSI indicator forms the top in the oversold zone.
That is, it doesn't matter whether the candle is a bearish candle or a bullish candle.
The drawing method is the same as when drawing the high-point trend line, drawing from the latest candle.
The top of the best K line of the StochRSI indicator was not formed within the oversold zone.
(The top is indicated by the section marked with a circle.)
Since the trend line was not formed, the principle is not to draw it.
If you want to draw it and see it, it is better to display it differently from the existing trend line so that it is intuitively different from the existing trend line.
-
The chart below is a chart that displays the trend line drawn separately above as a whole.
It is also good to distinguish which trend line it is by changing the color of the high-point trend line and the low-point trend line.
The chart below is a chart that distinguishes the high-point trend line in blue (#5b9cf6) and the low-point trend line in light green (#00ff00).
The low-point trend line is a line drawn when the trend has changed, so it does not have much meaning, but it still provides good information for calculating the volatility period.
-
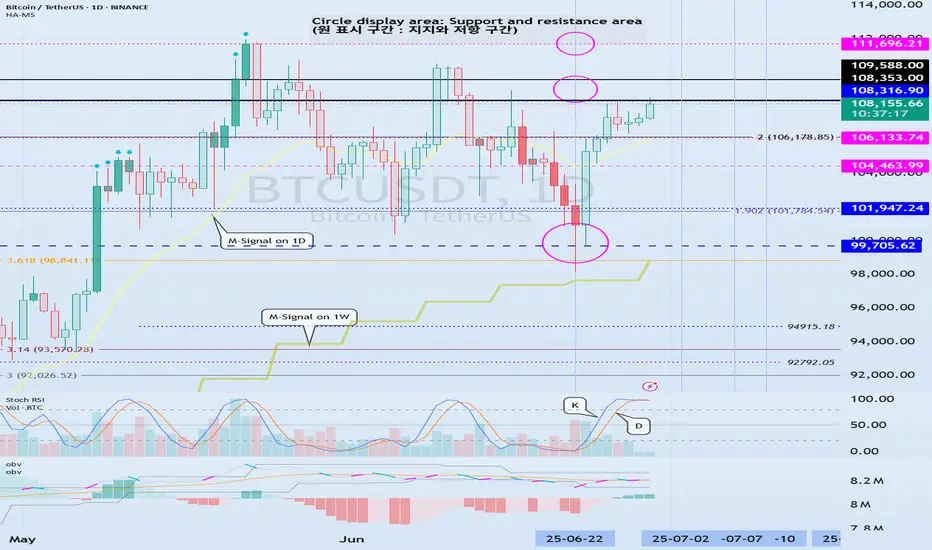
To calculate the volatility period, support and resistance points drawn on the 1M, 1W, and 1D charts are required.
However, since I am currently explaining how to draw a trend line, it is only drawn on the 1M chart.
-
I use the indicators used in my chart to indicate support and resistance points.
That is, I use the DOM(60), DOM(-60), HA-Low, HA-High, and OBV indicators to indicate support and resistance points.
Since the DOM(-60) and HA-Low indicators are not displayed on the 1M chart, I have shown the 1W chart as an example.
The indicators displayed up to the current candle correspond to the main support and resistance points.
Although it is not displayed up to the current candle, the point where the horizontal line is long is drawn as the sub-support and resistance point.
It is recommended to mark them separately to distinguish the main support and resistance point and the sub-support and resistance point.
The trend line drawn in this way and the support and resistance points are correlated on the 1D chart and the volatility period is calculated.
(For example, it was drawn on the 1M chart.)
The sections marked as circles are the points that serve as the basis for calculating the volatility period.
That is,
- The point where multiple trend lines intersect
- The point where the trend line and the support and resistance points intersect
Select the point that satisfies the above cases at the same time to display the volatility period.
When the point of calculating the volatility period is ambiguous, move to the left and select the first candle.
This is because it is meaningless to display it after the volatility period has passed.
If possible, the more points that are satisfied at the same time, the stronger the volatility period.
If the K-line peak of the StochRSI indicator is formed outside the overbought or oversold zone, it is better to exclude it when calculating the volatility period.
-
The chart below is a chart drawn on a 1D chart by summarizing the above contents.
The reason why there are so many lines is because of this reason.
For those who are not familiar with my charts, I have been simplifying the charts as much as possible these days.
However, when explaining, I have shown all the indicators to help you understand the explanation.
-
Thank you for reading to the end.
I hope you have a successful trade.
--------------------------------------------------
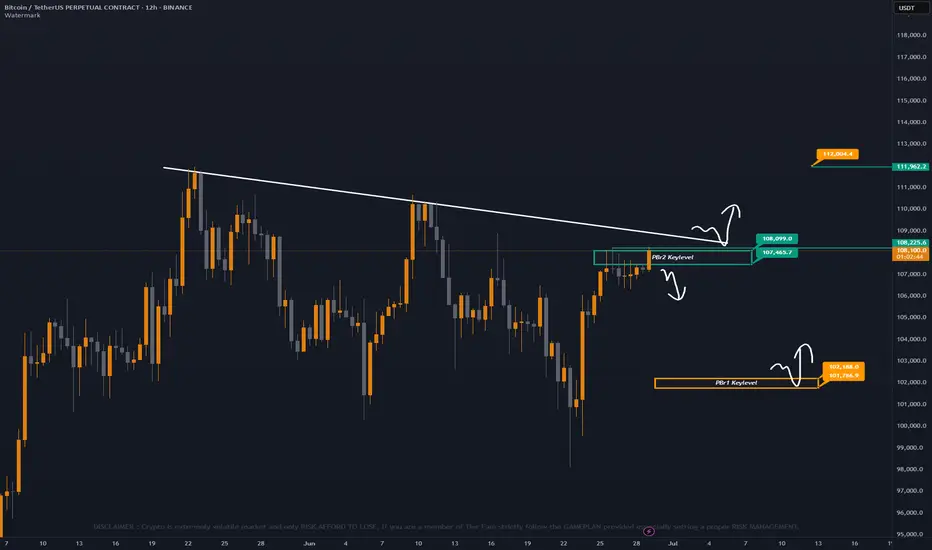
Bitcoin Update
Just to make it simple panda fam, Lets analyze it ! 💭
— Scenario #1 - PBr2 still possible we get rejected since we are on PBr2 keylevel resistance ranging 108099 - 107465, Same time we are under major trend resistance also. 📉
— Scenario #2 - PBr1 bounce support at 102188 - 101786 this will be valid if we get rejected at PBr2 and retest as normal correction movement. 🐂
— Scenario #3 - Breakout above major trend resistance, valid if we sit on trend major resistance as support . Short term possible target at 112004. 🚀
Always trade safe and stay updated to our updates panda fam ! Kupit kupit lang muna tayo sa altcoins. 🙌
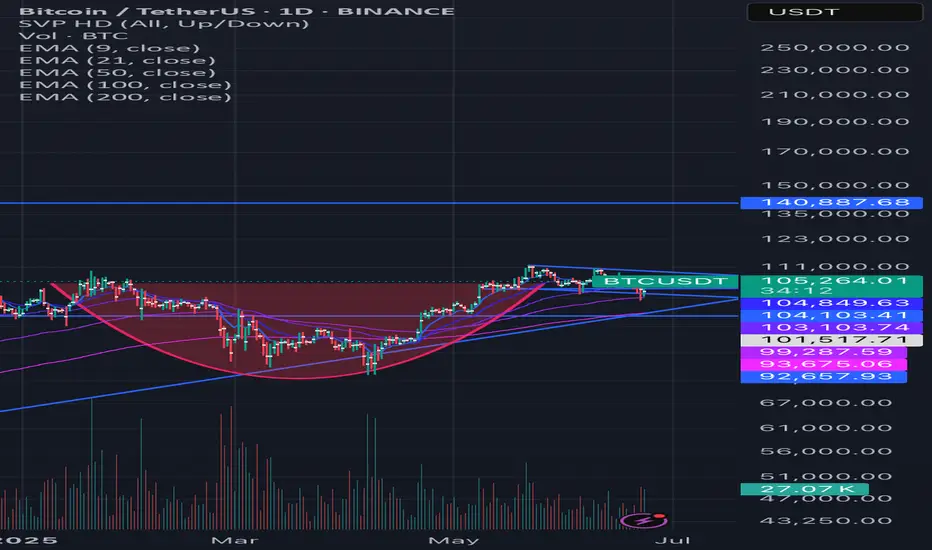
BTC cup and handle After today’s bounce off the bottom trend line, it looks like a clear cup and handle pattern forming on BTCUSD Usually indicating a measured move around the height of the cup. Target 140k. I would be buying around the bottom of the bear channel if it retests the trendline.
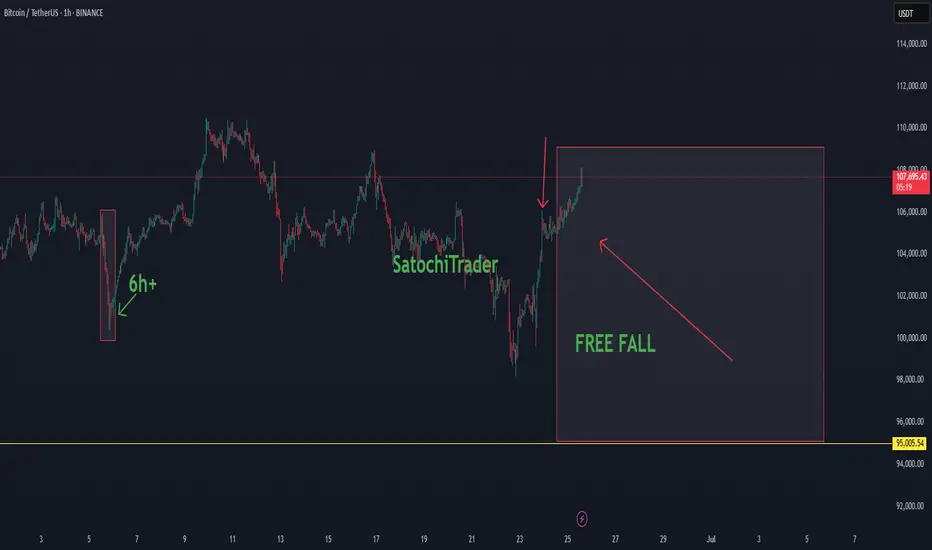
SatochiTrader Expecting a huge BTC CRASH AFTER This..BTC Market Update by SatochiTrader
EVERY CRASH DID START WITH A FALSE INCREASE TREND.
Depending on the market sentiment and price action, BTC is currently showing strength with a positive trend. However, based on deeper data and insights held by myself and a small group of early-cycle followers, this current movement may be a deceptive signal — potentially foreshadowing a major crash.
This is not trading advice. Those who are confident in the long position should continue, and those on the other side should stay prepared as well.
We have previously explained that the current cycle appears to have ended. Since 2013, BTC has consistently respected its macro cycle targets. The end of such a cycle typically leads to significant corrections.
A cycle ending implies not just a retracement, but the potential for a major crash. Hedge funds and real BTC whales understand the underlying indicators and risks at play. Our expectation remains clear: BTC may soon fall below the 100K level, with $85K identified as a critical support and target zone.
Stay sharp. Stay informed. The market may look bullish — until it isn't.
The best way to follow BTC is not the news.. but the cycle overview.
This update is an education update, which means the high expectations of the upcoming correction for BTC.
Compared to last quarter, miners are now less severely underpaid, though profitability remains low
BTCUSDTHello traders. Wishing each of you a great weekend ahead!
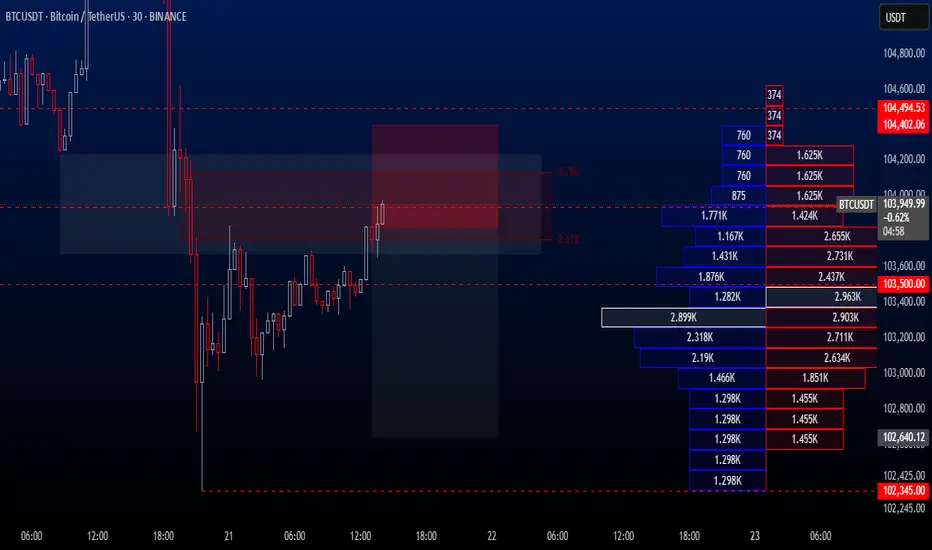
Even though it's the weekend, I’ve spotted a sell opportunity on the BTCUSDT pair and decided to share it with you. However, we should also keep in mind that weekend markets tend to have lower volume. That said, I will still proceed with this trade based on my own risk parameters and trading strategy.
🔍 Trade Details
✔️ Timeframe: 30-Minute
✔️ Risk-to-Reward Ratio: 1:2
✔️ Trade Direction: Sell
✔️ Entry Price: 103815.32
✔️ Take Profit: 102640.12
✔️ Stop Loss: 104402.06
🕒 If the trade does not continue with strong momentum, I will keep the position open only until 23:00 today. Otherwise, I will close it either in profit or at a loss depending on the price action.
🔔 Disclaimer: This is not financial advice. I’m simply sharing a trade I’ve taken based on my personal trading system, strictly for educational and illustrative purposes.
📌 Interested in a systematic, data-driven trading approach?
💡 Follow the page and turn on notifications to stay updated on future trade setups and advanced market insights.
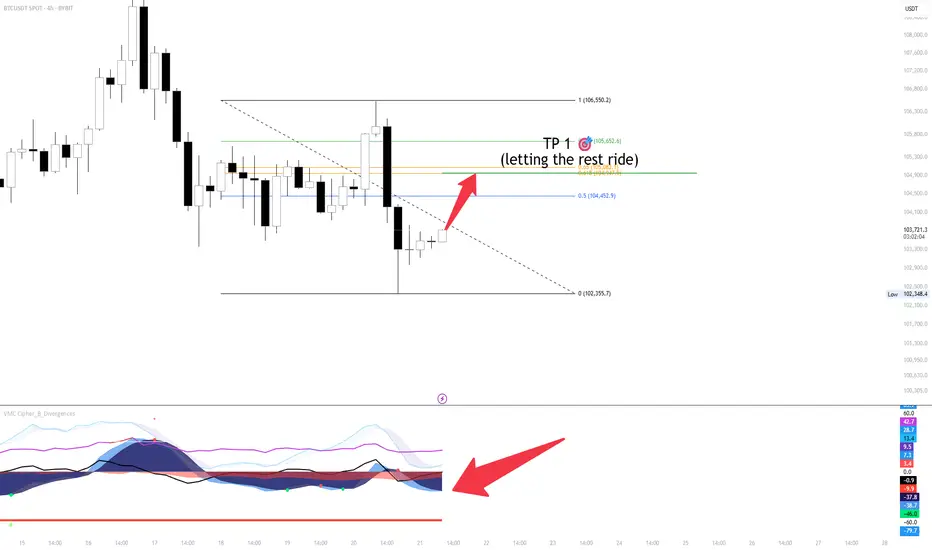
BTC 4H SCALPBTC/USDT Scalp Setup – 4H Chart
Entered a scalp position with TP1 aligned at the Fibonacci extension near 105,652. The first take-profit has been secured, and the remainder of the position is being left to ride — no emotional attachment. If invalidated, the trade will be abandoned without hesitation.
Technical Overview:
Price broke out of the local downtrend channel
Watching for a potential green dot on the volume oscillator to confirm upward continuation
VMC Cipher B shows early signs of a shift; confirmation is still pending
That said, short-term caution is warranted.
Bearish Considerations:
On the higher timeframes, there’s a visible bearish divergence between price and volume — price continues to push higher, while volume fades, indicating a potential trend exhaustion.
Thanks for your support.
If you found this idea helpful or insightful, feel free to leave a like or comment, open to your thoughts and perspectives.
Bitcoin Crash Predicted! Here are the next targets! Bitcoin is crashing as predicted, and here I am showing you the next targets, and the changes in market structure that would make me take profits earlier!
Enjoy and feel free to smash the rocket button if you feel the bearish vibe!

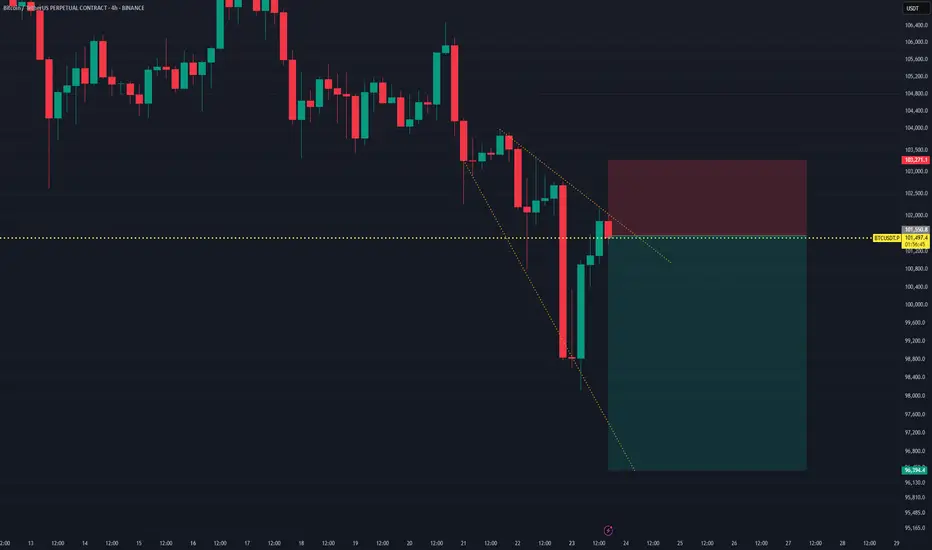
BTCUSDT Short Setup after Weak BreakoutThe BTCUSDT perpetual chart displays a bearish setup following a false breakout or weak retest of a descending wedge structure. After a strong bounce from the recent low, price surged but is now showing rejection at the $101,500 resistance level, marked by a key horizontal zone.
This area coincides with:
- The upper boundary of the falling wedge pattern.
- A former support zone now acting as resistance.
- A red candle signaling exhaustion from buyers.
A short position is initiated with:
- Entry: ~$101,500
- Stop Loss: ~$103,271
- Take Profit: ~$95,400
- Risk:Reward Ratio: ~1:3+
Unless price reclaims and holds above $103,271, this setup suggests a short-term bearish reversal is likely to unfold.
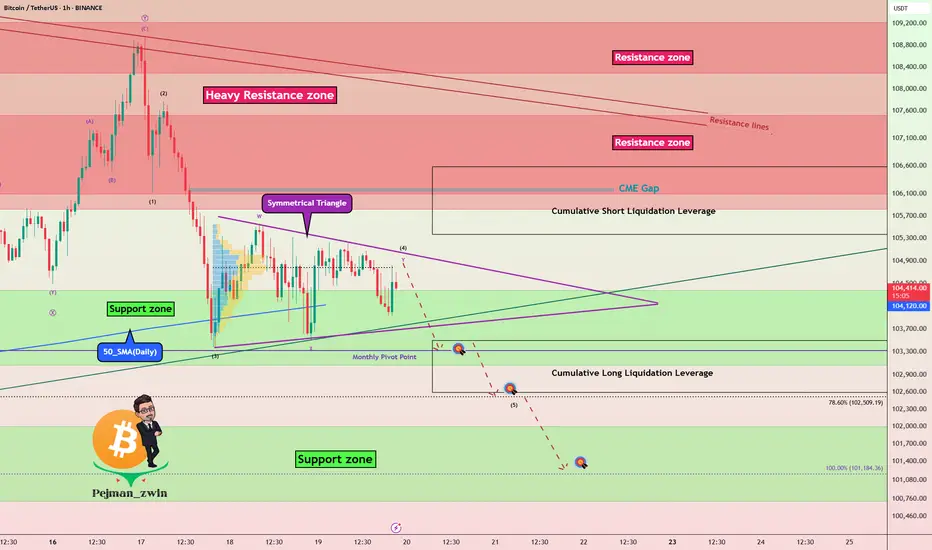
BTC - Key Battle Between Bulls and Bears – Symmetrical TriangleBitcoin ( BINANCE:BTCUSDT ) is currently consolidating within a Symmetrical Triangle , showing indecision among Bulls and Bears around the Support zone($104,380-$103,060) and just above the 50_SMA (Daily) .
From an Elliott Wave perspective, the current range may represent a WXY corrective structure . The market seems to be waiting for a breakout direction , potentially aiming to complete wave 5 after this correction.
The Monthly Pivot Point($103,300) and the presence of significant Cumulative Liquidation Leverage Zones (both Long and Short ) are key liquidity magnets to watch in the short term .
I expect Bitcoin to re-attack the Support zone($104,380-$103,060) AFTER breaking the lower line of the Symmetrical Triangle Pattern and decline to the targets I have outlined on the chart.
Note: Stop Loss: $106,703 = Worst Stop Loss(SL)
Please respect each other's ideas and express them politely if you agree or disagree.
Bitcoin Analyze (BTCUSDT), 1-hour time frame.
Be sure to follow the updated ideas.
Do not forget to put a Stop loss for your positions (For every position you want to open).
Please follow your strategy and updates; this is just my Idea, and I will gladly see your ideas in this post.
Please do not forget the ✅' like '✅ button 🙏😊 & Share it with your friends; thanks, and Trade safe.
BITCOINBINANCE:BTCUSDT.P Team bearish are not showing any signs of slowing down breaking every barriers. on these post i shared analysis on what i think that BTC is going to do next. All the best.

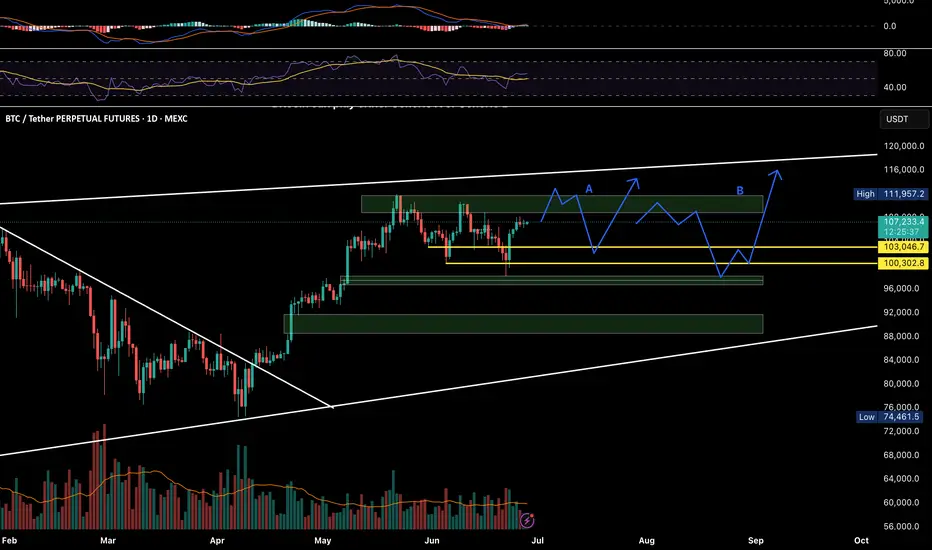
Bitcoin Poised to Reach 111500Bitcoin Poised to Reach 111500
Bitcoin faced a strong support zone for the second time during this month near 104K.
The pattern is taking a complex shape but overall remains supported by the Geopolitical situation as well.
During the last 5 hours BTC bounced from that zone showing a strong momentum and is poised to test the old structure zones again 107855 ; 108710 ;
The other important zones that may have more value are 110230 and 111500
You may find more details in the chart!
Thank you and Good Luck!
❤️PS: Please support with a like or comment if you find this analysis useful for your trading day❤️

Good moment for try to Buy BTCGood moment for try to Buy BTC. A good triangle has formed. There are prerequisites for its upward breakout. Very good risk/reward ratio. Stop below the triangle. Let's see...

BTC ITS A TRAP Bitcoin is currently facing significant resistance at key technical levels and may be positioning for a potential sharp decline heading into Thursday, particularly as markets close and geopolitical tensions in the Middle East threaten to escalate.
Two key technical confluences support this thesis:
1. Bullish Gartley Harmonic Pattern: This setup is developing with highly precise ratio alignments, targeting a convergence at the Point of Control (POC) alongside multiple anchored VWAP levels. While the pattern typically involves a sharp decline, it often precedes a powerful reversal once liquidity is swept from the lows, making this a potentially attractive risk-reward inflection zone.
2. Failed Auction Structure: Price action has demonstrated an inability to sustain a breakout above the established fair value range, instead reverting back within the bounds of a parallel channel. This failed breakout—confirmed by a rejection at the upper end of the volume profile—suggests heightened probability of a move back toward fair value, marked in blue, which coincides with the POC and represents the market's most accepted / traded price.
We’ll observe how the setup develops from here.

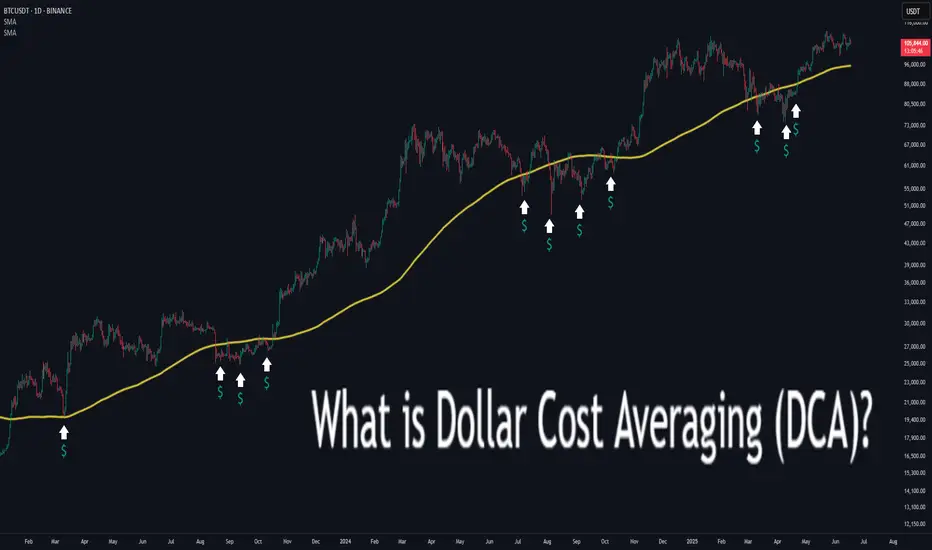
What is Dollar Cost Averaging (DCA)?🔵 What is Dollar Cost Averaging (DCA)?
Dollar Cost Averaging (DCA) is a timeless investment strategy that involves investing a fixed amount of money at regular intervals, regardless of the asset's price. It’s one of the most effective ways to build a position over time while minimizing the impact of market volatility.
The term "Dollar Cost Averaging" was popularized in the early 20th century by Benjamin Graham — the father of value investing and mentor to Warren Buffett. Graham advocated DCA as a way to remove emotions and guesswork from investing. By spreading out purchases, investors could avoid mistiming the market and reduce risk exposure.
Today, DCA remains a core strategy for retail investors, especially in volatile markets like cryptocurrencies and growth stocks.
🔵 How Does DCA Work?
The concept is simple: instead of investing a lump sum all at once, you break your total investment into smaller, equal parts and invest them over time — for example, weekly or monthly.
Invest $100 every week into Bitcoin.
Keep buying consistently — regardless of whether price goes up or down.
Over time, this smooths out your average entry price.
You buy more when price is low, and less when price is high.
Example:
If BTC is at $30,000 one month, you buy a small amount.
If BTC drops to $25,000 the next month, you buy more units with the same $100.
Over time, your entry price averages out — reducing the risk of buying at a peak.
🔵 Why Use DCA?
DCA offers both psychological and mathematical advantages:
Reduces timing risk: You don’t need to predict market tops or bottoms.
Builds discipline: Encourages consistent investing habits.
Prevents emotional mistakes: Avoids FOMO buying and panic selling.
Smooths volatility: Especially useful in crypto or fast-moving assets.
🔵 Smart DCA: Buying Into Market Bottoms
While classic DCA is powerful on its own, it becomes even more effective when combined with market structure. A popular approach is to only DCA when the asset is trading below its long-term average — such as the 200-day Simple Moving Average (SMA) or using RSI (Relative Strength Index).
What is the 200-day SMA?
It’s the average closing price over the last 200 days — a key indicator of long-term trend direction.
Why DCA Below the 200 SMA?
Historically, many market bottoms occur below the 200 SMA. Using this as a filter helps you avoid accumulating during overvalued or overheated conditions.
SDCA with RSI
The Relative Strength Index (RSI) helps identify momentum exhaustion. When RSI drops below 30, it often marks deeply oversold conditions — especially on the daily chart for BTC.
How to use it:
Only DCA when price is below the 200-day SMA.
You accumulate during crashes, fear, and corrections.
Avoid buying when price is extended far above long-term value.
🔵 Scaling DCA Based on Undervaluation
To further optimize the strategy, you can scale your DCA amounts depending on how far below the 200 SMA the price is.
Example:
Price is 5% below 200 SMA → invest normal amount.
Price is 15% below → double your investment.
Price is 25% below → triple your investment.
This creates a dynamic DCA system that responds to market conditions — helping you build larger positions when prices are truly discounted.
🔵 When DCA Doesn’t Work
Like any strategy, DCA has limitations. It’s not magic — just a system to reduce timing errors.
In strong uptrends, a lump sum investment can outperform DCA.
In declining assets with no recovery (bad fundamentals), DCA becomes risky.
DCA works best on quality assets with long-term growth potential.
Always combine DCA with research and risk management — don’t blindly accumulate assets just because they’re down.
🔵 Final Thoughts
Dollar Cost Averaging isn’t about buying the exact bottom — it’s about consistency , discipline , and risk control . Whether you’re investing in Bitcoin, stocks, or ETFs, DCA offers a stress-free approach to enter the market and smooth out volatility over time.
Smart traders take it one step further: using moving averages and structure to focus their DCA efforts where value is highest.
DCA won’t make you rich overnight — but it will help you sleep at night.
This article is for educational purposes only and is not financial advice. Always do your own research and invest responsibly.
Bitcoin Next Move These are the two levels I am currently looking at to trade.
If we sweep the local high at 109k then we will be trading into a zone of supply as well which is good confluence in terms of a setup, most important is going to be the reaction of price off of that level.
My higher probability setup will be around the 111k level as that is where we have multiple sets of Poor highs and it is closer to the range high. I always prefer trading near the extremities of the ranges for higher probability setups.
I would also consider a long from 103k if we get a fast flush into that level but I prefer 101-102s to long as that is at the range low.
Note:
1. Always observe reaction at key levels before entry to avoid forced trades.
2. Maintain disciplined stop loss placement especially near supply sweeps and flush longs.
3. Prioritize setups at range extremes (102k or 111k) for optimal entries aligned with your edge.
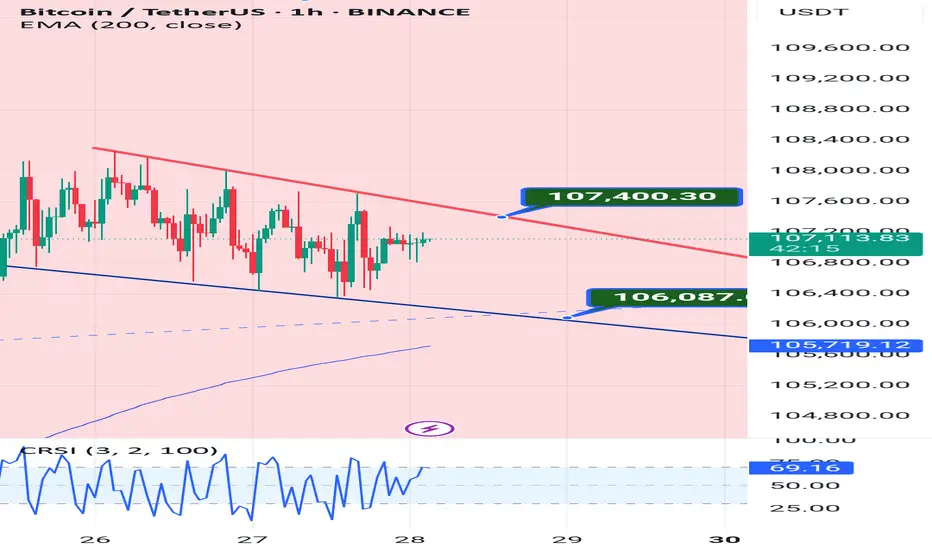
BitSupport and resistance levels are identified on the one-hour timeframe, and the momentum increases in either direction when broken.
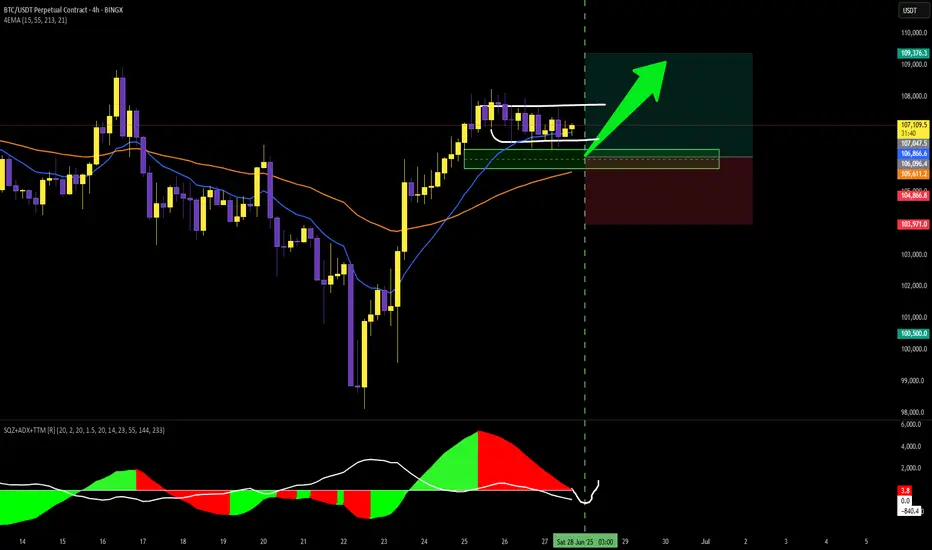
BTC/USDT, 4H chart, Futures - Bullish projection.The price is expected to consume time in its SQZ and take liquidity at the bottom of the range to make decisions... to UP
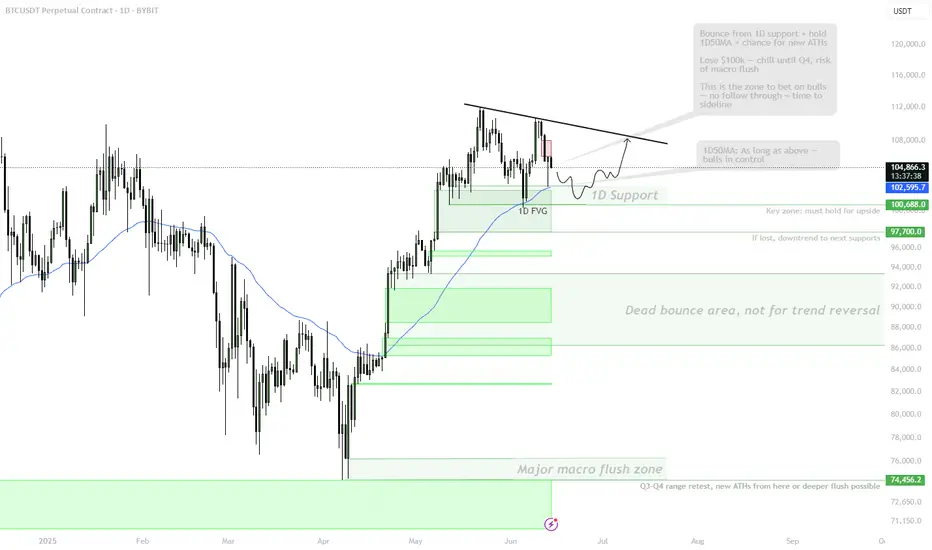
BTC | At the Line Between ATH Expansion or Macro FlushBINANCE:BTCUSDT Bulls need to hold the $102k–$100.8k support and 1D 50MA for a shot at new highs.
– Wick into 1D FVG ($98k) is fine, but no daily close below 50MA allowed.
– Lose $100k? Then it’s sideline season — next real support only at $93k/$87k, macro flush risk toward $75k–$58k if momentum fails.
– As long as above 1D support/MA, there’s a chance for a clean ATH breakout from the OB under the highs.
This is the zone to bet on continuation. If not, don’t fight the trend lower.
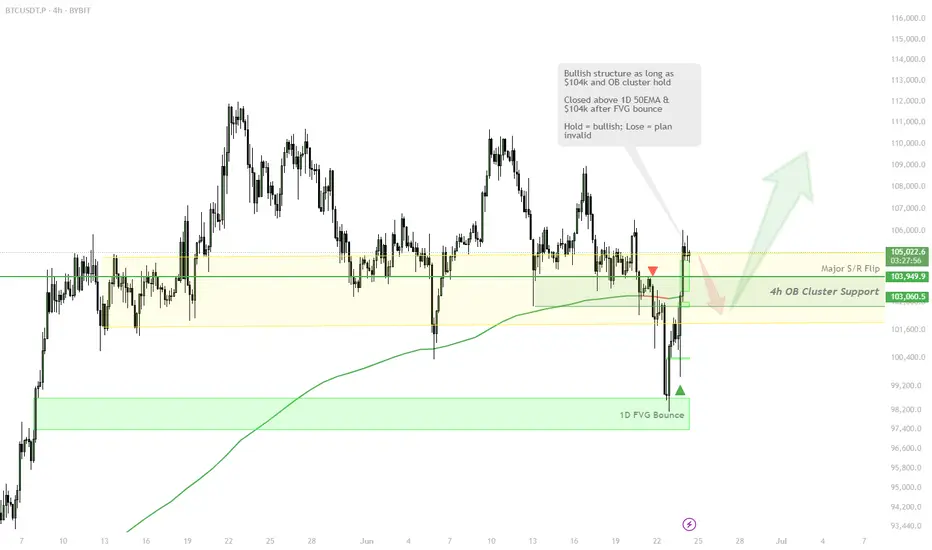
BTC Flips Bullish Above $104k — 1D 50EMA & OB Cluster HoldCRYPTOCAP:BTC | #4h
Price reclaimed 1D 50EMA & $104k after a clean bounce from 1D FVG ($98k).
As long as $104k and the 4h OB cluster hold, lower targets are off the table.
Maintaining bullish bias toward $106k+.
Lose $104k? Bull plan is invalid, reassess for lower.
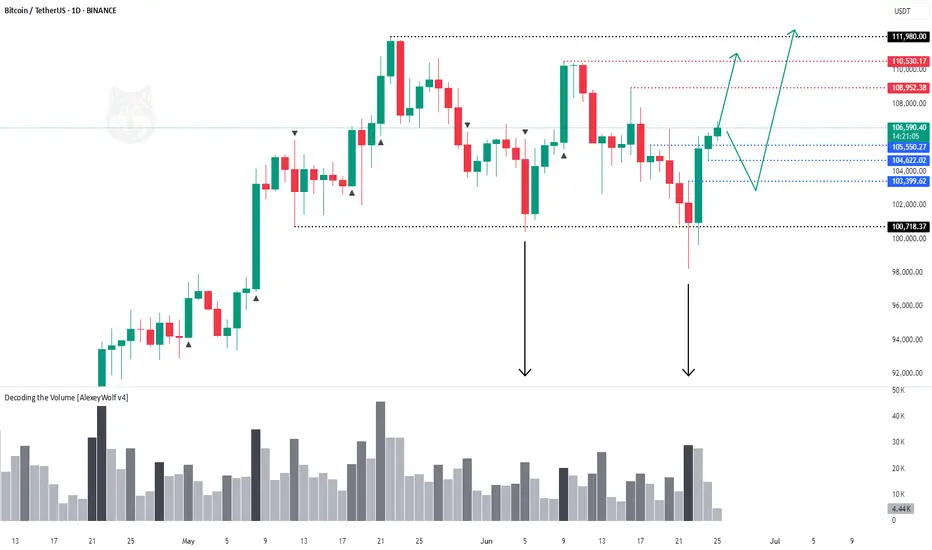
Bitcoin - overview with Initiative AnalysisHey traders and investors!
📍 Context
On the daily timeframe, the market is in a sideways range.
The boundaries are marked with black lines.
Buyer initiative is currently active.
Targets: 108,952; 110,530; 111,980.
📊 Key Actions
The seller attempted twice, on increased volume, to break down below the range, but both times the buyer brought the price back inside. Only seller wicks remained below the lower boundary.
🎯 Trade Idea
🔹 Look for long setups from 105 500 -104,622 or the 103,400–100,718 zone.
There is no context for short trades at the moment.
This analysis is based on the Initiative Analysis concept (IA).
Wishing you profitable trades!
BTC - Getting 2021 Double Top/Bearish VibesLooking at the weekly chart for BTC, I'm seeing similar price action from when we double topped in 2021. We hit the top of the channel, corrected, and then had a slightly higher high before going down hard. Again we hit the top of the channel, had a strong correction, only to hit it again for a slightly higher high. But the signs of market weakness are showing in the indicators and price action. Not to mention war is looming between Israel and Iran. I'm taking a defensive posture here. I think if the bears take control, we could hit the $60k liquidity area that we missed on the last correction. We can reassess the market better at the time based on the price action and current events.

Bitcoin | Long | 3hrsThis technical analysis is for informational and educational purposes only. It does not constitute financial advice. Remember to always research and consult with a professional before making investment decisions. Good luck! 📈💼🚀
