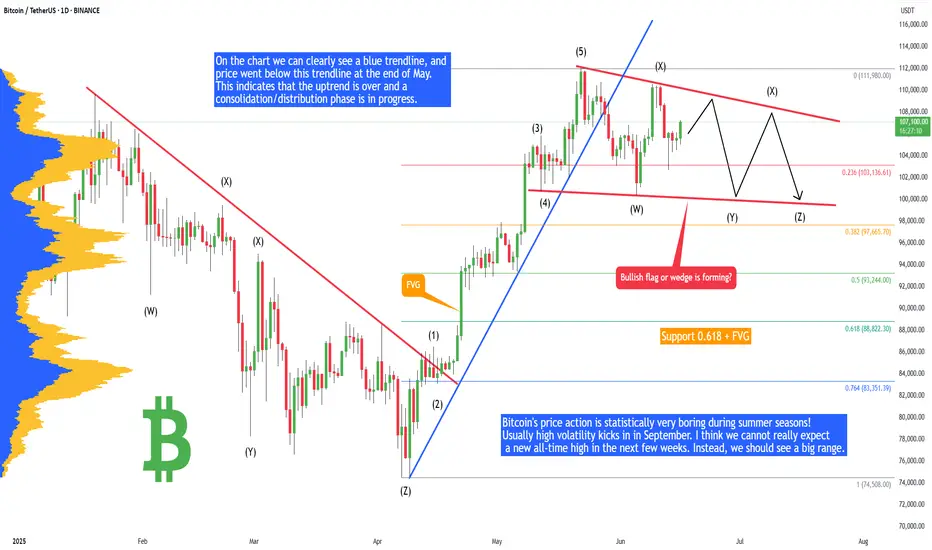
Bitcoin - Plan for summer 2025 (no new ATH, big range!)Bitcoin's price action is statistically very boring during summer seasons! Usually high volatility kicks in in September. I think we cannot really expect a new all-time high in the next few weeks. Instead, we should see a big range. Why? Let's take a look at technical analysis.
On the chart we can clearly see a blue trendline, and price went below this trendline at the end of May. This indicates that the uptrend is over and a consolidation/distribution phase is in progress. This phase is usually represented as a bull flag, triangle, rectangle, or wedge. When we look at the current price action, it looks like a bullish flag consolidation pattern. In this case we will probably see multiple liquidity sweeps below the previous swing lows to kick out early longs.
There are 2 types of traders. The first one they love to trade ranges, and the second they love to trade breakouts and higher volatility environments. Currently I think Bitcoin is creating a range, so do not expect any crazy movements until this range is valid.
Bullish flags are usually bullish patterns, but often they break down and act like bearish patterns. So what would happen if this bullish flag breaks down? That would send the price of Bitcoin to the 0.618 FIB, which is at 88,882 USDT. What is this bullish flag breaks out? That would send the price of Bitcoin to 116,000 to 125,000, but to establish this price we first need to see low of the bull flag, which is not confirmed yet. I will definitely inform you in one of my next analyses, so write a comment with your altcoin + hit the like button, and I will make an analysis for you in response.
At the end of each post, I share my professional trading tips: "If you realize you’ve made a poor trading decision, exit before the stop loss forces you out." Trading is not hard if you have a good coach! This is not a trade setup, as there is no stop-loss or profit target. I share my trades privately. Thank you, and I wish you successful trades!
BTCUSDT.3S trade ideas
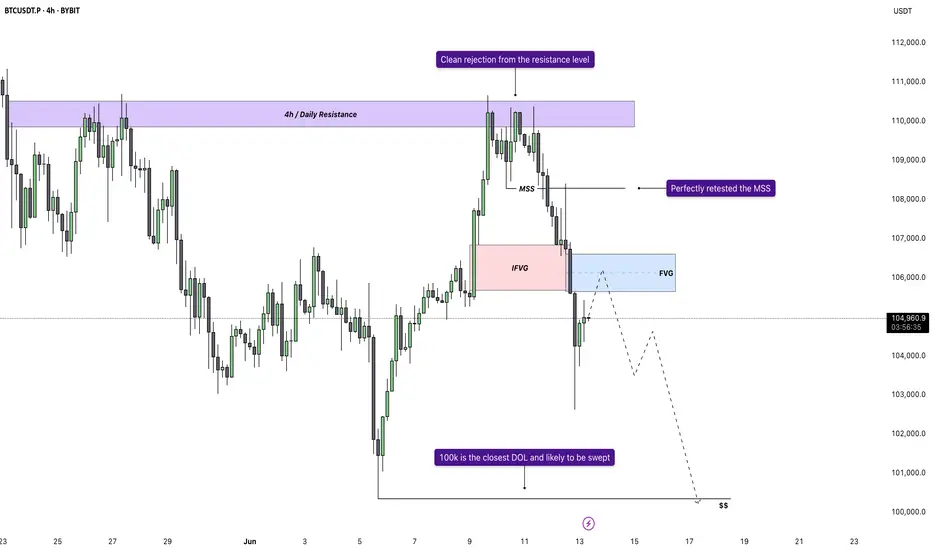
Bitcoin - Bears vs Bulls: $100k next?Price recently tapped into a well-defined 4H and daily resistance zone and was met with an immediate rejection. That rejection wasn’t just a reaction, it led to a confirmed market structure shift as price broke the previous low. This transition from higher highs to a lower low signals the first sign of bearish control, flipping the short-term bias and setting the tone for a move lower.
Retest of MSS and Inversion Fair Value Gap
After the break in structure, price retraced directly into the origin of the move, retesting the same zone where the shift occurred. A previously bullish 4H gap has now flipped into resistance, rejecting price perfectly. This inversion, where a bullish imbalance turns into a bearish reaction zone, confirms the change in direction and strengthens the downside narrative.
New FVG as Entry Opportunity
The latest bearish impulse created a clean new fair value gap just above current price. A retest of this gap would offer a high-probability continuation setup, as it aligns with both recent structure and order flow. This zone becomes the critical level for bears to defend, and unless price reclaims it, the expectation remains for continuation toward lower liquidity.
Liquidity Outlook and Bearish Target
Below current price, a large pool of liquidity is sitting just above a major psychological round number. That level hasn’t been swept yet and is a likely downside magnet. With no meaningful support between the current FVG and that draw on liquidity, price is likely to reach for it next. This fits the typical sequence following a market structure shift: rejection, shift, retest, continuation, and liquidity sweep.
Momentum and Contextual Confluence
Zooming out slightly, the current move fits within broader bearish momentum that has been developing across timeframes. There’s no sign of strong bullish absorption, and each push higher has been met with efficient selling. This isn’t a chaotic breakdown, but a controlled sequence of lower highs and lower lows, supported by clean structural shifts and consistent rejection zones.
Conclusion
The chart tells a clear story. A clean rejection from a key resistance zone led to a confirmed bearish structure shift, followed by a textbook retest and fresh fair value gap. As long as price remains below that gap, the setup favors continuation lower, with the nearest liquidity pool being the most likely draw. This remains a high-probability bearish scenario until proven otherwise by a shift back above invalidation levels.
___________________________________
Thanks for your support!
If you found this idea helpful or learned something new, drop a like 👍 and leave a comment, I’d love to hear your thoughts! 🚀
Bitcoin, Good News & Good News —Bullish Confirmed (Retrace Over)First, the good news is that we have a higher low and a strong recovery in place. The current candle has a long lower wick and is already trading green, at the top of the session.
The second good news is how far down the retrace went. Last time Bitcoin bottomed around $100,300, this time the bottom happened at $102,660. This is an early signal of course because the week is not yet over. It can happen that prices move higher today and tomorrow they move back down, crash on Sunday and we get a bearish close. But, looking at short-term price action and other altcoins, also the volume—notice the volume—we can say that the retrace is over and we are set to experience immediately additional growth.
The volume is the most revealing signal right now.
The drop had no volume compared to today. Today's session has more volume than the last three red-days combined.
Another signal to consider is the amount of over-leveraged gamblers that were liquidated, a total of 1 billion dollars. When this much greed is removed from the market, there is no need for lower prices.
I will call it early, the retrace is over. Time to go bullish again.
Thanks a lot for your continued support.
I will show you several more altcoins that are also looking ready to grow.
Namaste.
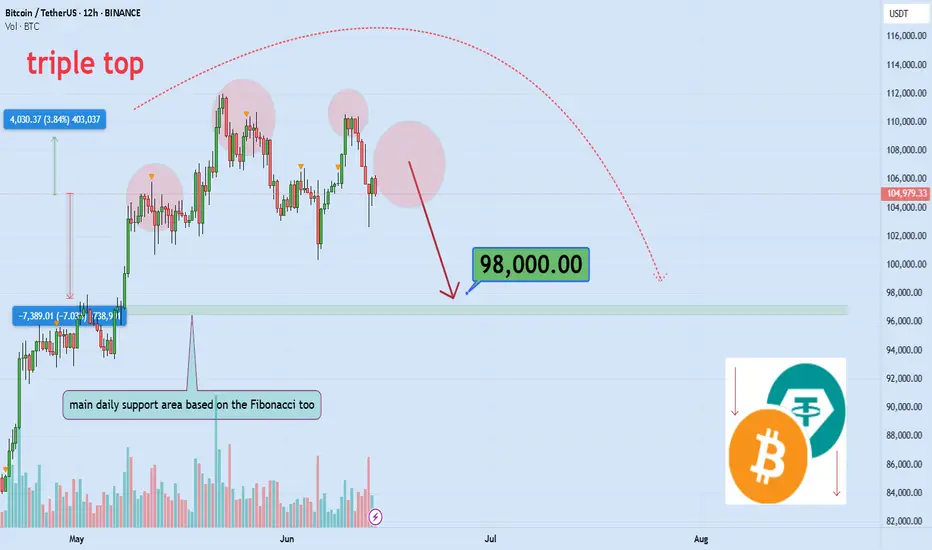
Iran-Israel Political Tension & End of Crypto marketDo geopolitical tensions truly cause markets to crash or pump?
In a world where financial safety is more fragile than ever, how do traders react?
This analysis dives deep into how pro traders think and act during critical moments.
Hello✌
Spend 3 minutes ⏰ reading this educational material.
🎯 Analytical Insight on Bitcoin:
Bitcoin is experiencing a fear-driven shock amid escalating geopolitical tensions, triggering potential downside volatility toward the $98K level 📉. Despite this risk-off sentiment, the broader market structure remains intact, and I maintain a bullish bias. A recovery from key support zones could pave the way for a renewed breakout above $100K in the mid-term .
Now , let's dive into the educational section,
🧠 Fear, Safety or Opportunity? Trading Psychology in Crisis 🧨
Markets don’t move based on headlines—they move based on how the crowd feels about those headlines. Political tension triggers emotional responses, especially panic selling.
However, experienced traders spot opportunities while others flee.
In such moments, two emotional extremes dominate:
🔸 Fear of losing capital (FUD)
🔸 Greed to seize a rare opportunity (FOMO)
Both are dangerous if uncontrolled. Tools like RSI and Fear & Greed Index (via external APIs) can provide rough estimates of market sentiment and potential turning points.
📊 Practical TradingView Tools for Analyzing Crisis-Driven Markets 🔍
When global tension spikes, the markets reflect collective emotion like a mirror. During uncertain times, smart traders rely on tools that turn raw data into sharp insights. TradingView provides several features that become extremely useful in times of high uncertainty:
1. Crypto Volatility Index Proxy (using ATR + Bollinger Bands)
These indicators help detect when the market is driven more by fear than logic. They show increasing volatility levels as tensions rise.
2. Sentiment Indicators – Funding Rate & Long/Short Ratios
These metrics, pulled from major exchanges, show whether traders are overly bullish or bearish. A sudden imbalance usually hints at insider expectations or fast-breaking news.
3. DXY and Gold (XAUUSD) Side-by-Side with BTC
Analyzing Bitcoin’s performance alongside USD and gold gives insight into whether investors are going risk-off or seeking crypto as a hedge.
4. Volume-Based Indicators – OBV & Volume Profile
While headlines can lie, volume doesn’t. These tools highlight areas of serious buying/selling interest and help identify where smart money enters or exits.
5. Multi-Chart Layout Feature
TradingView allows you to analyze multiple assets together—BTC, gold, oil, and stock indices like S&P 500—on one screen. Perfect for understanding macro capital flow during geopolitical events.
💣 Interconnected Markets During Regional Conflict 🌍
Crypto often acts like a risk-on asset during global crises. If traditional markets fall, Bitcoin may follow—unless it’s being viewed as a safe haven.
That’s why watching DXY, gold, and oil charts alongside BTC is crucial.
Understanding these correlations using TradingView’s comparison features gives you a better sense of where capital is flowing during uncertain times.
⏳ What Traders Should Focus on in Crisis Mode 💼
1. Focus on chart confirmations, not news hype.
2. Use multi-dimensional analysis with TradingView.
3. Prioritize risk management more than ever.
4. Cash is a position. Sometimes the best move is no move.
5. Always have a backup scenario—no analysis is guaranteed.
📌 Final advice:
When headlines play with your nerves, data becomes your best ally.
With the right tools and a disciplined mindset, traders can navigate even the stormiest markets with confidence.
The market rewards the calm, not the reckless.
✨ Need a little love!
We put so much love and time into bringing you useful content & your support truly keeps us going. don’t be shy—drop a comment below. We’d love to hear from you! 💛
Big thanks,
Mad Whale 🐋
📜Please remember to do your own research before making any investment decisions. Also, don’t forget to check the disclaimer at the bottom of each post for more details.
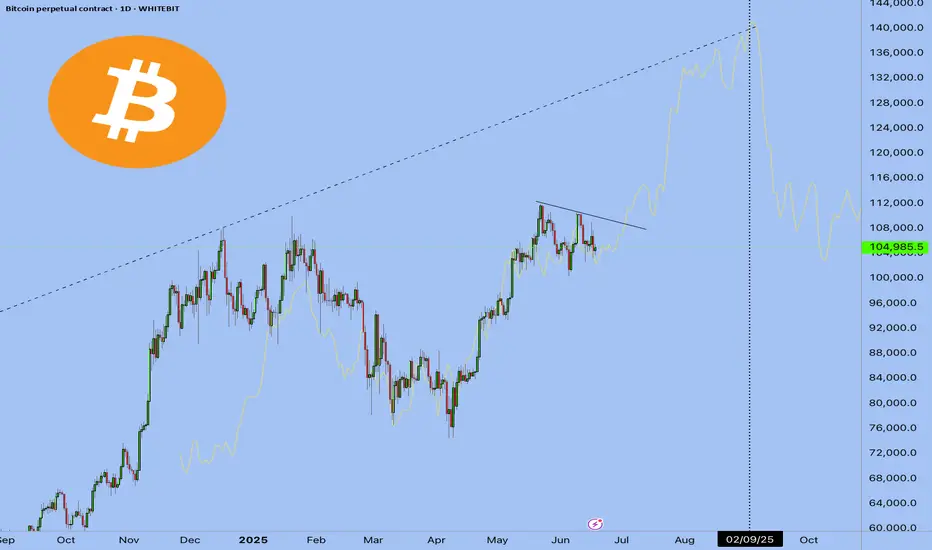
It's an Evacuation Through Green Candles💥 "One Last Leap of Faith?" - What Bitcoin Might Be Hiding Before September
The world’s on fire: Israel, Iran, Strait of Hormuz, oil, elections, the dollar, rates, black swan whispers.
And someone’s out here saying Bitcoin might still go up?
Yes. We are. Not because we believe - but because we see.
📉 Everyone’s afraid. The whales aren’t.
When the crowd goes into survival mode, the real game begins.
Whales aren’t exiting - they’re accumulating.
ETFs aren’t pausing - they’re inflowing.
The technical setup isn’t breaking - it’s compressing like a spring.
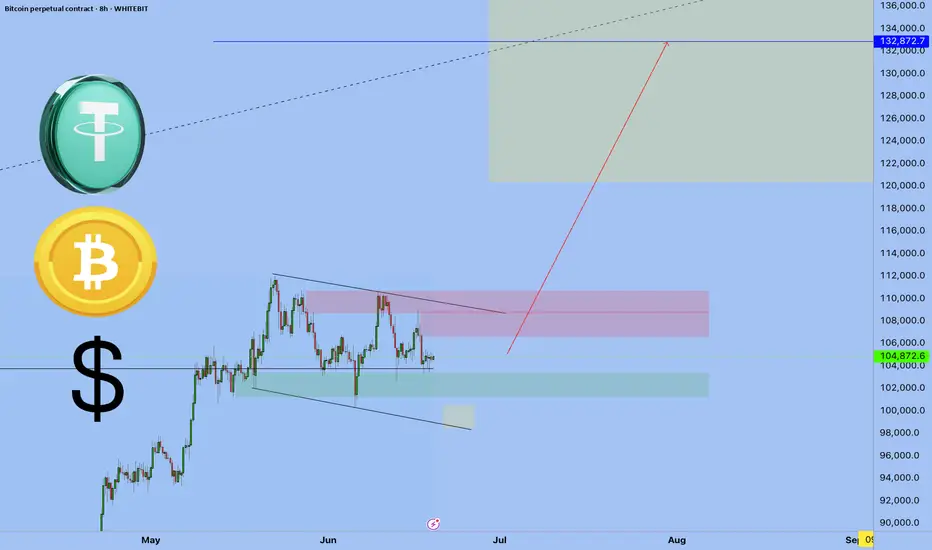
$104,000. Coil building.
If we break out - targets at $132K–$140K are absolutely in play.
👉 But that’s not the point.
The point is why this is happening while the world is burning.
🧠 The idea: Bitcoin isn’t a safe haven. It’s a distribution machine.
Gold is for panic.
Bitcoin is for structure.
Institutions don’t ask “is it scary?” - they ask “where’s liquidity?”
Everything is aligning for one last upside move.
Until September. After that - chaos is back on the table.
💣 The Global Playbook:
Now (Summer) - Consolidation, ETF flows, geopolitical fear - Strategic entries, low exposure
Breakout - FOMO panic, retail rushes in - Profit-taking via options
September–Fall - Macro/geopolitical shock - Already in cash or hedged
📌 Bottom Line
Yes, Bitcoin might pump. Not because the world is fine - but because someone needs to exit beautifully.
If you're reading this - you're early enough to think.
Markets don’t reward justice. They reward positioning.
🛠 What to do right now:
Watch the $104,000 level - it's the pivot
Breakout = final upside push to $132K–140K
Keep your eyes on September - reversal zone
Think in scenarios: entry, exit, protection
Follow EXCAVO - we don’t guess, we read the game
I've been talking about this scenario for a long time
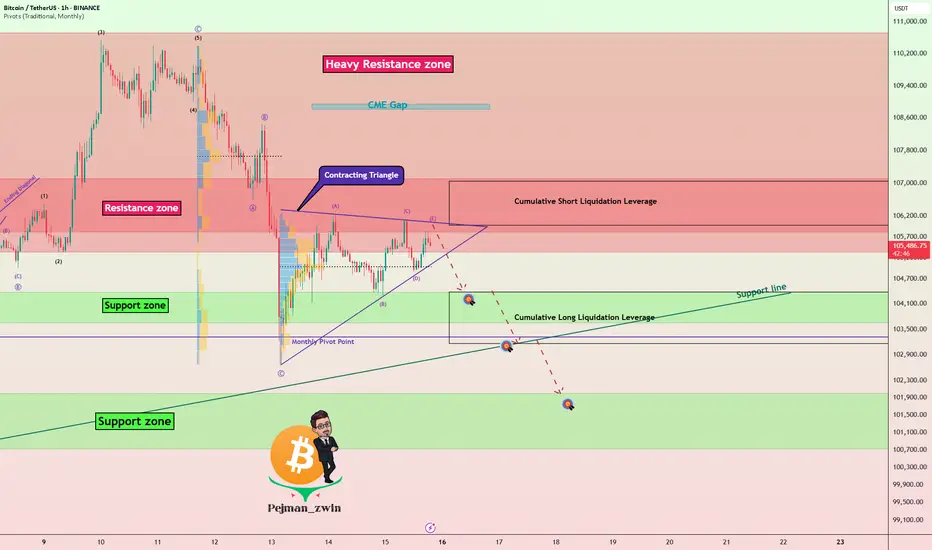
Geopolitical Tensions & Technical Pattern Point to BTC Decline!Bitcoin ( BINANCE:BTCUSDT ) fell about -5% after tensions between Israel and Iran escalated. Unfortunately , these tensions are still escalating, but Bitcoin has managed to recover about +3% so far.
Bitcoin is moving near the Resistance zone($107,120-$105,330) and Cumulative Short Liquidation Leverage .
In terms of Elliott Wave theory , it seems that Bitcoin is completing a corrective wave . The corrective wave structure could be Contracting Triangle . In case of a sharp decline in Bitcoin again, we can consider these waves as five descending waves (if Bitcoin does NOT touch $106,600 ).
I expect Bitcoin to start declining again and at least drop to the Support zone($107,120-$105,330 ). The second Target could be the Support line and Cumulative Long Liquidation Leverage .
Note: If Bitcoin can break the Resistance zone($107,120-$105,330), we can expect further increases in Bitcoin.
Please respect each other's ideas and express them politely if you agree or disagree.
Bitcoin Analyze (BTCUSDT), 1-hour time frame.
Be sure to follow the updated ideas.
Do not forget to put a Stop loss for your positions (For every position you want to open).
Please follow your strategy and updates; this is just my Idea, and I will gladly see your ideas in this post.
Please do not forget the ✅' like '✅ button 🙏😊 & Share it with your friends; thanks, and Trade safe.
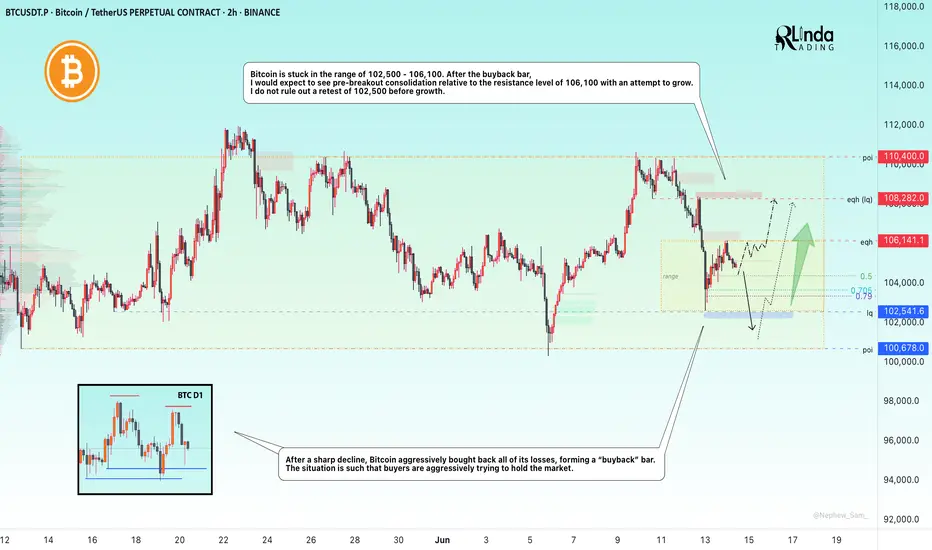
BITCOIN → Buyback bar. Chance of growth to 108,000BINANCE:BTCUSDT is trading in a fairly wide range of 100,600 - 110,400. The market is stagnating due to fundamental uncertainty, but the risks of a decline are quite high...
After the escalation of the conflict in the Middle East, Bitcoin broke the bullish structure on the market and managed to test the local level of 102500, from where a fairly aggressive phase of buying out the fall began within one trading session. The market is defending the structure quite aggressively. The chart shows a local range forming with strong levels at 102500 and 106200. Accordingly, the price may remain in this range for a long time (in which case an intraday trading strategy can be considered). However, if Bitcoin starts to stick to one of the boundaries, then we can consider the price leaving the range, but based on the structure of the uptrend, correction, and the formation of a buyback bar, it would be logical to see an attempt to break through resistance with the aim of continuing growth.
Resistance levels: 106200, 108200, 110400
Support levels: 102500, 100600
On D1, there are no prerequisites for a strong decline. The market is buying up knives and trying to stay afloat (in consolidation). In the medium term, there may be an attempt to retest 102500 - 100600 due to the liquidity pool. But locally, the market may form an attempt to grow to 108200
Best regards, R. Linda!
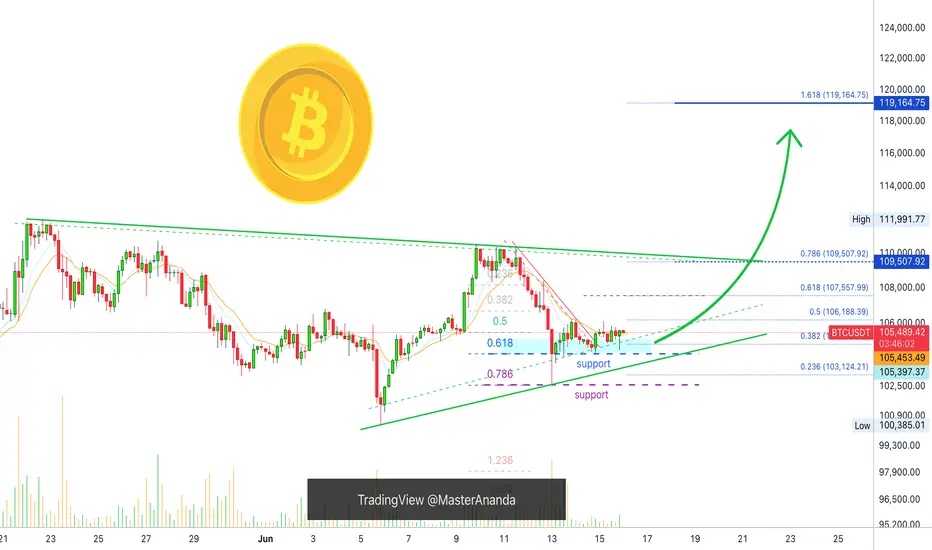
Bitcoin Mid-Term, 4H Timeframe, Bullish ($119,165 Next Target)On the 4H timeframe we have a consolidation pattern with a bullish bias. Bitcoin is aiming higher after a close above EMA8 & 13 with higher lows.
The drop 13-June found support perfectly at 0.786 Fib. retracement on a wick. The session closed above 0.618. The action turned bullish immediately and we are seeing slow but steady growth.
The recent drop was a market reaction due to a geopolitical situation. As soon as the event is priced in, the market seeks balance and goes back to its previous trend.
Bitcoin's bullish bias is not only supported by strong prices, $105,600 is very strong, but also by the altcoins and the cyclical nature of the market.
While Bitcoin already produced several new all-time highs this year the altcoins are yet to do the same. A bull market happens every four years or the year after the halving. For Bitcoin this is already true but this is a marketwide event and the altcoins are yet to go there and this is a bullish factor and soon this will be obvious on the chart.
We are 5-6 days away only from very strong bullish action. Notice that this isn't a long time, it is less than a week. The altcoins will reveal this bullish bias much sooner than Bitcoin but Bitcoin will also grow and hit a new all-time high soon. This new all-time high will be the catalyst for everything to boom.
» Ignore the short-term it is all noise—crypto is going up.
The next target is $107,558, followed by $109,508 on this timeframe. The latter being a mild resistance.
The main target here is $119,165 and this is a good resistance zone. It can be rounded up to $120,000. If this level gets hit it will only confirm additional growth. The target that follows is $130,000 and the minimum for this cycle is $160,000 but we are aiming higher.
Feel free to follow for more.
I will continue to detail Bitcoin on all the timeframes as well as many of the top, mid- and small altcoins.
Thank you for your support.
It is appreciated.
Namaste.
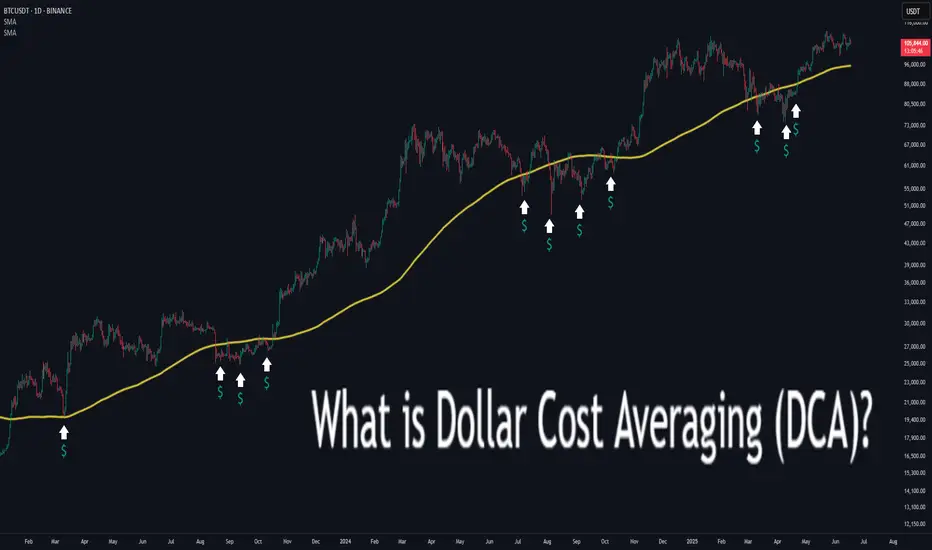
What is Dollar Cost Averaging (DCA)?🔵 What is Dollar Cost Averaging (DCA)?
Dollar Cost Averaging (DCA) is a timeless investment strategy that involves investing a fixed amount of money at regular intervals, regardless of the asset's price. It’s one of the most effective ways to build a position over time while minimizing the impact of market volatility.
The term "Dollar Cost Averaging" was popularized in the early 20th century by Benjamin Graham — the father of value investing and mentor to Warren Buffett. Graham advocated DCA as a way to remove emotions and guesswork from investing. By spreading out purchases, investors could avoid mistiming the market and reduce risk exposure.
Today, DCA remains a core strategy for retail investors, especially in volatile markets like cryptocurrencies and growth stocks.
🔵 How Does DCA Work?
The concept is simple: instead of investing a lump sum all at once, you break your total investment into smaller, equal parts and invest them over time — for example, weekly or monthly.
Invest $100 every week into Bitcoin.
Keep buying consistently — regardless of whether price goes up or down.
Over time, this smooths out your average entry price.
You buy more when price is low, and less when price is high.
Example:
If BTC is at $30,000 one month, you buy a small amount.
If BTC drops to $25,000 the next month, you buy more units with the same $100.
Over time, your entry price averages out — reducing the risk of buying at a peak.
🔵 Why Use DCA?
DCA offers both psychological and mathematical advantages:
Reduces timing risk: You don’t need to predict market tops or bottoms.
Builds discipline: Encourages consistent investing habits.
Prevents emotional mistakes: Avoids FOMO buying and panic selling.
Smooths volatility: Especially useful in crypto or fast-moving assets.
🔵 Smart DCA: Buying Into Market Bottoms
While classic DCA is powerful on its own, it becomes even more effective when combined with market structure. A popular approach is to only DCA when the asset is trading below its long-term average — such as the 200-day Simple Moving Average (SMA) or using RSI (Relative Strength Index).
What is the 200-day SMA?
It’s the average closing price over the last 200 days — a key indicator of long-term trend direction.
Why DCA Below the 200 SMA?
Historically, many market bottoms occur below the 200 SMA. Using this as a filter helps you avoid accumulating during overvalued or overheated conditions.
SDCA with RSI
The Relative Strength Index (RSI) helps identify momentum exhaustion. When RSI drops below 30, it often marks deeply oversold conditions — especially on the daily chart for BTC.
How to use it:
Only DCA when price is below the 200-day SMA.
You accumulate during crashes, fear, and corrections.
Avoid buying when price is extended far above long-term value.
🔵 Scaling DCA Based on Undervaluation
To further optimize the strategy, you can scale your DCA amounts depending on how far below the 200 SMA the price is.
Example:
Price is 5% below 200 SMA → invest normal amount.
Price is 15% below → double your investment.
Price is 25% below → triple your investment.
This creates a dynamic DCA system that responds to market conditions — helping you build larger positions when prices are truly discounted.
🔵 When DCA Doesn’t Work
Like any strategy, DCA has limitations. It’s not magic — just a system to reduce timing errors.
In strong uptrends, a lump sum investment can outperform DCA.
In declining assets with no recovery (bad fundamentals), DCA becomes risky.
DCA works best on quality assets with long-term growth potential.
Always combine DCA with research and risk management — don’t blindly accumulate assets just because they’re down.
🔵 Final Thoughts
Dollar Cost Averaging isn’t about buying the exact bottom — it’s about consistency , discipline , and risk control . Whether you’re investing in Bitcoin, stocks, or ETFs, DCA offers a stress-free approach to enter the market and smooth out volatility over time.
Smart traders take it one step further: using moving averages and structure to focus their DCA efforts where value is highest.
DCA won’t make you rich overnight — but it will help you sleep at night.
This article is for educational purposes only and is not financial advice. Always do your own research and invest responsibly.
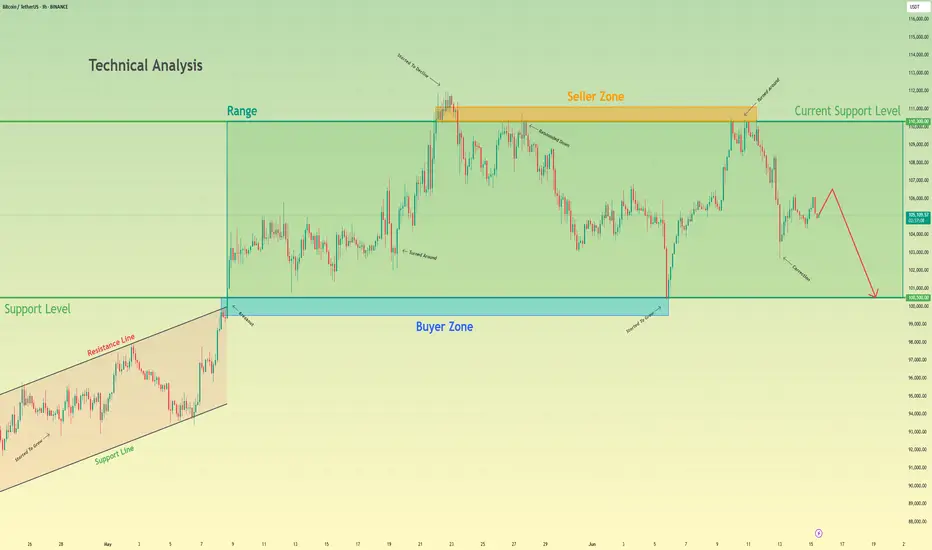
Bitcoin will make a small upward move and then continue to fallHello traders, I want share with you my opinion about Bitcoin. Earlier, the price was confidently growing inside an Upward Wedge, showing a series of higher highs and higher lows. This rising structure was supported by consistent momentum until BTC reached the seller zone between 110300 and 111100, where the growth slowed down and started to fade. From there, the price rejected this resistance and shifted into a Range, bounded by 100500 and 110300. BTC has been fluctuating inside this horizontal structure for some time, unable to break above the seller zone or below the buyer support. Now BTC is showing signs of weakness, forming a minor correction and struggling to reclaim previous highs. Given this structure and rejection from the seller zone, I expect BTC to make a small upward move and then start a decline toward the support level at 100500, which also coincides with the bottom of the range and acts as a strong psychological level. For this reason, I set my TP at 100500 points. Please share this idea with your friends and click Boost 🚀
Bitcoin Short-Term 1H Timeframe, Next Target ConfirmedWe have two drops on this chart. The one of the left is more extended and long lasting compared to the one on the right. When a move is sudden with major force, it tends to end suddenly as well.
The recent drop was very steep and the force needed to keep pushing prices lower cannot be maintained, it requires too much energy; for this reason, a higher low is in place and the bulls win the game.
The action is happening above the blue line and space on the chart, this is the 0.618 Fib. retracement support. This is the most important level and so far it holds. Prices went below just to recover. Can be called a failed signal or a bear-trap, whichever you choose, the action is bullish above this level and bearish below.
Bitcoin's main support stands around $102,663, this level was not challenged. Since bears failed to push prices lower, the next logical move is a challenge of higher resistance. And the same pattern repeats, up and down, up and down... This is the short-term noise. When all is set and done, Bitcoin will resolve going up.
Patience is key.
Thank you for reading.
Thanks a lot for your continued support.
Namaste.
Dollar's Decline: Global Economic ShiftsYou're probably wondering why I'm talking about the dollar on the Bitcoin chart. It's because I want you to look a few steps ahead.
That's why this post is for people like that.
1. Global Economic Transformations: Collapse of the Jamaican Monetary System
Insights and Logic:
We are witnessing the end of the Jamaican monetary system, established in 1976 following the collapse of the Bretton Woods system.
The Jamaican system's key feature is free (yet conditionally market-driven) exchange rates and the global dominance of the U.S. dollar.
For decades, the U.S. utilized the dollar's reserve currency status to finance budget and trade deficits without equivalent value returns—a beneficial "global tax."
Facts:
Currently, over 60% of global reserves are denominated in dollars (IMF data), but diversification is accelerating.
The U.S. is facing a "liquidity trap": to sustain markets, the Fed must print money, exacerbating inflation and weakening the dollar's global effectiveness.
Analogy:
Just as Nixon abolished the gold standard in 1971, we are now witnessing the abolition of the dollar's global standard—not abandoning the dollar as a reserve currency, but its monopoly.
2. Political Environment in the U.S.: Trump, Tariffs, and Managed Uncertainty
Insights:
Court decisions against Trump's tariffs are political tools, especially prior to congressional elections.
Democrats aren't just fighting for power—they systematically undermine Trump's economic policies in voters' eyes.
Systematic Explanation:
Virtually any presidential decree in the U.S. can be challenged legally. Lower-court decisions rarely withstand appeals, yet they create temporary buffers allowing policy adjustments.
This enables Trump to recalibrate his trade model systematically without losing face.
Conclusion:
The U.S. operates under "managed uncertainty," where seemingly chaotic political behaviors are structured adaptation mechanisms to global changes.
3. Mass Market and Sixth Technological Paradigm: NBIC as Foundation for Future Growth
Insights:
The future mass market will be built around NBIC technologies:
* Nano—new materials and sensors;
* Bio—biotech, genetic engineering, life extension;
* Info—digital platforms, neural networks, blockchain;
* Cogno—cognitive interfaces, AI, neural interfaces.
Historical Analogy:
Just as cars and mobile phones defined the mass market of the 20th century, longevity treatments, AI services, and neural devices will define the 21st century.
Facts:
Examples of current "false starts": Nvidia, Palantir, OpenAI—stock price volatility relates not to technology failures but premature valuation.
Forecast:
The next 20 years will see growth in new sectors, dominated by those capturing mass consumers, not just investors.
4. Digitalization and Geo-economics: Telegram, AI, and Control
Facts:
Telegram plans to integrate Grok neural network—a signal of the digital merger of communication, payment platforms, and behavioral analytics.
Insight:
Telegram as a future super-app: messaging, finance, AI assistance—all-in-one.
This is a media reset: traditional platforms like Bloomberg and CNBC lose influence to those controlling data flows directly.
Conclusion:
Information landscapes become automated—algorithms, not journalists, manage narratives.
5. **Europe: From "Progress Locomotive" to Stagnation and Subcontracting**
Facts:
Germany has been in recession for three consecutive years. The average age is 46.
Pension burdens and social standards make the economic model (Rhineland capitalism) unsustainable.
Ideological Crisis:
Europe is split into "transhumanist" (West) and "neoconservative" (East) factions.
The neoconservative revolution is gaining ground in Hungary, Poland, Slovakia, Romania, and even eastern Germany.
Conclusion:
Europe is skipping the sixth technological paradigm, becoming a "comfortable but uncompetitive" zone. Europe's "Japanification"—a path without acute crises but also without growth.
6. Future Growth Centers: Asia and the Global South with Risks
Facts and Locations:
Indonesia, Vietnam, Thailand—dynamic economies with high ROI and moderate political risks.
Philippines, Taiwan—potential proxy-conflict zones between the U.S. and China.
Logic:
Global capital moves towards higher returns rather than better living standards.
Asia becomes a new economic and geopolitical battleground similar to 20th-century Europe.
7. Role of Cryptocurrencies and USDT, USDC: Transition to Digital Dollar
Facts:
U.S. authorities view cryptocurrencies, especially USDT, as tools to reboot the dollar model.
USDT effectively integrates the dollar into the crypto economy, maintaining Treasury demand and allowing dollar exports outside the U.S.
Insights:
Unlike CBDCs, the U.S. digital dollar (via stablecoins) enables global expansion rather than local control.
The U.S. aims to lead the new monetary evolution—digital dominance instead of fiat.
8. Prospects in Latin America: Argentina, Mexico, and Risks
Argentina Analysis:
President Milei implements neoliberal reforms akin to Ukraine's: reduced state role and deregulation.
Possible outcomes: deindustrialization, increased poverty, export dependency.
Positives:
No war risks, resource-rich (oil, wine, food), good medicine and education standards (legacy).
Mexico:
High growth yet severe crime levels—excellent for business, risky for life.
9. Global Hybrid War Instead of a Third World War
Concept:
Not a "world war" but a global hybrid war: multiple power centers, proxy conflicts, shifting alliances.
Theaters of conflict: Asia (especially the South China Sea), potentially the Middle East and Africa.
Strategic Conclusion:
Avoid proxy countries; prefer "neutral dynamic" regions like Indonesia, Vietnam.
About DXY
I have been talking about the fall of the dollar index for a very long time.
September is coming soon
Best regards EXCAVO
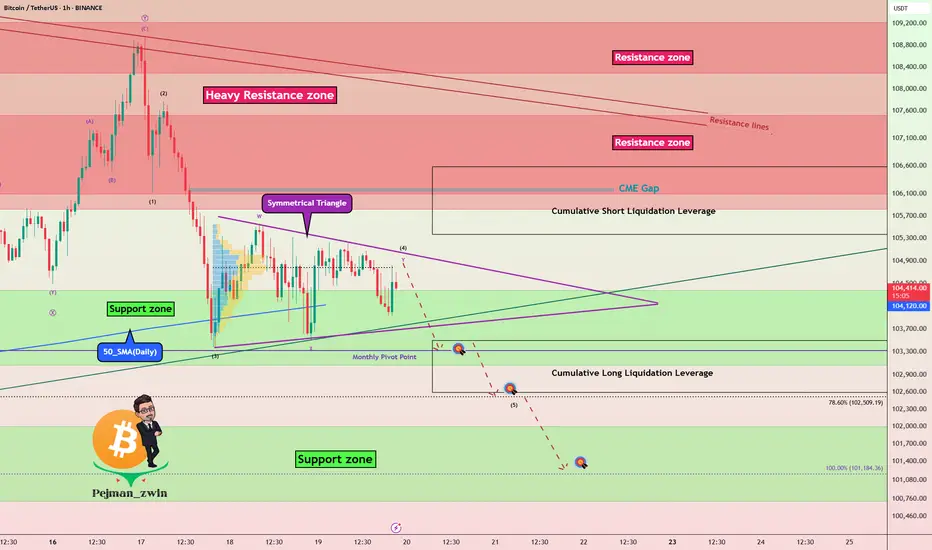
BTC - Key Battle Between Bulls and Bears – Symmetrical TriangleBitcoin ( BINANCE:BTCUSDT ) is currently consolidating within a Symmetrical Triangle , showing indecision among Bulls and Bears around the Support zone($104,380-$103,060) and just above the 50_SMA (Daily) .
From an Elliott Wave perspective, the current range may represent a WXY corrective structure . The market seems to be waiting for a breakout direction , potentially aiming to complete wave 5 after this correction.
The Monthly Pivot Point($103,300) and the presence of significant Cumulative Liquidation Leverage Zones (both Long and Short ) are key liquidity magnets to watch in the short term .
I expect Bitcoin to re-attack the Support zone($104,380-$103,060) AFTER breaking the lower line of the Symmetrical Triangle Pattern and decline to the targets I have outlined on the chart.
Note: Stop Loss: $106,703 = Worst Stop Loss(SL)
Please respect each other's ideas and express them politely if you agree or disagree.
Bitcoin Analyze (BTCUSDT), 1-hour time frame.
Be sure to follow the updated ideas.
Do not forget to put a Stop loss for your positions (For every position you want to open).
Please follow your strategy and updates; this is just my Idea, and I will gladly see your ideas in this post.
Please do not forget the ✅' like '✅ button 🙏😊 & Share it with your friends; thanks, and Trade safe.
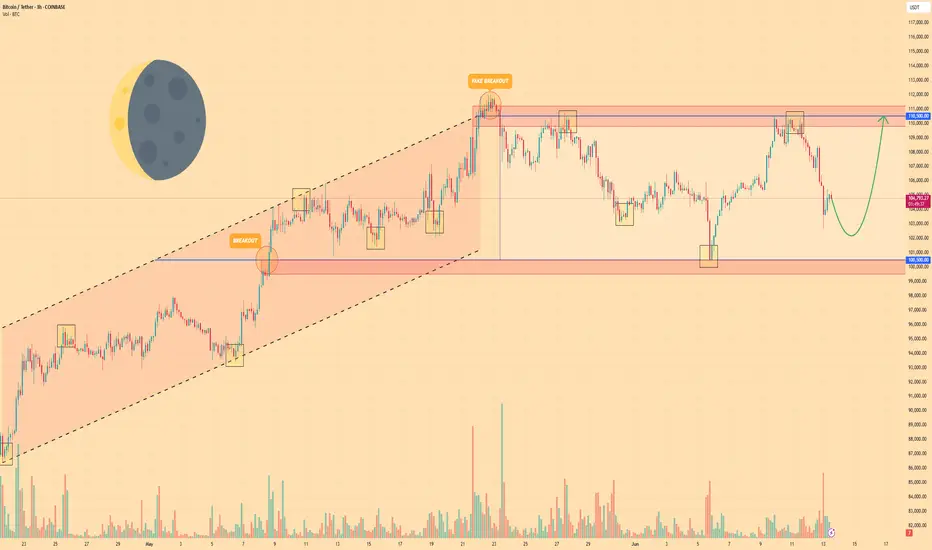
BITCOIN - Price can fall a little and start to move upHi guys, this is my overview for BTCUSDT, feel free to check it and write your feedback in comments👊
Price entered to rising channel, where at once bounced from support line and rose a little, and then corrected.
Next, price continued to move up and soon reached $100500 level, after which broke it and rose to resistance line.
After this movement, BTC corrected and continued to grow in rising channel and later reached $110500 level.
Bitcoin exited from rising channel, made a fake breakout of resistance level, and started to trades inside flat.
In flat, price tried to grow but failed and fell to support level and then grew back again, after which started to decline.
Now, I expect that BTC can repeat as move before, it falls a little and then grows to $110500 resistance level.
If this post is useful to you, you can support me with like/boost and advice in comments❤️
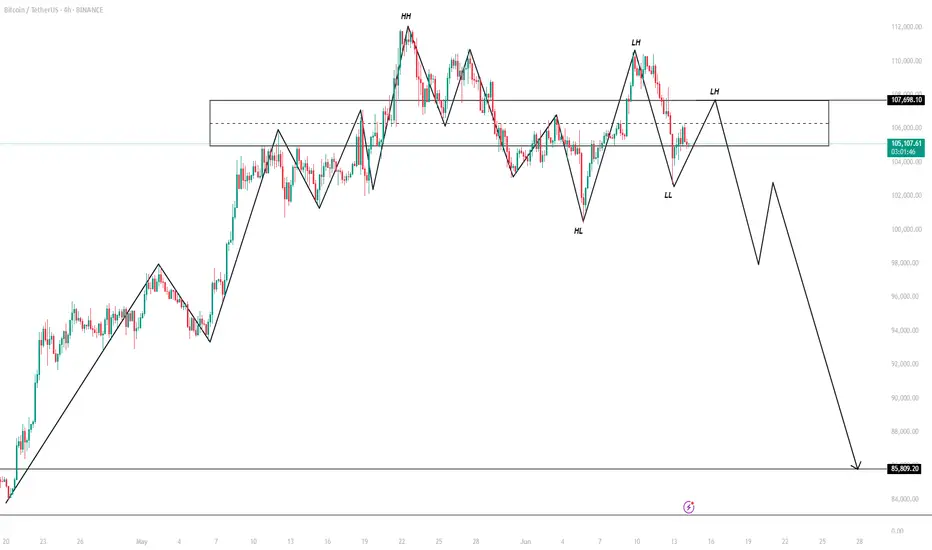
Bitcoin– bearish momentum builds after rejection at $109KIntroduction
Bitcoin (BTC) is currently showing weakness after forming a lower high at $109,000. This level acted as a significant point of rejection, and since then, BTC has been moving lower. The price has broken through key support areas, indicating a possible shift in market structure. In this analysis, we’ll break down the recent price action, explain the technical signals behind the move, and discuss what could be expected in the short term.
Rejection from the 0.786 Fibonacci Level
The rejection at the $109,000 level aligns perfectly with the 0.786 Fibonacci retracement on the 4-hour timeframe. This level is often seen as a strong resistance point during corrective moves, and in this case, it held firmly. The precision of this rejection gives it more weight, and since hitting that point, BTC has been steadily declining. This move down suggests that buyers were unable to push through the resistance, leading to increased selling pressure.
Break of the 4H Bullish FVG
As BTC started its decline from $109,000, it broke through the bullish Fair Value Gap (FVG) that had formed earlier on the 4-hour chart. This gap previously served as a support zone but has now been decisively broken with strong volume. The loss of this level is significant, as it marks a breakdown of the bullish structure and opens the door for further downside movement. In the process of this move lower, BTC has created a new bearish FVG on the 4-hour timeframe. This gap remains open and could potentially act as a magnet for price to revisit, offering a possible short entry if price retraces into that zone. However, the clear break below the previous bullish FVG indicates a shift in momentum and supports a more bearish bias for now.
Downside Target at $102.7K
Given the recent breakdown, the next key level to watch is around $102,700. This area marks the wick low on the 4-hour timeframe and stands out due to the size and sharpness of the wick. Such large wicks often leave behind unfilled orders, which markets tend to revisit over time. The presence of these resting orders makes this level a likely target for the ongoing move down. It also acts as a strong area of potential support, where buyers might step back in if the price reaches that point.
Conclusion
With the rejection from the 0.786 Fibonacci level and the failure to hold the bullish 4H FVG, BTC has shown clear signs of weakness. The breakdown in structure suggests a continuation to the downside is likely, with $102.7k being the most immediate target. This level could serve as a strong support zone due to the unfilled orders left behind by the previous wick. Until BTC reclaims key support levels or shows a shift in momentum, the bias remains bearish in the short term, and traders should remain cautious while expecting further downside.
Thanks for your support.
- Make sure to follow me so you don't miss out on the next analysis!
- Drop a like and leave a comment!

Bitcoin 100K Support Intact, The Bulls Win!Lately we've seen many cries about volume. Where is the volume? There is no volume! Etc. I tend to agree. My excuse in favor of a bullish Bitcoin was to say that low volume as prices moved higher worked as a continuation signal, things change.
We are now looking at BTCUSDT on the Daily timeframe and what I can notice is trading volume being relatively high. The days with high bull (green-buy) volume, are sometimes two to three times higher than the days with bearish (red) volume. This signal seals the deals. The bulls win.
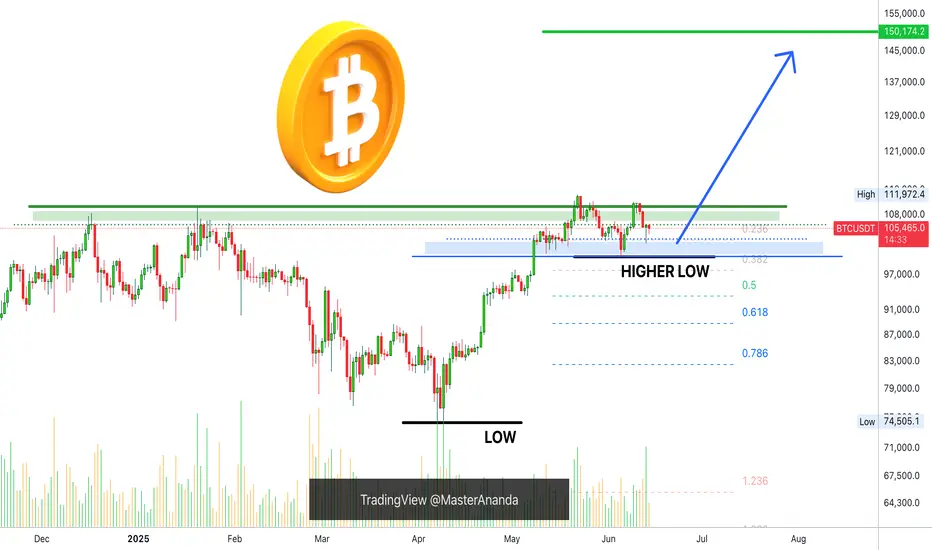
This is a chart drawing that I used in the past. We have the low 7-April low and a higher low 5-June. Very strong bullish action for two months straight; very little retrace, weak bearish action for several weeks, the bulls win again.
The consolidation zone, the accumulation range, is defined here with blue and green, we know the price to be $100,000 and $110,000, Bitcoin trades at the exact middle, above $105,000. Giving the bulls another win.
Yesterday the action produced a higher low compared to 5-June. Even with very bad geopolitical conditions, a surprise war, Bitcoin remains strong. If not even war can break 100K as support, this simply means that Bitcoin isn't going any lower, Bitcoin is going up.
The most revealing part is the fact that Bitcoin didn't even reach 100K. Not in 5-June, not yesterday. 5-June the low was hit at 100,386. Yesterday, the low was 102,656.
There is lots of demand, supply is limited.
People are buying the dip. Whales are buying, institutions are buying; the world wants Bitcoin. Price action says Bitcoin is going up.
We can extract supporting signals from the Altcoins, Ethereum, XRP and Dogecoin are good examples, all the big projects are strong now when we consider the fact they are trading above MA200 daily and weekly, and this confirms a bullish bias with long-term growth.
$150,000 is not the top, Bitcoin is likely to go higher by the end of the next bullish wave. We can consider prices such as $180,000 and $200,000. This is because nobody is selling. Since people are not willing to sell, prices are sure to increase. Many altcoins are now extremely bullish, small and big.
All market conditions are fully aligned, it is only a matter of time.
Patience is key. Prices will rise.
Namaste.
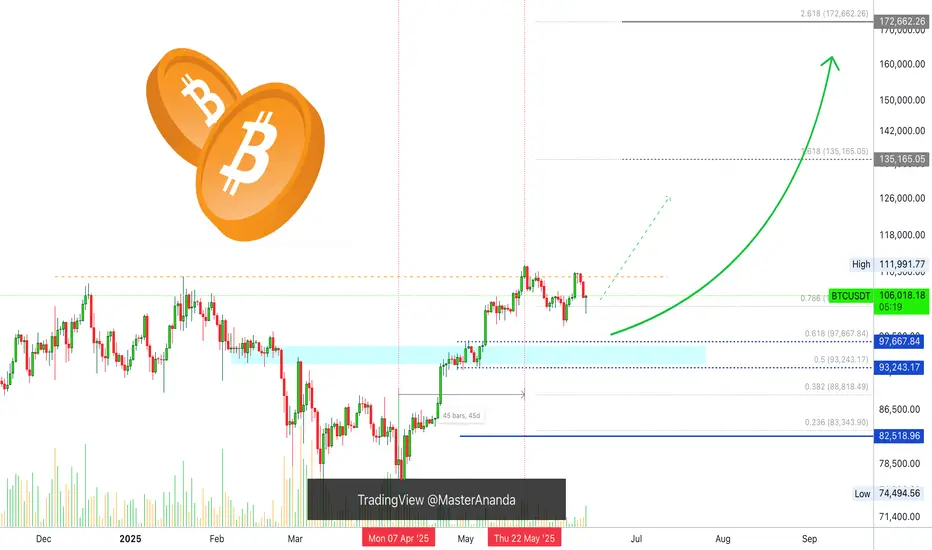
#BITCOIN: Accumulated Volume, Time For $150,000Bitcoin has accumulated nicely, but we don’t expect the price to distribute strongly towards $150k. We have set two targets: 125k and a swing target at 150k. Remember to have a confirmation before entering.
Good luck and trade safely,
Team Setupsfx_

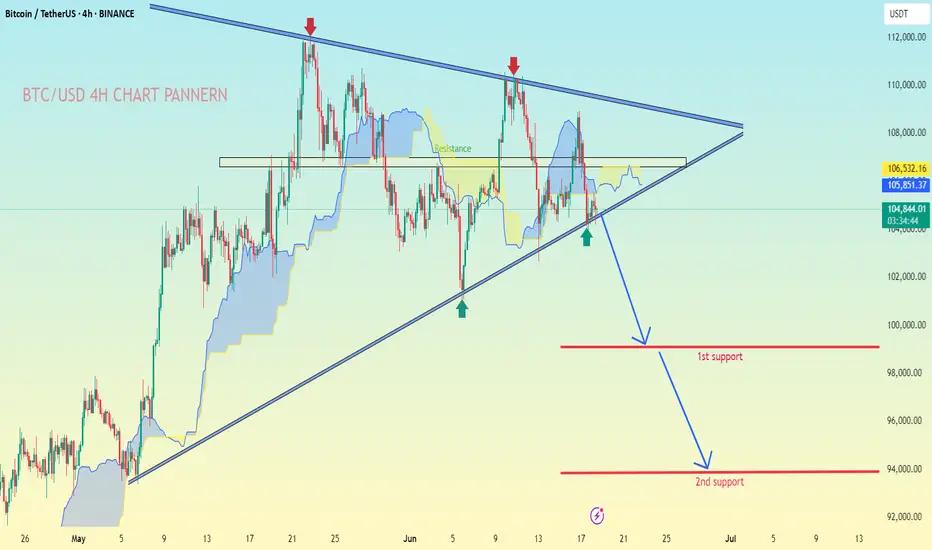
BTC/USD.4H CHART PATTERN.Based on MY BTC/USDT 4H chart the following analysis and price targets apply:
---
📉 Chart Pattern:
A symmetrical triangle pattern is visible, with price nearing a potential breakdown.
You’ve marked a breakdown scenario, supported by the Ichimoku cloud turning bearish and resistance rejection.
The market has respected both support and resistance trendlines multiple times, increasing pattern validity.
---
🎯 Bearish Targets After Breakdown:
1st Support Target:
Level: Around $98,000
This is the first zone where buyers might step in. It aligns with previous consolidation and structural support.
2nd Support Target:
Level: Around $94,000
This is a deeper support level and likely final target if selling pressure continues.
---
🔍 Summary:
Sell below: ~$104,000 (on breakdown confirmation)
Target 1: ~$98,000
Target 2: ~$94,000
Stop-loss suggestion: Above upper triangle trendline (~$106,500 or above recent high)
Let me know if you want a trading strategy with risk/reward ratio or SL/TP management tips.
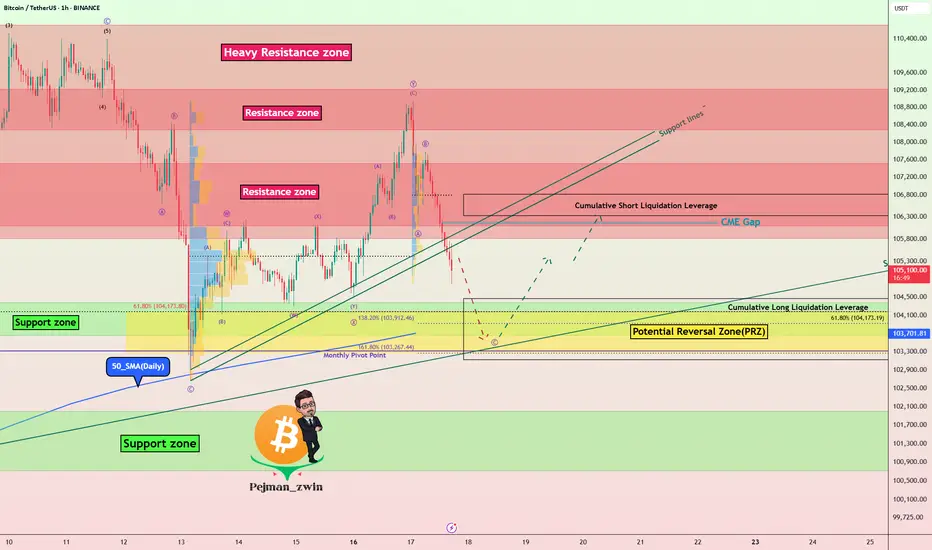
BTC Approaching Key Confluence Zone: Pivot + PRZ + LiquidationsBitcoin ( BINANCE:BTCUSDT ) appears to have broken the Support lines and is currently declining .
In terms of Elliott Wave theory , Bitcoin appears to be completing a corrective wave C . The corrective wave structure is a Zigzag Correction(ABC/5-3-5) .
I expect Bitcoin to start rising again from the Support zone($104,380-$103,660) , Potential Reversal Zone(PRZ) , Cumulative Long Liquidation Leverage($104,471-$103,124) , Monthly Pivot Point , Support line , and 50_SMA(Daily) , and the small CME Gap($106,190-$106,150) will also fill.
Note: Stop Loss: $102,520
Please respect each other's ideas and express them politely if you agree or disagree.
Bitcoin Analyze (BTCUSDT), 1-hour time frame.
Be sure to follow the updated ideas.
Do not forget to put a Stop loss for your positions (For every position you want to open).
Please follow your strategy and updates; this is just my Idea, and I will gladly see your ideas in this post.
Please do not forget the ✅' like '✅ button 🙏😊 & Share it with your friends; thanks, and Trade safe.
BTC AT DEEP CORRECTION Price failed to break and hold above 111,000, forming a double top or potential lower high structure. Strong bearish drop from 111,000 to 103,500, showing momentum shift to the downside. Likely stop-hunt or liquidity grab below prior lows , Next move will depend on whether it breaks above 107k (bullish) or drops below 103k (bearish).
Bitcoin running the tables since launching from 84k base on 4/20After forming a base of $84K, Bitcoin departed this level on April 20th and has held the 50 Day SMA ever since.

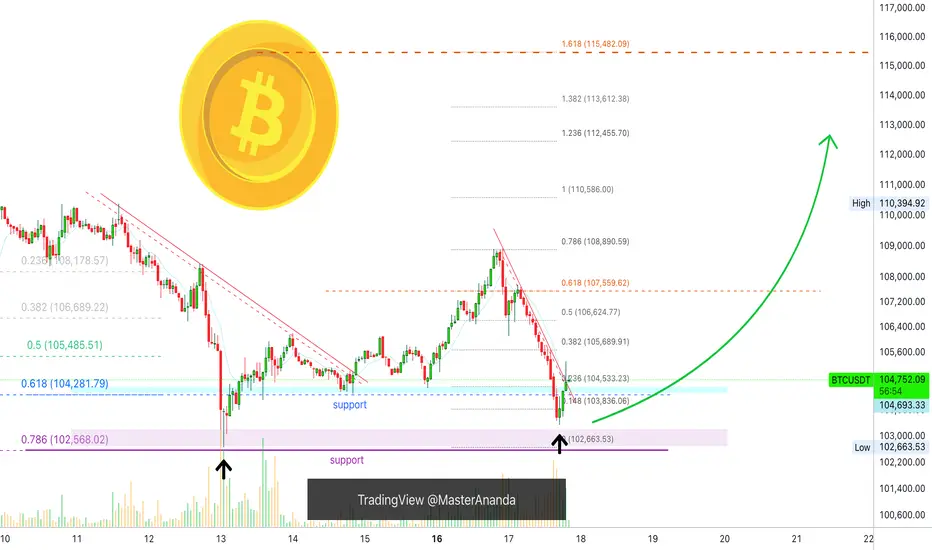
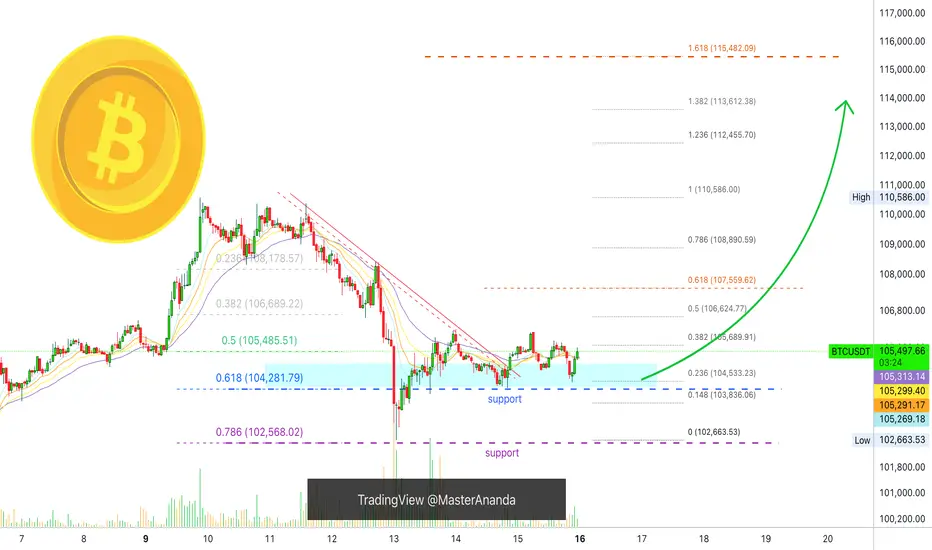
Bitcoin Short-Term, 1H Timeframe, Bullish ($115,482 Next Target)Bitcoin completed its retrace 13-June 01:00 AM with a higher low at $102,663. Price action and trading volume indicates that the bearish move is over. Bitcoin is trading above support in the form of 0.618 Fib. retracement.
Bitcoin is turning bullish moving above EMA34, EMA21, EMA13 and EMA8 all in this current active session.
Immediate support stands between $105,293 and $105,314.
Next support is $104,533 and main support $104,282 matching the 0.618 Fib. retracement level.
Next target easy hit is $106,625, followed by $107,559. The second being a mild resistance.
Bitcoin can easily continue higher short-term aiming next at $108,989 followed by the last high at $110,586. Depending on how this level is handle we can update the short-term view.
The 1H timeframe is bullish now based on price action, candlestick patterns, higher lows, moving averages and the oscillators.
Namaste.
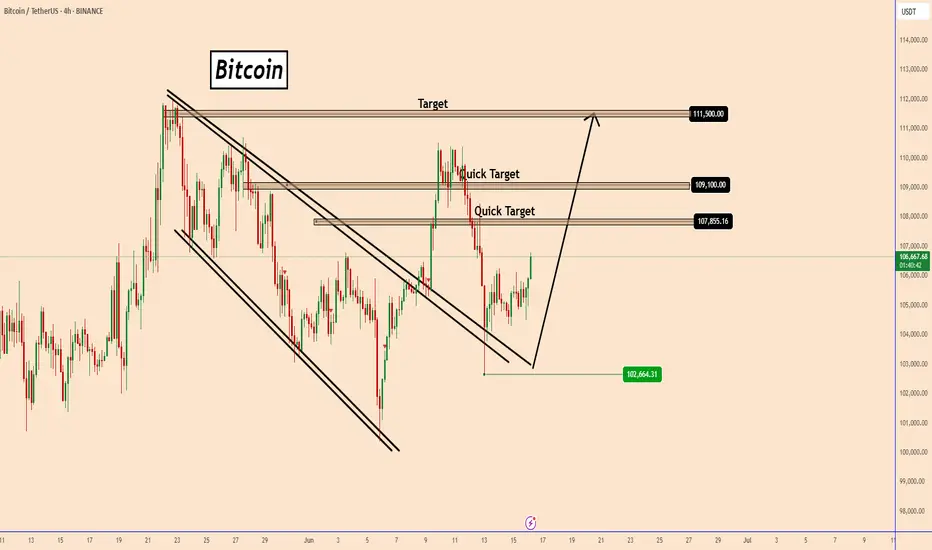
Bitcoin: Strong Support Holds Amid Market UncertaintyBitcoin: Strong Support Holds Amid Market Uncertainty
Bitcoin recently tested a key support zone near 102,670, bouncing back in alignment with the broader bullish trend.
The ongoing Middle East conflict continues to reinforce BTC’s strength, establishing another solid support level at 102,650, which signals that the price remains well-supported by buyers around this zone.
For Bitcoin to dip below this area, it would likely require significant market manipulation or unexpected developments.
At present, BTC suggests an upward trajectory, potentially reaching 107,850, 109,100, and even a retest of the previous highs near 111,500.
You may find more details in the chart!
Thank you and Good Luck!
❤️PS: Please support with a like or comment if you find this analysis useful for your trading day❤️